Trade signal | TrueFi (TRU) is ready for the next pumpHi dear friends, hope you are well and welcome to the new trade signal of TrueFi (TRU) with US Dollar pair.
Recently we caught almost 71% pump of TRU as below:
Now on a 4-hr time frame, TRU has formed a bullish Cypher for the next pump.
Note: Above idea is for educational purpose only. It is advised to diversify and strictly follow the stop loss, and don't get stuck with trade.
Truefi

TRU/USDT 1D. Secondary trend. Local accumulation range.TrueFi/USDT 1D. Local and secondary trends.
In the main trend - downtrend channel was formed. You can check this if move chart to the left in the main idea.
This channel was broken up in winter 2023, when there was local pump on all crypto market.
At that time, price pumped 360% to 0.13$ zone and from the the pullback has started. It formed quite an aggressive downtrend, which has been broken Jun 2023.
After that falling wedge started to form. The support lvl was formed at 0.0323$, while the decline lasts for 232 days as for now, just an interesting point.
Price formed the range with, as already mentioned, support at 0,0323$ and resistance at 0,0392$(14 - which is "balance").
Price has deviated this ranged locally - reaching the minimums of winter 2022-2023 - then turning back to the range. Now, the price is near the resistance zone locally.
During all that secondary downtrend we've seen 2 volume spikes - 1 on Jun 1 2023, other on Aug 21. As for now the price is consolidating in quite a small range of 25%. It has also broken the resistance of the falling wedge locally.
All the details are on chart. If market allows - locally we can reach the middleterm resistance zone, shown on chart. It's 0.0609$ to 0.0777$ zone. Very logical resistance in terms of numbers.
It may happen only if we break and hold above 0.0392$ lvl zone(current range resistance). Everything is with accordance to the market tendency.
Linear chart is for the clarity(no shadows of candles). Percent to the resistance zones are shown.
There has been also the retest of the broken local falling wedge(on chart).

TRU new bull run has startedHello Traders,
As you can see on the chart, We have two bullish patterns: Double bottom and falling wedge.
Let's revisit this idea a few months later ;)
Please hit the boost button and follow me for more ideas.
Thanks

#TRUUSDT's Potential Uptrend with Fibonacci Play💎Today's spotlight is on #TRUUSDT. The token has recently anchored its support at the $0.030 mark, aligning nearly perfectly with the 78.6% Fibonacci retracement level. Before this stabilization, #TRU sketched out a double bottom pattern. This pattern, followed by a surge past the local resistance, hints at a possible trend reversal.
💎 What does this mean for traders? The scales now seem to tip towards an upward correction. As long as the price stays comfortably above the double bottom region, specifically above the $0.026 trough, we can anticipate a robust upward pullback.
💎 On the resistance front, our eyes are set on another 78.6% Fibonacci retracement level at $0.037. This level intriguingly mirrors the downtrend trendline, making it a key point of interest.
💎 However, a word of caution: The MCP team remains vigilant about today's low, marked by the Fibonacci bounce. A descent below this point might cast shadows on the prospective upward correction.

TrueFi get ready for Lift off ?!!👀 TRU Today Analysis💎TrueFi is crafting a falling wedge pattern, hinting at a potential bullish reversal on the horizon.
💎 It's trading within a high demand zone, and the strong demand in this area further bolsters the potential for an upward move.
💎 analyze the falling wedge pattern and the high demand zone collectively, it suggests a bullish outlook for TRUUSDT.
💎 A successful breakout, accompanied by increasing volume, would validate the bullish scenario and potentially lead to further upward price movement.
💎 In the ever-changing crypto universe, staying updated and adaptable is essential. Stay tuned for more updates and enjoy your trading journey!

TrueFi (TRU) formed bullish Gartley for upto 127% moveHi dear friends, hope you are well and welcome to the new update on TrueFi (TRU) with US Dollar pair.
Previously we caught a nice pump of TRU as below:
Now On a 4-hr time frame, Tru has formed a bullish Gartley pattern.
Note: Above idea is for educational purpose only. It is advised to diversify and strictly follow the stop loss, and don't get stuck with trade

$TRU/USDT 3h (#Bybit) Descending channel breakoutTrueFi just regained 50MA support and seems about to push higher and recover, short-term.
⚡️⚡️ #TRU/USDT ⚡️⚡️
Exchanges: Binance Futures, ByBit USDT
Signal Type: Regular (Long)
Leverage: Isolated (3.0X)
Amount: 4.7%
Current Price:
0.08935
Entry Zone:
0.08805 - 0.08295
Take-Profit Targets:
1) 0.09990
2) 0.11075
3) 0.12160
Stop Targets:
1) 0.07345
Published By: @Zblaba
$TRU #TRUUSDT #TrueFi #DeFi #TrustToken
Risk/Reward= 1:1.2 | 1:2.1 | 1:3.0
Expected Profit= +50.5% | +88.6% | +126.7%
Possible Loss= -42.3%
Estimated Gaintime= 1-2 weeks


TRU's most significant bullish spikeTrueFi (TRU) is trading at 0.1195 with an RSI of 60.76, indicating it is now neutral. TRU's 4-hour timeframe shows a Fibonacci level of 0.0780 at the lower and 0.1158 at the higher end. The upper Bollinger band for the same timeframe is 0.1319, and the lower Bollinger band is 0.0682, with a middle band of 0.1001. The volume oscillator is currently at 11.55%, while the MACD is 0.0107, and the stochastic oscillators show D% at 84 and K% at 65.
During its downward trend, TRU experienced a strong price increase in the last 24 hours, finding strong support in the range of 0.0230 to 0.0270 dollars. This increase in demand has pushed the price towards an important resistance level in the range of $0.1385 to $0.1580, which has previously caused a 50% negative reaction but has also been the starting point for TRU's most significant bullish spike.
TRU is in a neutral state and has experienced a strong price increase in the last 24 hours. The support from buyers indicates positive sentiment towards the asset, but the resistance level it is approaching is significant and has previously caused negative reactions. As such, it will be important to monitor how TRU reacts to this resistance level in the coming days and whether it can break through it to reach higher prices.

$TRU looks nice
Feb 25
Documented bought trailer position of #TRUEFI @ 516 BUT largest buy of $TRU was @ 405
Sold around 1200
Buying half of sell here, like the 4hr
(sell portion @ 73, if pulls back, keep trading portion)
Daily see Bull Flag? TEXTBOOK
#defi #yield #crypto #altcoin
----
TODAY
$TRU pulls back to the red Moving Avg will rebuy small portion sold @ 73
Buy volume pretty decent here
Other limits still out there
#DEFI #yield #crypto #altcoins #TrueFi

✳️ TrueFi | This Is How It All Starts... A New Bull MarketThis is how it all starts... This is how Cryptocurrency tells you that the bottom is in and the entire market is preparing for years of growth... YEARS!
This is the weekly timeframe for TrueFi (TRUBTC)... Great growth, amazing growth!
Yesterday alone, this pair grew by more than 222.22% in a single day.
The total growth since 21-January totals 290%.
This is not bear-market action.
This is not a "fake" anything that will lead to a lower low in weeks or months.
This is a massive bullish breakout that only happens after a strong bear market.
After years of red.
Soon it will be 7 years since I joined TradingView but I've been dealing with cryptocurrencies much longer, for 10 years.
Each bear market only last less than 2 years, the same for bull markets.
The full cycle is 4 years.
2 Years bearish, 2 years bullish but both the bottom and top are hit before the full 2-years period is complete.
I will cut a long-story short.
What you are seeing now is the beginning of a long period of growth.
Just as markets, cryptos, assets, trading pairs on the way down can hit new All-Time Lows, they can also hit new All-Time Highs on the way up.
The majority of the Altcoins will hit their new ATHs BEFORE Bitcoin, in less than 2 years.
Bitcoin should be one of the last ones to hit a new All-Time High.
Maybe it is not fair to talk already about new ATH when so many people are still dealing with denial but we use the charts to predict the future... To extract information and prepare before-hand for what to expect.
If you are a beginner, you will make more money holding than jumping from pair to pair.
If you are an experienced trader... This is your chance, leave behind all doubts and focus on your own personal growth, focus on maximizing profits, focus on success.
Thank you for reading.
This is only the beginning.
I love you!
Namaste.

TrueFi (TRU) formed bullish BAT for upto 11.50% moveHi dear friends, hope you are well and welcome to the new update on TrueFi ( TRU ) with US Dollar pair.
Previously we caught a nice trade of TRU:
Now on a 2-hr time frame, TRU has formed a bullish BAT pattern.
Note: Above idea is for educational purpose only. It is advised to diversify and strictly follow the stop loss, and don't get stuck with trade

TrueFi (TRU) formed bullish Cypher for upto 46% pumpHi dear friends, hope you are well and welcome to the new update on TrueFi ( TRU ) with Bitcoin pair.
On a daily time frame, TRU has formed a bullish Cypher pattern.
Note: Above idea is for educational purpose only. It is advised to diversify and strictly follow the stop loss, and don't get stuck with trade.

TRU/usdt longi think breakout would be massive this time, charts making triangle pattern in 1H, 4H and 1DAY charts.
if it holds the trendline then pattern is valid otherwise pattern would be invalid. Do your own research

Eliot-style analysis of TruUsdt currency; Is 700% profit coming?According to the type of movements of this currency, it can be expected that the third downward wave has ended.
According to the high volumes shown in the square, it can be seen that the recent upward movement of the price can be the beginning of the fourth downward wave.
Hence, we go to confirm these volumes and change its temporary trend and check the divergence of the third wave.
Having a positive divergence in wave 3 confirmed the volumes; And it issues an increase signal to us.
The easiest way to extract the price target is to use the Fibonacci retracement tool, which can be used for the purposes of 50% and 61.8%.
Final price target based on Elliot wave count; It is right at the starting point of wave 2 or the ending point of wave 1.
Share your comments with me and if this analysis was useful for you, encourage me with your likes.
Be successful and profitable.
BINANCE:TRUUSDT
COINBASE:TRUUSDT
POLONIEX:TRUUSDT
KUCOIN:TRUUSDT
FTX:TRUUSDT
PHEMEX:TRUUSDT
COINEX:TRUUSDT
GATEIO:TRUUSDT

TRU inverted head and shoulders#TRU/USD
$TRU shaped an inverted head and shoulders.
🐮 short term head and shoulders can reach price to resistance between $0.248 and $0.27.
and if the bigger head and shoulders going to shape, can increase price to resistance between $0.34 and $0.37.

TrueFi (TRU) formed big bullish Gartley for upto 500% moveHi dear friends, hope you are well and welcome to the new update on TrueFi ( TRU ).
Previously we had a nice trade of TRU:
Now on a weekly time frame, TRU has formed a bullish Gartley pattern.
Note: Above idea is for educational purpose only. It is advised to diversify and strictly follow the stop loss, and don't get stuck with trade

TRU inside falling wedge try to break out#TRU/USDT
$TRU hold the support zone and pumped to resistance zone that is the same with descending resistance line.
break out from current resistance will increase price to next resistance zone around $0.63, and break out from $0.69 help price to make a new all time high.
TRU above support, 40% - 160% increase#TRUUSDT
$TRU have sideway moves between support and resistance zone.
now price is above support zone and can head up to resistance zone.
break out from resistance zone can lead price toward $1.
break below support zone can drop price to support around $0.3.

TRU/BTC Daily Technical AnalysisTRU/BTC Daily Technical Analysis
All indicators goin to be POSSITIVE
Resistance: 0.00000885 - 0.00001248
Support: 0.00000714
If broke ...885 target be ...1248

TRU inverted H&S If you missed my previous TRU idea...
...then there could be another chance to get in as TrueFi is forming Inverted Head and Shoulders 🤷 and if price breaks up I think there is chance for run to 1.04 and even higher. Will set the BUY LIMIT order to catch the pullback to Neckline (testing it from above).
ENTRY : Backtest of the broken Neckline @ 0.722
SL : Right Shoulder @ 0.569
TARGET : Inverted H&S target projection @ 1.040
RRR : 2
INVALIDATION : when SL level hit
Check my other stuff in related ideas.
Please like👍, comment🗣️, follow me✒️, enjoy📺!
⚠️Disclaimer: I'm not financial advisor. This is not a financial advice. Do your own due dilingence.

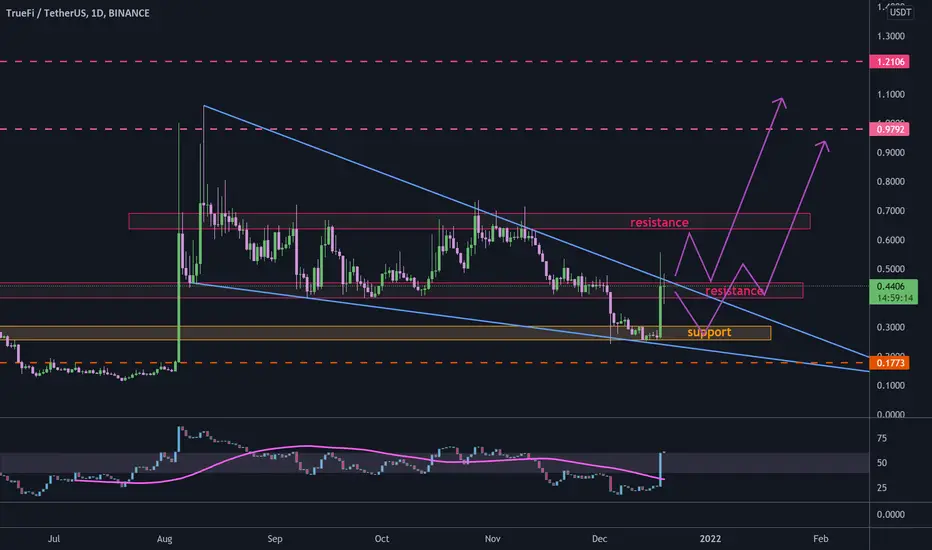
TRUe pumpTrueFi had a great pump (6x in two days) and the price got above the triangle apex. Now the price is heading to the apex to test it as support and if the price drops to the BUY ZONE 0.4-0.37, I will be looking for longs. Targets 0.92 and 1.15.
Like👍, follow✒️, enjoy📺!

TRU Ready to Pump 🚀🔥 Price breakout the dynamic resistance and completed the pullback to the resistance. Moreover, RSI breakout the 60 level.
There's possibility of price growth to the specified level. 🚀
