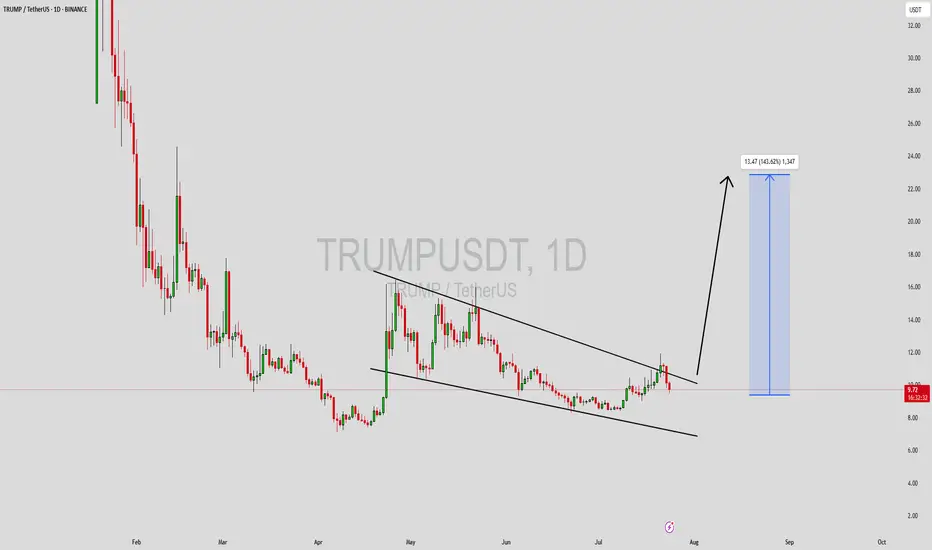
TRUMPUSDT Forming Falling WedgeTRUMPUSDT is currently forming a well-defined falling wedge pattern—a bullish reversal structure that often leads to significant upside breakouts. The price has been consolidating within narrowing trendlines and now appears to be approaching a breakout point. Historically, falling wedge patterns in the crypto market have led to aggressive rallies, especially when combined with rising volume and strong community sentiment. With good volume backing this setup, a breakout could trigger a sharp move to the upside, projecting an expected gain of 90% to 100%+ in the coming sessions.
Investor interest in the TRUMPUSDT project has been steadily increasing, likely fueled by the coin’s strong branding and community-driven momentum. Meme-based and politically themed tokens have seen explosive growth in recent bull cycles, and TRUMPUSDT may be positioning itself to capitalize on similar attention. With sentiment aligning positively and technicals flashing bullish signals, the coin is attracting both short-term swing traders and long-term speculative holders.
If TRUMPUSDT confirms a breakout above the upper wedge resistance with volume confirmation, we could see rapid price expansion. Traders should monitor key levels and consider re-entry on retests or strong bullish candles. The momentum shift is already becoming apparent, and this coin could turn into a trending asset in the meme-token segment very soon.
Keep this setup on your radar as it may provide high-reward opportunities. Monitor community updates, upcoming events, and broader meme coin momentum across the market for additional confirmation.
✅ Show your support by hitting the like button and
✅ Leaving a comment below! (What is You opinion about this Coin)
Your feedback and engagement keep me inspired to share more insightful market analysis with you!
Trump
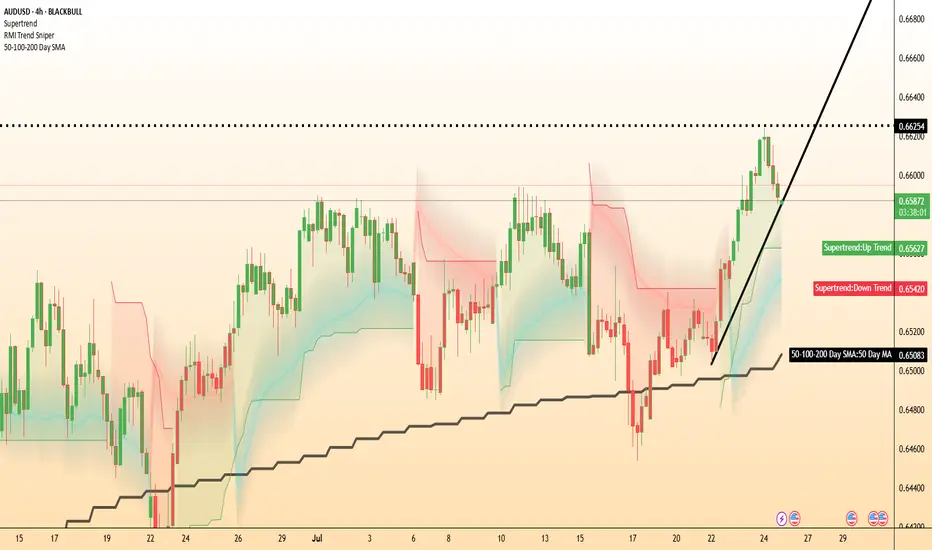
AUD/USD tests uptrend as Trump targets Powell at Fed siteThe US dollar is trading mixed after President Trump made a rare appearance at the Federal Reserve’s renovation site, in an attempt to distract from you know what.
While the visit had no formal policy announcements, Trump did try to further undermine Chair Jerome Powell by erroneously claiming the renovation cost had blown out to 3.1 billion by adding the cost of a building finished 5 years ago.
Meanwhile, AUD/USD could be of the most interest. Traders might like to watch to see if it can hold its uptrend after its downside breakout from yesterday. AUD/USD remains potentially supported above its 50-DMA, with momentum pointing to potential further upside beyond 0.6625.
SHORT ON EUR/NZDEZ Has given a nice CHOC to the downside with plenty of sell side liquidity to be collected.
I will be selling EZ to the next level of demand looking to catch 300-500 pips

Cup & HANDLE + Mini Double Bottom: $TSLA to $610 ScenarioI maintain a bullish stance on Tesla ( NASDAQ:TSLA ), supported by a compelling combination of technical patterns and strong fundamental drivers. The current chart setup reveals a Cup and Handle formation complemented by a Mini Double Bottom, both of which are classic bullish continuation patterns. These suggest a potential breakout scenario that could drive NASDAQ:TSLA to $610 by year-end.
Technical Roadmap:
Gap Fill to $408: Anticipated earnings momentum, particularly from the Robotaxi segment, is likely to propel the stock to fill the previous gap at $408.
Consolidation at $450: Following the gap fill, I expect a consolidation phase forming a “box” around the $450 level.
Breakout to $610: A decisive breakout above $450 could trigger a strong rally toward the $610 target.
***Current Key Catalysts Supporting the Bullish Thesis:
Robotaxi Expansion: Tesla’s autonomous driving initiative is gaining traction, with Robotaxi developments expected to significantly boost revenue and margins.
India Market Entry: Tesla’s upcoming launch in India opens access to one of the world’s largest and fastest-growing EV markets.
In-House Chip Development & Dojo 2 Expansion: Continued investment in AI infrastructure and custom silicon enhances Tesla’s competitive edge in autonomy and robotics.
Tesla Diner Launch: The near-completion of Tesla’s themed diner adds to brand visibility and customer engagement.
Global EV Adoption: Tesla continues to benefit from rising EV demand across multiple international markets.
Optimus Robot Hype: Growing interest in Tesla’s humanoid robot project could unlock new revenue streams and investor enthusiasm.
Favorable Macro Trends: A declining interest rate environment supports higher valuations for growth stocks like Tesla.
Institutional Accumulation: Recent trading activity suggests that institutional investors are accumulating shares within the current range.
Grok AI Integration: The integration of Grok AI into Tesla vehicles could enhance user experience and differentiate Tesla’s infotainment ecosystem.
Investment Strategy:
I recommend initiating or increasing exposure to NASDAQ:TSLL (leveraged Tesla ETF) ahead of the upcoming earnings report. This could offer amplified returns if the bullish scenario plays out. Consider accumulating further on any dips, particularly during the consolidation phase around $450.
BUY NOW NASDAQ:TSLA NASDAQ:TSLL

Huge Bear Trap next in line??Ethereum Exit Queue: 518,180 ETH
Half a million ETH is currently queued for unstaking on Ethereum...
Keep in mind, August 1st, Trump's Reciprocal Tariffs get in effect
Everyone's talking about BTC's new ATH, ETH's rally, XRP new ATH, but no one is talking about August 1st...
Manipulation is taking place. Stay safe, because a huge bear trap might be next in line (BTC back to 90K)
*NOT INVESTMENT ADVICE*
#crypto #ethereum #eth #btc #bitcoin #trading #xrp #trump #tariff #finance #economy

CUP AND HANDLE $TSLA TO $515 MINIMUMThe cup and handle is a bullish chart pattern commonly used by traders to spot potential buying opportunities. It features a rounded "cup" formation followed by a slight downward drift forming the "handle." This pattern typically signals a continuation of an upward trend once the handle completes its consolidation phase.
ROBOTAXI BOOM
BUY NOW NASDAQ:TSLL NASDAQ:TSLA

NordKern - XAUUSD InsightNordKern | Simplified Insight OANDA:XAUUSD – Short Opportunity Ahead
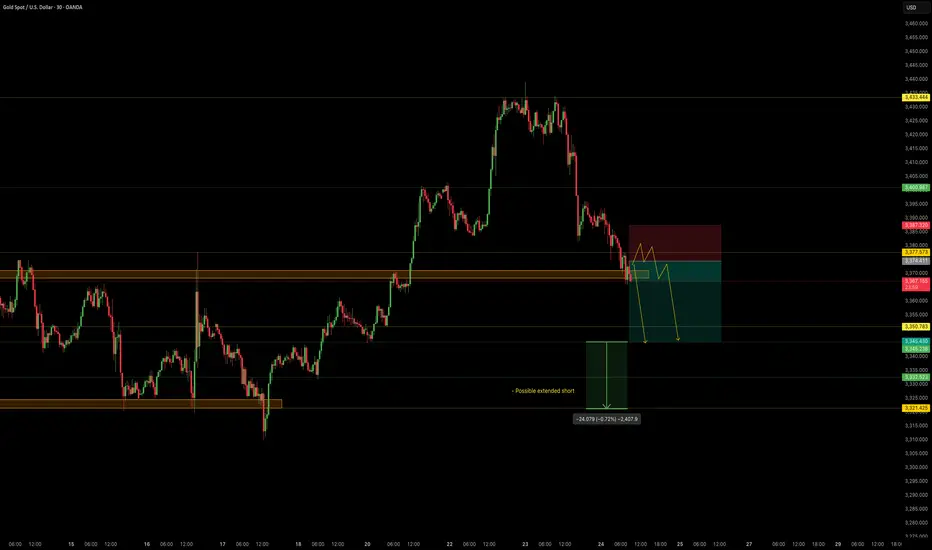
Gold is now near our important level at 3370, offering a shorting opportunity considering recent events and technical action.
Gold Price Decline – What's Behind It?
In the last two sessions (July 23–24), gold has retreated strongly owing to a set of global as well as market-specific circumstances:
1. Trade Deal Optimism
Advances in U.S.–Japan and U.S.–EU trade discussions lessened worldwide uncertainty, decreasing demand for gold as a safe-haven.
2. Higher U.S. Yields
Higher Treasury yields are rendering non-yielding assets such as gold less appealing, adding to downward pressure.
3. Technical & Profit-Taking
Following a recent rally, gold was exposed to selling. Stop-loss and profit-taking triggers hastened the fall.
Summary of Key Drivers
U.S. Trade Deals: Reduced geopolitical risk
Higher Treasury Yields: Decreased gold's relative attractiveness
Technical Selling: Enhanced the downward trend
Trade Setup – Bearish Bias
Entry : 3374.4
Stop Loss : 3387.3
Take Profit : 3345.4
Extended Target : 3322
Key Notes:
- Trade Deal Optimism: U.S.–Japan and U.S.–EU agreements eased global tensions, reducing demand for gold as a safe-haven asset.
- Yield Pressure: Rising U.S. Treasury yields made gold less attractive compared to interest-bearing alternatives.
- Technical Selling: Profit-taking and stop-loss triggers accelerated the decline after gold’s recent rally.
This setup remains tactically driven. Manage risk carefully and monitor for any renewed political shifts.
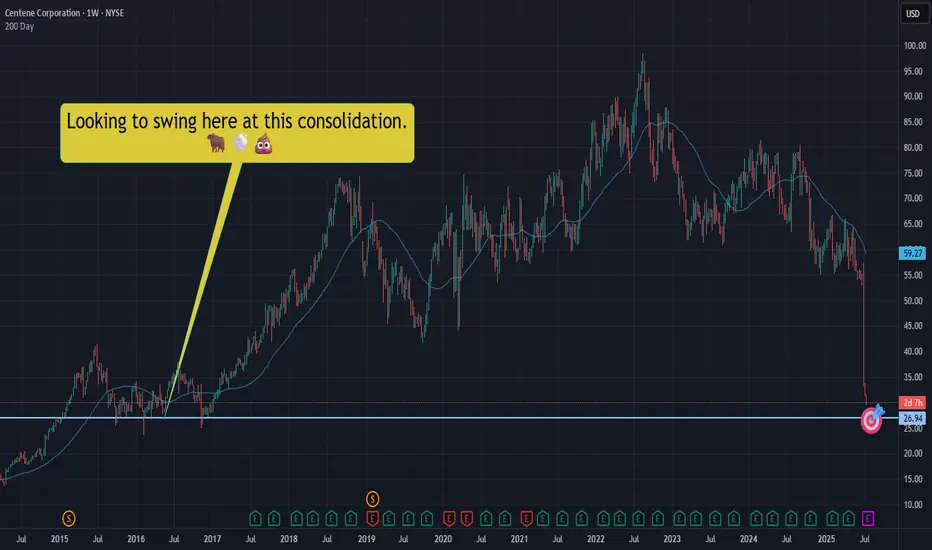
CNC|Let's take a swing at a falling dagger! NYSE:CNC slicing through the void, well.... like a falling dagger through a void.
Not trying to catch this bad boi, but we should expect a bounce at some point. Let's swing for a bounce in that $26.90ish area.
This is NOT a YOLO and I hope it's not an "oh no!" Let's keep our wits about us - starter position only. We can add if we need to, but let's just hope we sell and make some quick Christmas money.
THANK YOU FOR YOUR ATTENTION ON THIS MATTER
Blokblok usdt daily analyses
time frame daily
long position risk of ratio >9
target 0.00075$
if price breaks the upper line my long position will start. duration of this forecast is long
if it cannot break and move between orange lines my short position will be active. this duration is short
short position risk of ratio >2
target 0.00027$

TRUMPUSDT: Massive Reversal Incoming? Reaccumulation Zone!
📉 Current Market Outlook:
TRUMPUSDT is currently positioned at a highly strategic technical level. After an extended downtrend since February—dropping from the 60 USDT region to a low of around 7.13 USDT—price has now stabilized and entered a strong reaccumulation zone between 8.50 and 10.20 USDT.
This zone has acted as a reliable support range and shows signs of smart money accumulation, as evidenced by volume spikes and strong price reactions off this base.
---
🧠 Technical Pattern & Structure:
🔸 Base Accumulation / Reaccumulation Rectangle
Price has been consolidating in a tight horizontal range, forming a classic reaccumulation pattern, often seen before major breakouts.
🔸 False Breakdown – Bull Trap Reversal Setup
The brief dip below 8.50 USDT (to 7.13) followed by a strong recovery suggests a potential “shakeout” phase to remove weak hands before a rally.
🔸 First Higher Low Formation
Recent price action has formed a higher low, a key structural signal of a potential trend reversal from bearish to bullish.
---
🟢 Bullish Scenario (Primary):
If price continues to hold above the reaccumulation zone and breaks above 12.48 USDT with strong volume:
Short-Term Targets:
🔹 15.11 USDT
🔹 17.11 USDT
Mid-to-Long Term Targets (if bullish momentum sustains):
🔸 21.59 – 27.96 USDT
🔸 Ultimate target: 46.65 USDT (retest of previous major supply zone)
📈 Potential upside: Over 200% from current levels
---
🔴 Bearish Scenario (Alternative):
If the price fails to hold above the demand zone (drops below 10.00 USDT):
Possible retest of key supports:
🔹 8.50 USDT
🔹 7.13 USDT (major swing low)
⚠️ A confirmed breakdown could signal a continuation of the macro downtrend.
---
🔍 Key Levels to Watch:
Price Level Type Notes
7.13 USDT Major Support Previous swing low
8.50–10.20 USDT Demand Zone Reaccumulation / strong buyer interest
11.25 – 12.48 USDT Key Resistance Breakout trigger zone
15.11 – 17.11 USDT Minor Resistance First bullish targets
21.59 – 27.96 USDT Extension Targets Bullish breakout continuation
46.65 USDT Major Supply Historical resistance zone
---
🧠 Conclusion:
TRUMPUSDT is showing early signs of a macro reversal, with clear accumulation structure and breakout potential forming above a well-defined base. If confirmed by volume and price structure, the upside could be significant.
However, traders should remain cautious and watch for volume confirmation and failure points around key support.
#TRUMPUSDT #CryptoBreakout #AltcoinSetup #BullishReversal #TechnicalAnalysis #ReaccumulationZone #SmartMoneyMoves #PriceActionCrypto #AltcoinAnalysis#CryptoSignals #AltseasonReady

Tariffs incoming...July 23: Markets are booming.
August 1st: Tariffs.
I'm just saying, it might be a nice discount...
#market #finance #tariff #trump #crypto #forex #stocks #economy #trading
Trump did it again!Donald Trump did exactly what he did in his previous term: Dollar Devaluation .
Reason? Strengthening the US exports.
Will it work? We'll see.
What's your thoughts?
#dollar #forex #euro #devaluation #trump #exports #trading #algo

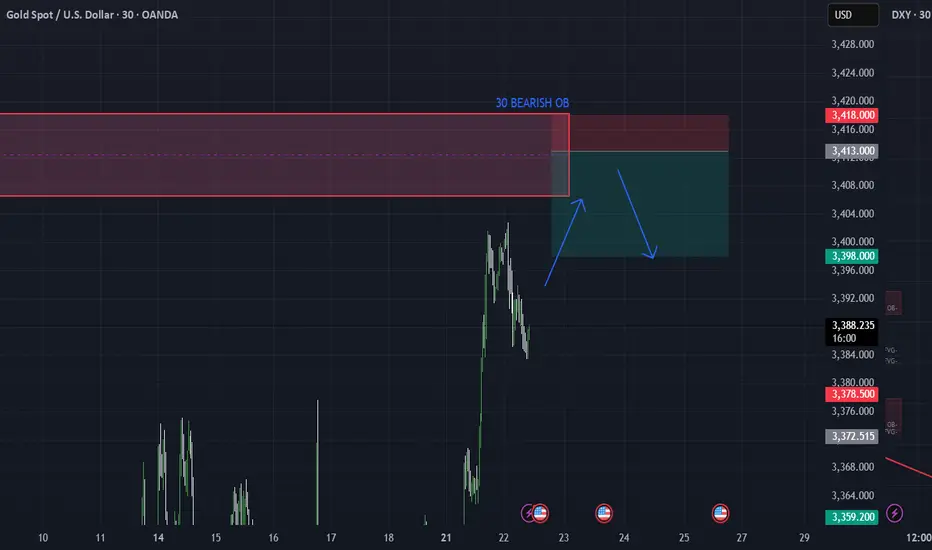
XAUUSD 30M – OB Sell Limit Setup for 3R Opportunity by PhoenixFXGold 30M Chart – Smart Money Sell Limit
We’re watching a clean Order Block (OB) on the 30-minute timeframe as price retraces into a key supply zone. This setup offers a high-probability reversal opportunity with a 3R risk-to-reward ratio. ✅
📍 ENTRY: 3413
🛑 SL: 3418 (above structure)
🎯 TP1: 3408 (1R)
🎯 TP2: 3403 (2R)
🎯 TP3: 3398 (3R)
The price action shows signs of exhaustion and premium pricing as it returns into a previous OB. We’re positioning with precision and tight risk.
📌 Strategy:
– 30M OB zone
– Clear BOS + retracement
– Set & forget execution
#XAUUSD #Gold #OrderBlock #SupplyZone #SmartMoney #PhoenixFX #RiskReward
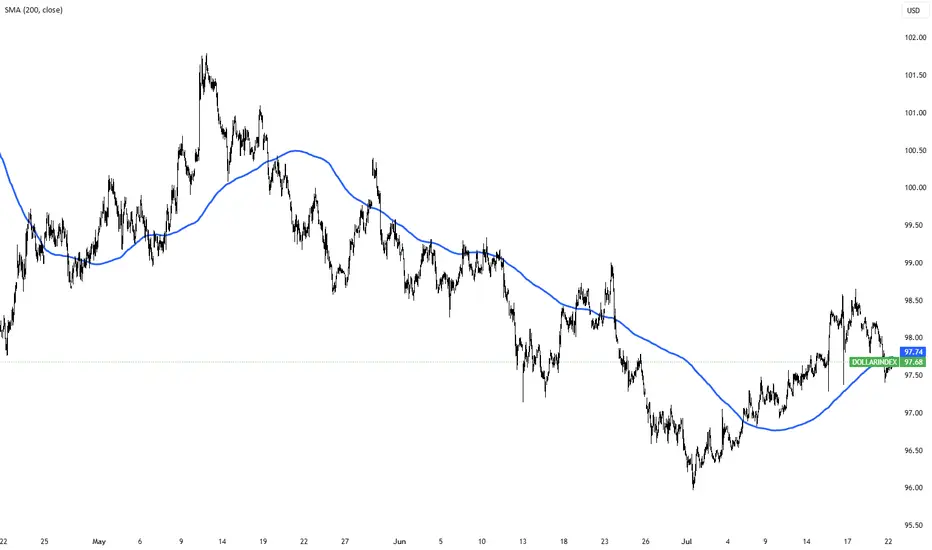
Dollar Index Holds Below 98 as Markets Await Trade Deal ProgressThe dollar index remained below 98 today, extending its two-day decline as investors watched trade negotiations ahead of the August 1 deadline. Treasury Secretary Scott Bessent said deal quality is the priority, suggesting Trump could grant extensions to countries showing real progress.
Markets are also focused on Fed Chair Powell’s speech for signals on interest rates. Despite Trump’s push for a cut, traders are not expecting action this month.
$PENGU Penguin consolidation at the moment.As long as CSECY:PENGU remains between .039 and .035 I consider it in consolidation. Breaks above or below these levels should see the targets posted.

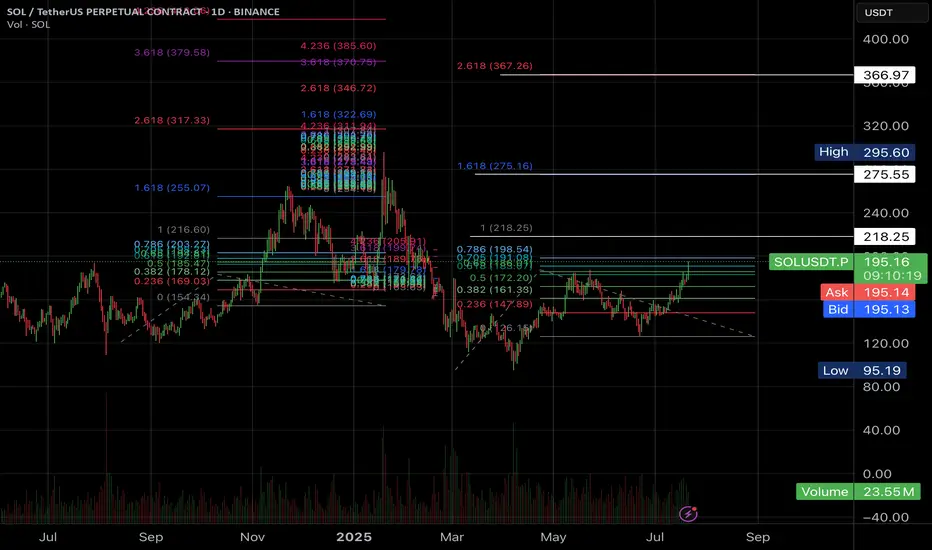
#SOL for 367$?Hi Padawans,
Hope you’re all doing well.
The charts don’t lie — but remember, this isn’t financial advice.
I’m currently eyeing long positions up to the levels highlighted in the chart.
Best regards,
CryptoObi
TRUMP Looks Bullish (1D)It seems that the bullish phase of the Trump coin has started from the point where we placed the green arrow on the chart.
We appear to be at the end of wave B of the bullish phase. As long as the price holds above the green zone, it can potentially move toward the targets marked on the chart.
A daily candle closing below the invalidation level would invalidate this analysis.
For risk management, please don't forget stop loss and capital management
Comment if you have any questions
Thank You

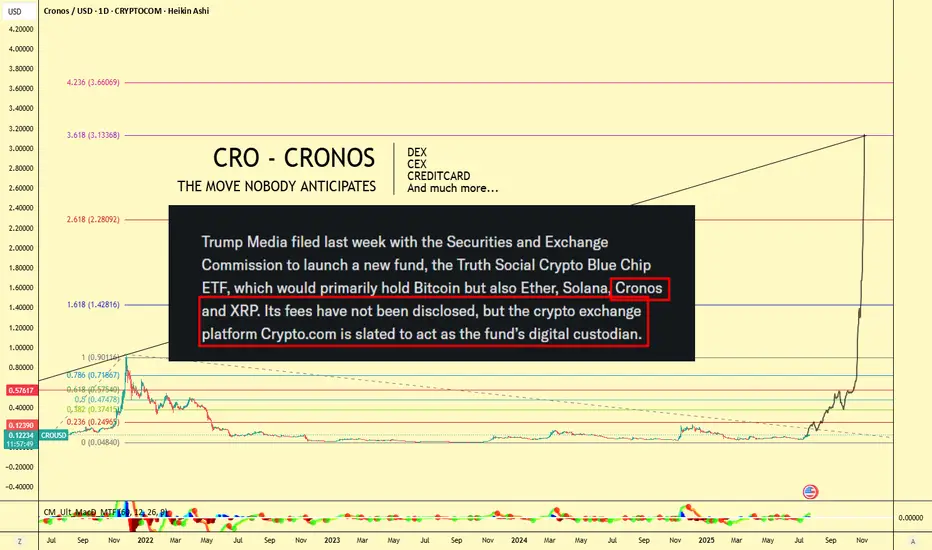
CRO (Crypto.com) $3 Target! Don't Miss This Move🪙 Ticker: OKX:CROUSDT
🕰 Chart: 1D (Heikin Ashi)
🔧 Tools Used: Fibonacci Extension, Fundamental News (ETF Filing)
🔍 Chart Analysis: Fibonacci Extension Targeting $3+
The Fibonacci Extension tool has been applied to the major CRO impulse wave from its peak near $0.90 (late 2021) to the 2022–2023 bottom at $0.0484, confirming a multi-year retracement and consolidation period.
Let’s break down the major Fib levels:
Extension Level Price Target
0.236 $0.2495
0.382 $0.3741
0.618 $0.5745
1.0 $0.9011
1.618 $1.4281
2.618 $2.2809
3.618 $3.1336
📌 Current Price: ~$0.12
🔥 Upside Potential to $3.13+ — a 25x move from current levels if full extension plays out!
📣 Fundamental Catalyst: CRO in Trump Media ETF
According to the chart note (sourced from SEC-related headlines):
"Trump Media filed with the SEC to launch a new ETF, the Truth Social Crypto Blue Chip ETF, which would primarily hold Bitcoin, but also Ether, Solana, Cronos (CRO), and XRP."
Even more important:
"Crypto.com is slated to act as the fund’s digital custodian."
This is massive fundamental validation for CRO — not just as a token, but as an ecosystem and financial infrastructure provider.
🌐 Why Crypto.com Matters: Utility, Ecosystem, Adoption
Crypto.com isn't just an exchange — it's a comprehensive Web3 ecosystem, which includes:
🔁 CEX (Centralized Exchange):
Buy, sell, stake, and trade hundreds of cryptocurrencies with high liquidity and low fees.
🔄 DEX (Decentralized Exchange):
Cronos Chain supports decentralized trading and DeFi apps — with low gas fees and EVM compatibility.
💳 Visa Credit Card Integration:
Crypto.com offers one of the most popular crypto Visa debit cards — earn cashback in CRO and enjoy perks like Spotify/Netflix rebates.
📱 Mobile Super App:
Buy/sell/stake/farm on-the-go with a seamless user interface.
📈 Earn & Lending Services:
Stake CRO or other assets for up to double-digit yields.
🤝 Strategic Partnerships
Crypto.com has been aggressively investing in brand and adoption:
🏟 Official partner of UFC, FIFA World Cup, and Formula 1
🏀 NBA’s Los Angeles Lakers Arena naming rights (Crypto.com Arena)
💼 Member of Singapore's regulated exchanges
🔐 ISO/IEC 27701:2019, PCI:DSS 3.2.1, and SOC 2 compliance — one of the most secure platforms in the industry
🧠 Conclusion: The Perfect Blend of TA + FA
With CRO being included in a potential U.S.-regulated ETF, the Crypto.com ecosystem booming, and technical patterns pointing to a Fib-based target above $3, CRO might be the sleeper play of the next bull run.
"The move nobody anticipates" might just be the most explosive one.
🎯 Short-Term Targets:
$0.25
$0.37
$0.57
🎯 Mid-Term Bull Targets:
$0.90 (prior ATH)
$1.42
$2.28
🎯 Full Cycle Extension:
$3.13
📢 Let me know in the comments:
Are you holding GETTEX:CRO ? What do you think about its inclusion in the ETF?
#CRO #CryptoCom #ETF #TrumpMedia #Altcoins #Bullrun #CryptoTrading #DeFi #FibTargets #CronosChain
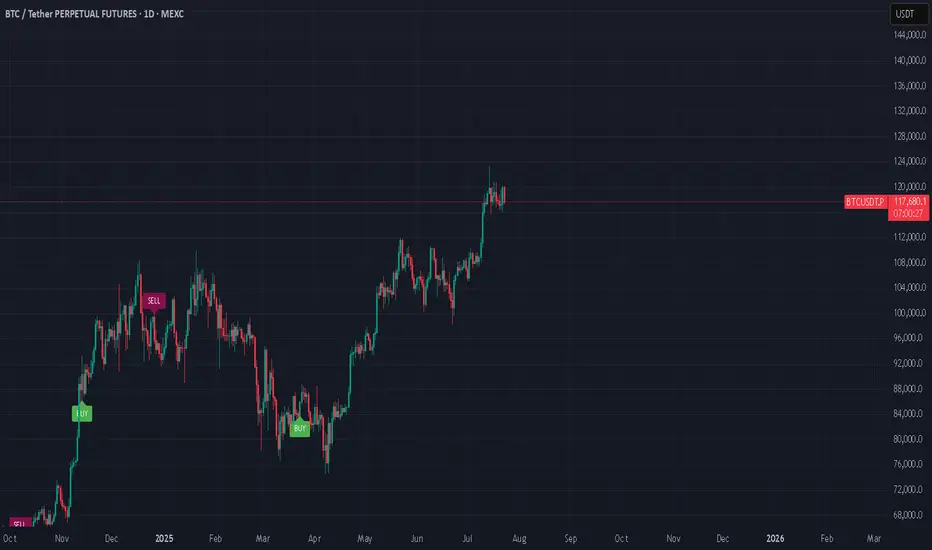
Bitcoin - Will Bitcoin reach its previous ATH?!Bitcoin is above the EMA50 and EMA200 on the four-hour timeframe and is in its ascending channel. Bitcoin’s current upward momentum has the potential to reach its previous ATH. If it corrects, we can look for Bitcoin buying positions from the specified support area, which is also at the intersection of the bottom of the ascending channel.
If this support is lost, the decline will continue to around $113,000, where we can again buy Bitcoin with a better risk-reward ratio.
It should be noted that there is a possibility of heavy fluctuations and shadows due to the movement of whales in the market, and capital management in the cryptocurrency market will be more important. If the downward trend continues, we can buy within the demand area.
Last week, the U.S. House of Representatives passed the CLARITY Act (Crypto-Asset National Regulatory Transparency for Investors and Consumers Act) with 294 votes in favor and 134 against, including support from 78 Democrats. The bill represents the first comprehensive legislative effort to regulate the cryptocurrency industry and is considered a major regulatory win for digital asset proponents.
Key features of the legislation include:
• Clearly defining the regulatory roles of agencies like the SEC and CFTC
• Establishing a new category for registered digital assets
• Facilitating broader integration of cryptocurrencies into traditional financial systems
Status in the Senate: Despite bipartisan approval in the House, the bill’s future in the Senate remains uncertain. Senators are still in the early stages of drafting their own version, and significant revisions are expected. Some Senate Democrats insist that the bill must explicitly address President Trump’s and his family’s cryptocurrency holdings.
The CLARITY Act is part of a broader Republican-led legislative initiative dubbed “Crypto Week,” which includes two additional major digital asset bills aimed at modernizing blockchain regulation and the broader digital finance ecosystem.
Meanwhile, Donald Trump is preparing to issue an executive order that would open up U.S. retirement markets to cryptocurrencies, gold, and private equity. This order would allow 401(k) fund managers to incorporate alternative assets into retirement portfolios.
The move follows the rollback of Biden-era restrictions and the recent passage of three crypto-related bills in the House. While major investment firms have welcomed the proposal, critics warn that alternative assets may expose retail investors to greater financial risks.
Also last week, Bitcoin reached a new all-time high, pushing its market capitalization to $2.43 trillion. It has now surpassed Amazon, Google, and even silver, becoming the fifth-largest asset globally by market value.
Looking ahead, one of the key events on the economic calendar is Federal Reserve Chair Jerome Powell’s upcoming speech at an official central bank-hosted conference on Tuesday. This event comes just before the release of the preliminary S&P Global Purchasing Managers’ Indexes (PMIs) on Thursday. Given Trump’s escalating verbal attacks on Powell, a central question is whether this political pressure has influenced the Fed Chair’s stance.
Trump has repeatedly urged Powell to lower interest rates. This week, reports emerged suggesting that the President had discussed with some Republicans the possibility of removing Powell from his position. However, Trump was quick to downplay the reports, stating that the likelihood of Powell being dismissed was “very low.”
In this context, if Powell uses his speech to reassert the Fed’s independence and calls for patience to assess the impact of tariffs more thoroughly, the U.S. dollar may continue its recent upward trend. Still, it’s too early to confirm a definitive bullish reversal for the dollar. While the global reserve currency has responded positively to headlines fueling tariff concerns, markets could mirror April’s behavior—when fears of recession led investors to sell the dollar instead of buying it—should those concerns intensify again.

OFFICIAL TRUMP Last Barrier · $30 or $100 Next · MixedThe last barrier is on now. The last barrier as in the last and final resistance level TRUMPUSDT (OFFICIAL TRUMP) needs to conquer before a major rise. Will this rise reach $30 or $100 or higher? Continue reading below.
Make sure to boost this publication and follow to show your support.
Hah! Resistance is confirmed as EMA89, what a drag. This is the blue dotted line on the chart but notice something else. Look at the magenta line, EMA55. TRUMPUSDT is trading above EMA55 but below EMA89. Bullish and bearish. Bearish and bullish. Mixed?
There is nothing mixed.
The main low happened 7-April. A higher low in 22-June. Can you see?
This is not mixed, this is bullish confirmed.
If the market were to move lower, then in 22-June we would have either a test of the 7-April low or a lower low. The fact that the drop stopped higher means that buyers were present. People were actually expecting for prices to drop and once they dropped they bought everything that was being sold. Prices couldn't move any lower because people were buying up. These are smart trader, smart money; experience for sure.
They managed to buy some tokens at a lower price within the "opportunity buy zone." This zone is available no more and now we have the mix of resistance and support; EMA89 and EMA55. What happens next?
Based on the previous signal I just showed you and marketwide action, Bitcoin super strong, we know that TRUMPUSDT will follow and break-up. Yes! Massive growth.
Both targets are good and will hit. Short-term, we will see a challenge of $30 and long-term we will see $100 and beyond.
Thanks a lot for your continued support.
Namaste.

TRUMP IS PUMPING!!!Hello friends🙌
📈Given that the price has reached its bottom and buyers support it, you can buy at 3 specified points with capital and risk management and move with it to the specified targets.
🔥Follow us for more signals🔥
*Trade safely with us*

TRUMP UPDATEHello friends🙌
👀You can see that the price formed a reversal pattern after falling at the specified support and the buyers supported it.
⚠Considering the entry of buyers, the price is expected to move to the specified targets, of course, don't forget about capital and risk management.
🔥Follow us for more signals🔥
*Trade safely with us*

Earnings Heat Up - 6300 and 6200 SPX Key Levels RemainMarket Update
SPX Key Levels
-SPX poked 6300 Tuesday, Thursday, and poked higher Friday (but settled back to 6300)
-6200 support remains a key level
-6050/6000/5800 next floor levels, I'll be looking for dips
I can see the market slowly (and I mean SLOWLY) grinding higher but preparing for a
reasonable seasonal selloff through end of July into end of September window
July 28-August 1 is a monster week in the markets
-Megacap Earnings (MAG7 Tue/Wed/Thu)
-Wed July 30 - FOMC (Pause expected but Powell's Press Conference is important)
-Friday August 1 - Non-Farm Payroll, Tariff Deadline
I'm hitting fresh YTD highs so I'm not complaining about this melt-up and grind, I'm simply wanting to allocate positions and add to my positions at better levels and with a slightly
higher VIX to help take advantage of the expected move being greater than the actual move
Have a great weekend and thank you watching!!!
