ECB decision shadowed by tariff risk Markets will be closely watching the European Central Bank’s (ECB) interest rate decision on April 17, with expectations for a seventh consecutive rate cut.
Despite this expectation, the euro surged to a three-year high against the US dollar last week, as traders continued to pull away from US assets.
The dollar index has dropped 4% since President Trump’s “Liberation Day” tariff announcements on April 2, falling below the key 100 level too.
At this stage, market participants will be looking for any signals on how the ECB might respond to the potential spillover effects of President Trump’s tariff measures. While some guidance may emerge around already-announced policies, the risk of further unpredictability remains high.
Trump being Trump, it is perhaps unlikely we have seen the last of his volatility-inducing tariff announcements. This can weigh further on the dollar, eroding confidence in the world’s reserve currency.
Trump

XRP/USDT:BUY LIMITHello friends
Due to the price drop, we have reached a good support area, which you can see is supported by good buyers.
Now we can buy in stages and with capital management in the specified areas and move to the specified targets.
Always buy in fear and sell in greed.
*Trade safely with us*

PEPE/USDT:BUY!!!Hello friends
Due to the heavy price drop we had, the market has fallen into fear and the price has been well supported in the specified support area, according to which we can buy in steps in the specified areas with capital and risk management and move to the specified goals.
Always buy in fear and sell in greed.
*Trade safely with us*

GoldXau usd daily analysis
Time frame daily
Risk rewards ratio =3
Target 3.190$
Price fell down to uptrend cross as you can see on the chart and now after we heard good news about Europe and USA economic relations and Middle East war( Iran and USA are on the sides of deal table) gold will reach to my target

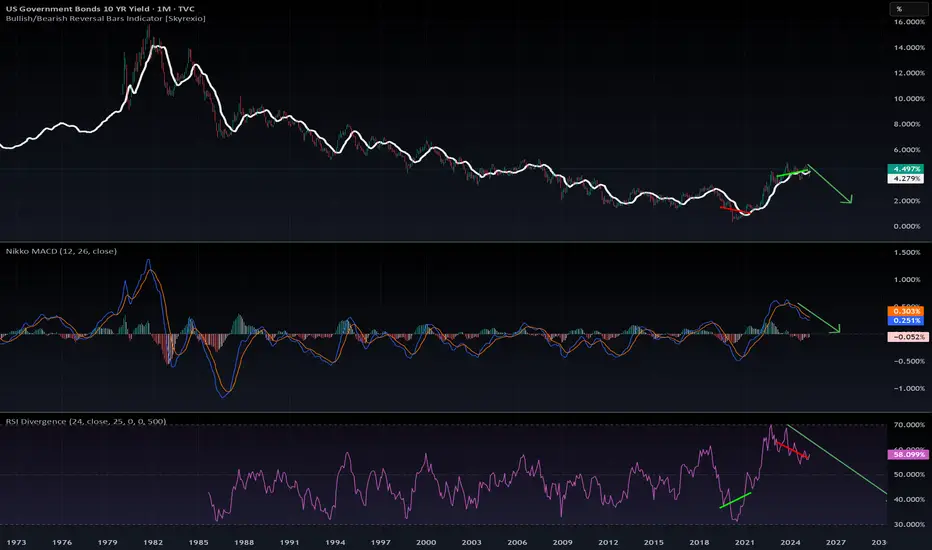
10YR Bond Yields: Panic on LTF, Calm on HTF📉 10YR Bond Yields: Panic on LTF, Calm on HTF
Yes, the recent spike in the 10-Year Yield is causing some short-term panic. But if you zoom out to the monthly timeframe, the bigger picture looks far more constructive.
🔍 Here’s what the chart says:
The MACD and RSI on the monthly are both pointing down.
Yields touched 4.5%, historically a key recession threshold.
We’re now seeing a MACD bearish crossover and a clear bearish divergence—classic signs of a trend reversal.
💡 What does this mean?
If no new fear or shock hits the market, yields are likely headed down, potentially toward the 2% range in the coming months. This would naturally ease pressure on equities and crypto.
📉 Conclusion:
This recent spike in yields seems to be transitional, not structural.
The chart suggests that the top is in, and the market is correcting from an overextended zone.
The Fed might not even need to intervene—the bond market is likely to correct on its own.
Stay calm. Stay rational. Always zoom out.
#10YearYield #BondMarket #MacroAnalysis #InterestRates #RecessionWatch #MarketPanic #MACD #TechnicalAnalysis #FederalReserve #CryptoMarkets #StockMarketInsights #StayCalmZoomOut #DYOR
Another market manipulation. It is spiraling out of control!I’m not here to express political opinions, but let’s be real—the Trump family launching meme coins, rugging retail investors, and manipulating markets is spiraling out of control.
💥 $TRUMP and $MELANIA were just the beginning.
Today, we witnessed what could be the biggest market manipulation in history, and it was executed with textbook precision:
Step one: float a fake news headline to test the market reaction.
Step two: publish a deliberately confusing statement where Trump says everything and its opposite.
Many misunderstood it as a “90-day tariff pause.”
🕛 The timing?
The announcement dropped at 12:30 PM EST—midnight in Asia, and 7 PM in Europe, when banks and institutions were closed.
🎯 Only the U.S. was awake and able to buy the pump.
Everyone else? Left sidelined.
No politician in modern history has manipulated global markets to this extent.
It’s turning Wall Street into a Las Vegas casino for the elite.
To make matters worse, Trump even tweeted a sarcastic:
“It’s a great day to buy stocks.”
🧨 Reality check:
He lowered current tariffs by just 10%
Hit China with a massive 125% tariff
Recession risk? Still on the table
Economic uncertainty? Worse than ever
You think China will just let this slide? Retaliation is coming.
What we're seeing is a nation burning its credibility while recklessly using financial power to create chaos.
🚨 If you think your money is safe in markets run by these people, think again.
This isn't trading anymore—it's Russian Roulette. Markets needs stability.
DYOR

SEI — Breakout + Strong Fundamentals = Perfect 1:9 SetupFinally broke the downtrend line — and it's not just about the technicals here. Fundamentals on SEI are looking really solid, and that adds even more confidence to the setup.
Planning to load on a small pullback and retest of the trendline — that’s where the real entry lies.
This one’s shaping up to be a textbook 1:9 RR play. Don’t sleep on it.
Enrty: 0.17-0.178
TP: 0.4
SL: 0.15
More thoughts in my profile @93balaclava
Personally I trade on a platform that offers low fees and strong execution. DM me if you're curious.

TradeCityPro | VETUSDT Keep an Eye on the Charts!👋 Welcome to TradeCityPro Channel!
Let’s dive into the days when the world is buzzing with interesting events—countries are forming alliances, and news of Trump’s tariffs to negotiations is everywhere. You need to keep a sharp eye on the financial markets and your assets!
🌐 Overview Bitcoin
Before starting the analysis, I want to remind you again that we moved the Bitcoin analysis section from the analysis section to a separate analysis at your request, so that we can discuss the status of Bitcoin in more detail every day and analyze its charts and dominances together.
This is the general analysis of Bitcoin dominance, which we promised you in the analysis to analyze separately and analyze it for you in longer time frames.
📊 Weekly Timeframe
After the bullish move from the 0.01963 support, we got rejected at 0.08271, essentially wiping out the entire move and fully retracing our steps.
We’ve now returned to the 0.01963 support, where we’re forming a solid green indecision candle, backed by noticeable buying pressure. This level has shown a strong reaction, acting as a reliable support.
This could serve as a decent buy trigger with low risk, offering a good entry point. Personally, though, I’m holding off on buying until we see stronger momentum in the chart and market, and until Bitcoin dominance experiences a deeper pullback.
📉 Daily Timeframe
In the daily timeframe, VET is among the coins that have faced a brutal sell-off! From its last peak, it’s dropped roughly 77%, and those without proper risk management have likely been wiped out.
After forming a support box between 0.04224 and 0.05298, we saw a fakeout above the box, signaling further downside. The last time we held support at 0.04224, we couldn’t reach the box’s ceiling, leading to a sharp drop. But after hitting 0.01942, the price has calmed down a bit.
For buying in spot or even futures positions, we’d need a break of the trendline and its trigger at 0.02352 to confirm entry, given the trendline’s retracement nature. If we get rejected from this trendline, a short position in a lower timeframe could make sense. Should 0.01942 break, the downtrend will likely continue. For spot entry confirmation, a surge in volume and a break above 48.68 RSI would be a strong signal.
✍️ Final Thoughts
Stay level-headed, trade with precision, and let’s capitalize on the market’s top opportunities!
This is our analysis, not financial advice always do your own research.
What do you think? Share your ideas below and pass this along to friends! ❤️

Bitcoin Nears $85K as Strategic Talks Grow. Where To Next?Bitcoin, the king crypto, is currently trading at $84,848.36. It has gained 3.10% in the last 24 hours, with a daily trading volume of $30.09 billion. Bitcoin’s market capitalization now stands at $1.68 trillion.
Globally, Bitcoin continues to gain attention at the policy level. In the U.S., there are growing discussions about recognizing Bitcoin as a national strategic asset. A U.S. Senator recently suggested the country acquire 1 million BTC, reinforcing the idea. Florida has introduced legislation allowing public funds to invest in Bitcoin.
North Carolina is considering recognizing Bitcoin as a legal payment method. Arizona’s Senate is evaluating the creation of a home-based Bitcoin activity policy and the possibility of a state reserve. Meanwhile, New Hampshire passed a bill allowing up to 10% of its state funds to be invested in Bitcoin. In Europe, Sweden is assessing the idea of adding Bitcoin to its national reserves for financial stability.
Technical Analysis
From a technical view, Bitcoin has been in a bearish phase since reaching its all-time high of $109,358 on January 19. Since then, the price has been forming an internal structure of lower highs and lower lows, a clear sign of a downtrend. It dropped to a low of $74K after Trump-era tariffs hit the market but has since rebounded to current levels.
The recent lower high stands at $88,996. The trend remains bearish until that level is broken with a strong candle close above it. If Bitcoin breaks and closes above this point, analysis show a potential move toward new highs. Without that breakout, bearish pressure may resume, possibly pushing the price back down to test support near $73K.

Gold ETF(GLD) - Gold is the Safe Haven?Is Gold the safe haven from all the market turmoil? Looking at the chart, it would appear that Gold is unfazed by current market conditions. Price is still making All-Time Highs as price continues to swing above the 25(green), 100,(yellow) and 200(blue) day EMAs. Further fears in the Bond market may increase interest in Gold as a stable asset. What are you thoughts? What are some other assets that are defying 'gravity'?

WTI - Will Iran return to the group of oil producers?!WTI oil is below the EMA200 and EMA50 on the 4-hour timeframe and is moving in its medium-term descending channel. If the correction towards the supply zone continues, the next oil selling opportunity with a suitable reward for risk will be provided for us. In this direction, with confirmation, we can look for oil buying transactions.
The U.S. Energy Information Administration (EIA), in its latest report, has downgraded its forecasts for oil and natural gas production, consumption, and prices for 2025 and 2026, while warning about the uncertain outlook of the energy market amidst economic volatility and escalating trade tensions.
According to the updated estimates, U.S. crude oil production in 2025 is expected to reach 13.51 million barrels per day, down from the previous forecast of 13.61 million barrels. For 2026, the figure has been revised to 13.56 million barrels per day, a reduction from the earlier 13.76 million forecast. Monthly data shows average U.S. oil output stood at 13.44 million barrels per day in April and 13.55 million in March, with similar levels expected in May.
Globally, EIA projects oil production in 2025 to be around 104.1 million barrels per day, slightly down from the earlier estimate of 104.2 million. For 2026, the revised figure stands at 105.3 million barrels per day compared to the previous 105.8 million.
On the demand side, global oil consumption forecasts have also been reduced. In 2025, demand is now estimated at 103.6 million barrels per day instead of 104.1 million, and for 2026 it is projected at 104.7 million barrels per day, down from the prior estimate of 105.3 million.
Regarding natural gas, the EIA reports that average U.S. gas production in April will be around 115 billion cubic feet per day, slightly lower than the 115.3 billion cubic feet reported in March. May’s forecast stands at 115.4 billion cubic feet. Demand has also dipped, with estimates for 2025 now at 91.2 billion cubic feet per day (down from 92), and for 2026 at 90.5 billion (previously 91.1).
In terms of pricing, EIA has made significant downward revisions. The average price of West Texas Intermediate (WTI) crude oil is now forecast to be $63.88 per barrel in 2025, compared to the earlier $70.68. For 2026, this drops further to $57.48. Brent crude is now estimated at $67.87 for 2025 and $61.48 for 2026, both notably lower than prior projections.
One key highlight from the report is EIA’s warning about high volatility in major commodity prices, especially crude oil. The agency underlined that reciprocal tariffs between China and the U.S. could heavily impact markets, particularly the propane sector.
EIA noted that U.S. liquefied natural gas (LNG) exports are likely to remain resilient despite trade disputes. This is attributed to strong global demand and the flexible nature of U.S. export contracts, which allow unrestricted shipments to multiple destinations.
However, when it comes to oil and petroleum products, the agency maintained a more cautious tone, emphasizing that recent shifts in global trade policies and oil production patterns may slow the growth of demand for petroleum-based products through 2026.
Altogether, the downward revisions by the EIA carry a clear message: the energy market outlook over the coming years is fraught with uncertainty. From supply and demand to pricing, political and economic forces such as trade wars and potential global recessions are expected to play decisive roles.
Meanwhile, according to Reuters, after U.S. President Donald Trump once again threatened military action if Tehran refuses to agree to a nuclear deal, a senior Iranian official responded by warning that Iran may halt its cooperation with the U.N.’s nuclear watchdog.
Reports indicate that American and Iranian diplomats will meet in Oman on Saturday to begin talks on Tehran’s nuclear program. Trump stated that he would have the final say on whether the negotiations are failing, which could place Iran in a highly dangerous position.
Ali Shamkhani, a senior adviser to Iran’s Supreme Leader, posted on X (formerly Twitter) that ongoing foreign threats and the looming threat of military confrontation could lead to deterrent actions such as expelling International Atomic Energy Agency (IAEA) inspectors and cutting ties with the agency.He also mentioned that relocating enriched uranium to secure, undisclosed locations within Iran may be under consideration

Revolving Credit Recession?YES! We are!
Revolving credit does not roll over like this unless people are scared! The question is are we already in a recession? We won't know until after the fact. But my guess would be YES!
My question is will we end up in a depression or not?
Click Boost, Follow, Subscribe, and let me help you navigate these crazy markets.

Trump Manipulates the Market Again: Tariffs ON/OFF PlayOnce again, we’re watching how political narratives are used to shake the markets — and Bitcoin was no exception this time.
🔻 Step 1: "TARIFFS ON" Announcement
Market instantly reacts with a sharp sell-off
BTC drops from 81K to nearly 75K
Fear spikes, media goes wild
📉 That’s your classic short squeeze setup.
🔺 Step 2: "TARIFFS OFF" Retraction
Massive green candle, BTC rebounds from lows
Shorts get liquidated
Price rips back up in minutes
💸 It’s a textbook fake panic followed by a well-timed reversal. Someone knew what was coming. Someone profited. And it wasn’t retail.
🔎 What does this mean? This is not just market volatility — this is narrative-based manipulation. If you're trading without paying attention to headlines, you're already behind.
🧵Follow the money. Follow the timing. Follow the candles. #Bitcoin #BTCUSD #MarketManipulation #Tariffs #Trump #PoliticsInMarkets #Whales #NarrativeTrading #PriceAction

SPY Analysis & Tariff TurmoilLast Friday, the market pressure was intense, and my bullish call option, targeting $537.64 on SPY, seemed overly ambitious as tariffs and political uncertainties peaked. I stated, " AMEX:SPY Trump went all in thinking he had the cards. We were getting sent back to the McKinley era," wondering when or if Trump would fold under international pressure and market realities.
Fast-forward to Wednesday, April 8—Trump didn't just blink; he folded utterly, reversing the harsh tariff policies he initially defended aggressively. Prompted by China's aggressively dumping of U.S. Treasuries and stark recession warnings from Goldman Sachs, BlackRock, and JPMorgan, Trump pivoted significantly:
• Base tariffs: 10%
• Tariffs on China: Increased to 125%
• Tariffs on U.S. goods entering China: Increased to 84% starting April 10
While temporarily bullish, these sudden, dramatic policy swings underline ongoing instability and volatility. However, with big bank earnings on deck this Friday, short-term momentum looks positive.
Technical Levels & Trade Ideas
Hourly Chart
The hourly chart reveals a critical zone—dubbed "Liberation Day Trapped Longs"—between $544.37 (H. Vol Sell Target 1b) and $560.54 (L. Vol ST 2b). Bulls trapped here from recent highs may now look to exit on a relief rally.
• Bullish Scenario:
• Entry: SPY reclaiming and holding above $544.37.
• Target 1: $560.54 (top of trapped longs)
• Target 2: $566.54 (next resistance area)
• Stop Loss: Below recent lows near $535 to limit downside.
• Bearish Scenario (if tariffs intensify again or earnings disappoint):
• Entry: Breakdown confirmation below $535.
• Target 1: $522.20 (Weeks Low Long)
• Target 2: $510.00, potential further support
• Stop Loss: Above $544.50 to manage risk effectively.
Daily Chart Perspective
The broader daily chart shows SPY stabilizing around key lower supports after significant volatility. Recent price action suggests cautious optimism for an upward bounce, but considerable headwinds remain if tariff escalations resume.
Final Thoughts
The rapid tariff reversals and heightened volatility are unsettling. The short-term bullish move offers potential quick upside trades into earnings, but caution remains paramount. You can continue managing risks prudently and watch closely for political or economic headlines that could quickly shift market sentiment again.

$BTC consequences of the Trump 90 days tariff pauseCan It Last? Is This a Trend Reversal?
Today, #Bitcoin surged over +8%, but surprisingly, #Tesla outperformed with a massive +20%—almost as much as $FARTCOIN! 🤯
History is being written, and we’ll remember this day… but is this truly the end of the consolidation phase?
What to Watch:
📈 Price Action: Bitcoin must break above the descending trendline (in green) and close a daily candle above it to flip resistance into support. The price to watch is $84.5k. Closing under 80k would invalidate this pump.
📊 RSI: Currently in mid-range—could swing either way.
🔁 MACD: Was turning bearish. We need a clear bullish crossover to confirm a trend continuation.
Conclusion:
With all the recent global tensions, many investors are feeling a sense of relief, especially as the trade war appears paused until September. This gives markets some breathing room to recover.
However, it’s not all clear skies yet:
Bitcoin is still stuck inside the descending bearish channel.
The recession risk hasn't gone away.
Trump may have been pressured to offer good news to avoid a full-blown market crash.
🕵️♂️ Let’s see how the weekly candle closes after this sharp move to the upside.

HOW IS CRYPTO SHAPING UP?Trump and tariffs have a firm grip on the economic world as of late, so where does that leave the crypto market?
TOTAL has a clear structure since the beginning of the bull market in 2023, in the last 3 days TOTAL has wicked into the bullish trendline support but sits within a bearish trend channel. This level also coincides with the bullish orderblock that started the leg up post US election so a very strong level of support here.
Do I think this is the end and the bottom is in? The chart would make a very good case for it however I believe that the Geo-politics outweigh Technical Analysis currently, at least in the short term. Everyone is watching for the latest news release/Trump announcement and all the time that is going on the market is very reactionary with less passive orders and more reactionary news based market orders. That taken into account in the short term this is a game of musical chairs with massive volatility swings and liquidations left right and center, a traders dream.
I'm very interested in how the FED will react to this, once we start getting emergency or early interest rate cuts that for me is when BTC will take the next step up and will flip to an investor/buy and hold environment, whether that's from here, lower or higher I'm not sure but but BTC needs a risk-on environment to thrive and Trump is doing his best to force J Powells hand.

HAPPENING NOW?! HERTZ CUP AND HANDLE BREAKOUT 1D CHART?HERTZ (HTZ) Price rose significantly to $4.26 on the 1 Day chart. Is this a sign of an impending bullish breakout? My personal target opinion for bullish movement is $5.50. Will this be a major bullish turning point for Hertz? Or will it be a easy grab for traders running short positions?

Bitcoin Eyes $81,500 Resistance Following Trump's Tariff Pause. 🚨 **Market Update** 🚨
President Donald Trump has announced a 90-day pause on the full effect of new tariffs for certain countries, and the markets are reacting strongly! 📈 Both the stock and crypto markets are surging as a result.
Right now, **Bitcoin** is testing the $81,500 resistance level on the 1-hour timeframe. 💥 Our trading strategy: let it break the resistance and sustain above it, then look for a solid entry on the pullback.
Stay tuned and trade wisely! 🚀💰

Ethereum Surges Past Resistance as Trump Halts Tariff Plans..!🚨 **Market Update** 🚨
President Donald Trump has announced a 90-day pause on the full effect of new tariffs for certain countries, and the markets are reacting strongly! 📈 Both the stock and crypto markets are surging as a result.
Right now, Ethereum is testing the $1600 resistance level on the 1-hour timeframe. 💥 Our trading strategy is to let it break the resistance and sustain above it, then look for a solid entry on the pullback.
Stay tuned and trade wisely! 🚀💰

Trump's Tariff Wars : Why It Is Critical To Address Global TradeThis video, a continuation of the Trump's Tariff Wars video I created last week, tries to show you why it is critically important that we, as a nation, address the gross imbalances related to US trade to global markets that are resulting in a $1.5-$1.8 TRILLION deficit every fiscal year.
There has been almost NOTHING done about this since Trump's last term as President.
Our politicians are happy to spend - spend - spend - but none of them are worries about the long-term fiscal health of the US. (Well, some of them are worried about it - but the others seem to be completely ignorant of the risks related to the US).
Trump is raising this issue very early into his second term as president to protect ALL AMERICANS. He is trying to bring the issue into the news to highlight the imbalances related to US trade throughout the world.
When some other nation is taking $300B a year from the us with an unfair tariff rate - guess what, we need to make that known to the American consumer because we are the ones that continue to pay that nation the EXTRA every year.
Do you want to keep paying these other nations a grossly inefficient amount for cheap trinkets, or do you want our politicians and leaders to take steps to balance the trade deficits more efficiently so we don't pass on incredible debt levels to our children and grandchildren?
So many people simply don't understand what is at risk.
Short-term - the pain may seem excessive, but it may only last 30, 60, 90 days.
Long-term - if we don't address this issue and resolve it by negotiating better trade rates, this issue will destroy the strength of the US economy, US Dollar, and your children's future.
Simply put, we can't keep going into debt without a plan to attempt to grow our GDP.
The solution to this imbalance is to grow our economy and to raise taxes on the uber-wealthy.
We have to grow our revenues and rebalance our global trade in an effort to support the growth of the US economy.
And, our politicians (till now) have been more than happy to ignore this issue and hide it from the American people. They simply didn't care to discuss it or deal with it.
Trump brought this to the table because it is important.
I hope you now see HOW important it really is.
Get some.
#trading #research #investing #tradingalgos #tradingsignals #cycles #fibonacci #elliotwave #modelingsystems #stocks #bitcoin #btcusd #cryptos #spy #gold #nq #investing #trading #spytrading #spymarket #tradingmarket #stockmarket #silver

Fool trump BTC@Watch and follow the processBitcoin in the 15-minute time frame seems to have a tendency to rise in the short term
And we are in a range of fluctuation

Thanks to STUPID TRUMP the downward trend continuesDo you agree with me that Trump is a narcissistic and crazy man who has decided to destroy the world economy, or is he discrediting powerful people and just lying

Trumpenomics - Market Volitility - How low will it go?What we know:
When Trump entered office he said the stock market was too high and he was not investing in the markets.
The Tariffs have caused volatility and a decline in the markets.
Market drops in the past have been between 30% and 60%.
How far do you think the market will drop this time?
