TRUMPHello friends
Due to the price drop, we reached a good support area where good buyers supported the price.
Now we can buy in steps and with capital management in the specified support areas and move to the specified targets.
Always buy in fear and sell in greed.
*Trade safely with us*
Trump

TRUMP EFFECT BTC is being prepared for correctionBITCOIN IS READY FOR CORRECTION OR CONTINUES ITS DOWNWARD TREND
fool trump
trump decide to destroy world economy

The Trump PatternWhen Donald Trump took office in 2017, the U.S. stock market experienced dramatic fluctuations—marked by steep declines followed by eventual rebounds.
This pattern, which we'll call the "Trump Pattern," repeated itself during his presidency and is now emerging again as a point of interest for investors.
While the specific causes of these market shifts varied, key factors—particularly tariffs, inflation concerns, and Federal Reserve (FED) actions—played critical roles in the market's rise and fall during Trump’s presidency.
The Trump Pattern: The Market Fall and Recovery
🏁 1. The Start of the Trump Presidency (2017)
When Donald Trump was elected in 2016, the market responded with a combination of excitement and uncertainty. Initially, the market surged due to tax cut expectations, deregulation, and optimism about a business-friendly administration. But as Trump's presidency fully began in January 2017, concerns over trade wars and tariff policies began to dominate investor sentiment.
The market initially dipped after Trump began pursuing a protectionist trade agenda, especially with China.
As concerns about tariffs escalated, stock markets reacted negatively to potential trade wars.
💶 2. The Tariff Crisis of 2018
The first major example of the "Trump Pattern" emerged in 2018 when Trump began implementing tariffs, particularly on Chinese imports, and announced new tariffs on steel and aluminum. This caused major market disruptions.
The S&P 500 fell dramatically during this period, dropping by as much as 8.6% from its February peak in 2019.
Companies that relied heavily on international trade, like Apple, General Motors, and Ford, experienced significant stock price declines. In fact, Apple’s stock fell 9.5% on days when new tariffs were announced, as their costs for manufacturing overseas rose.
The uncertainty surrounding the global economy, combined with rising tariffs, created fears of a trade war, leading to sharp market declines.
📈 3. Market Recovery: FED Rate Cuts and Tax Cuts
Despite the tariff-induced volatility, the market didn’t stay down for long. After significant market falls, the Federal Reserve (FED) began implementing interest rate cuts to combat slowing economic growth. These actions helped stabilize the market and even fueled a rebound.
FED rate cuts made borrowing cheaper for consumers and businesses, stimulating economic activity and boosting investor confidence.
Additionally, tax cuts, a cornerstone of Trump’s economic policy, provided further support, particularly for corporations.
As a result, after the initial market drop in 2018 and early 2019, the market rebounded, continuing to climb as investors reacted positively to these fiscal and monetary policies.
🎯 The 2024 and 2025 "Trump Pattern" Emerges Again
Fast forward to 2024 and 2025, and we’re seeing echoes of the "Trump Pattern" once again. New tariffs, introduced in 2025, have reignited concerns about a trade war. These tariffs, particularly on Chinese imports, have once again caused market volatility.
The stock market has fallen in recent months due to concerns about these tariffs and the impact they might have on global trade. For example, when new tariffs were introduced in early 2025, the market saw a sharp sell-off, with the S&P 500 falling by over 1.8% in a single day.
Companies that rely on international trade, like Tesla and Ford, have seen their stock prices drop in response to concerns about increased production costs.
The broader market decline, much like in 2018, was driven by fears that tariffs could slow down the global economy and hurt corporate profits.
However, there is optimism that the same pattern will unfold, where the market eventually recovers after these initial drops.
⚠️ 4. FED Rate Cuts Again?
As inflation concerns persist, the Federal Reserve is likely to step in once again. Like previous cycles, we expect the FED to cut interest rates to stimulate the economy. This would be aimed at reducing borrowing costs, encouraging investment, and helping businesses weather the impact of higher tariffs and global uncertainty.
The FED’s actions are typically a key driver of market recovery in the "Trump Pattern." Investors have come to expect that a market downturn triggered by political or economic disruptions can be offset by the FED’s supportive monetary policies.
⚖️ Navigating the Trump Pattern: What Should Investors Do?
The "Trump Pattern" highlights that during periods of heightened uncertainty, especially due to trade policies like tariffs, the market will often experience short-term declines followed by long-term recovery. Here are a few strategies investors might want to consider:
Stay Diversified : During periods of volatility, having a diversified portfolio can help cushion against the risks posed by market swings.
Invest in Domestic Companies : Companies that rely less on international supply chains might fare better during periods of trade policy changes and tariff uncertainty.
Focus on Growth : Once the initial market decline subsides, look for sectors that stand to benefit from a recovering economy, such as tech or consumer discretionary stocks.
Look for Inflation Hedges : Given the potential for inflation, consider investments that tend to perform well during these times, such as real estate or commodities like gold.
📝 Conclusion: The Trump Pattern in Action
The "Trump Pattern" demonstrates how the market tends to react in cycles during the early months of each presidency. Typically, the market falls at the start due to the uncertainty surrounding Trump’s trade policies, particularly tariffs. However, after these initial drops, the market often rebounds thanks to FED rate cuts and other policies aimed at stimulating the economy.
Looking ahead to 2025, we're already seeing signs of this pattern in action as tariffs are back on the table and market volatility has followed. However, history suggests that patience might pay off. Once the FED steps in and cuts rates, a market rebound is likely, following the same trend we saw in 2017-2019.

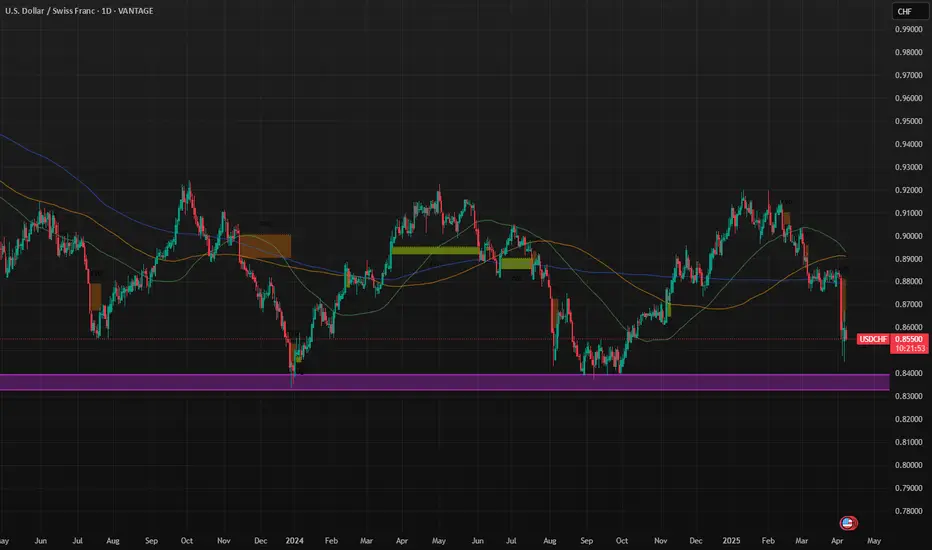
USDCHF PoV - Long POINT 0.82$!Currently, the USD/CHF pair is going through a bearish phase, influenced by several economic and geopolitical factors.
Influence of US Trade Tariffs: Recent trade tariffs imposed by the United States have strengthened the Swiss franc, creating pressure on Switzerland's export-oriented economy. This scenario could push the Swiss National Bank (SNB) to consider introducing negative interest rates to counter the appreciation of the currency and support the economy.
Monetary Policy of the SNB: In June 2024, the SNB reduced interest rates by 25 basis points, bringing them to 1.25%. Inflation forecasts were revised downward, indicating 1.3% for 2024 and 1.1% for 2025. These adjustments reflect economic challenges and the SNB's intent to avoid deflation.
Swiss Franc Forecast: Analysts from Bank of America have expressed doubts about the sustainability of the Swiss franc's weakness in 2025. Despite expectations of lower interest rates, the SNB may be reluctant to implement unconventional measures, given the limited effectiveness of such policies in the past.
Technical Analysis: The daily chart shows a range between a maximum of 0.82 and a minimum of 0.92, which has been respected for the past three years. Currently, the price is approaching the upper limit of the channel, suggesting a possible downward correction. However, a break above 0.92 could indicate an extension of the bullish movement.
Conclusion: The bearish trend of USD/CHF is influenced by both internal and external factors, including SNB policies, US trade tariffs, and market dynamics. Investors should closely monitor SNB decisions, international trade policies, and key economic indicators to assess potential developments in the USD/CHF exchange rate.
GOLD H2 Outlook: Correction in progress 2900 USD in sight🏆 Gold Market Update (April 8th, 2025)
📊 Technical Outlook Update
▪️5 wave impulse completed
▪️Correction as expected previously
▪️currently trading at 3 000 usd
▪️Profit taking in progress now
▪️Price Target BEARS 2850/2900 USD
▪️Strategy: SHORT SELL rips/rallies
▪️target is 2900 USD
📢 Gold Market Update – April 2025
📈 Gold hits all-time high above $3,100/oz
🚀 Surge driven by Trump’s new global tariffs and rising trade war fears
🌍 Investors seek safety amid geopolitical uncertainty
📉 Pullback follows rally
💸 Sharp drop due to profit-taking and risk sentiment rebound
🔁 Analysts remain bullish as Fed rate cuts and tensions linger
🏦 Central banks keep buying
🛡️ China & others increasing gold reserves to hedge inflation & currency risks

VIX Clips 60 as Market Volatility and Tariff UncertaintyThe VIX Clips 60 as Market Volatility and Uncertainty Surge on Tariff Announcement
The CBOE Volatility Index (VIX), often dubbed the “fear gauge,” surged past the 60 threshold this week—the highest level since August 5, 2023—as markets reacted violently to an unexpected announcement by the U.S. President regarding global tariffs. The sharp rise in the VIX, which measures market expectations of 30-day volatility, underscores the profound uncertainty now gripping investors, with the Dow Jones Industrial Average plummeting over 1,000 points and the S&P 500 entering correction territory. The trigger? A sweeping tariff policy unveiled by the administration on Liberation Day, a symbolic holiday marking a shift in economic strategy, which has sent shockwaves through global markets.
The VIX at 60: A Sign of Extreme Fear
The VIX typically hovers around 15-20 under normal conditions, reflecting moderate uncertainty. However, readings above 30 indicate heightened anxiety, and levels above 50 are rare, historically occurring during major crises like the 2008 financial collapse or the 2020 pandemic sell-off. This week’s spike to 60 marks a dramatic escalation, signaling a market gripped by fear. Analysts attribute this to the suddenness and scale of the President’s tariff announcement, which caught investors off guard after a period of relative calm.
The Liberation Day Tariff Announcement
On Liberation Day—a holiday commemorating historical freedoms—the administration announced a 25% tariff on a broad range of imports from key trading partners, including China, the EU, and others, effective immediately. The move, framed as a “national economic security initiative,” aims to curb perceived trade imbalances and protect domestic industries. However, its immediate impact has been severe:
Scope and Speed: The tariffs apply to $500 billion in goods, targeting sectors like semiconductors, automotive parts, and consumer electronics. The abrupt implementation, with no prior warning or negotiation, has left businesses scrambling to adjust supply chains.
Political Context: The announcement coincided with domestic political tensions, including debates over inflation and job creation. The White House argued the tariffs would “level the playing field” for American workers, but critics warned of retaliation and inflationary pressures.
Market Chaos: Sectors Under Siege
The tariff shockwave rippled across asset classes:
Equities: The S&P 500 fell 2+% on Monday, its worst single-day drop since March 2020. The Nasdaq, heavily weighted in tech stocks reliant on global supply chains, plunged over 5%.
Sectors: Semiconductor firms like Intel and AMD tanked, while automakers such as Ford and Tesla declined sharply.
Expert Analysis: A Volatility Tipping Point
Historical Parallels and Economic Risks
The current volatility mirrors past crises:
2008 Financial Crisis: The VIX hit 80 as Lehman Brothers collapsed, but the current crisis stems from policy, not financial contagion.
2020 Pandemic Sell-Off: The VIX spiked to 82 as lockdowns paralyzed economies, but today’s uncertainty is self-inflicted.
However, the tariff-driven uncertainty poses unique risks:
Inflation: Higher import costs could push inflation back above 4%, complicating the Fed’s rate-cut path.
Global Growth: The World Bank warns that trade wars could shave 2% off global GDP by 2025. Emerging markets, reliant on exports, face currency crises.
Looking Ahead: Can Calm Return?
Markets may stabilize if the administration signals flexibility. Potential pathways include:
Negotiations: A G20 summit in September offers a venue for de-escalation, though diplomatic progress is uncertain.
Policy Reversal: If tariffs are delayed or narrowed, the VIX could retreat. However, the President’s rhetoric suggests a hardline stance.
Corporate Adaptation: Companies might pivot to domestic suppliers, but such shifts take years, prolonging volatility.
Conclusion: A New Era of Uncertainty
The VIX at 60 marks a pivotal moment. Markets are now pricing in not just the immediate tariff impact but a broader shift toward protectionism and policy-driven instability. For investors, the path forward is fraught with uncertainty. While short-term volatility may ebb with reassurances, the long-term consequences—trade wars, inflation, and geopolitical friction—could redefine global economics for years.
With Liberation Day’s tariffs reshaping the landscape, one thing is clear: the era of low volatility is over. The question now is whether policymakers can navigate this new turbulence—or if markets will remain hostages to fear.

TLT - Monthly Targets (Long Term)Markets are currently tight squeezing due to Trumps terrifs etc, something has to give in, based on this chart:
- TLT has found a bid at .963 Fibonacci level @ $82.42 (EXTREME RETRACE)
- Dec 2, 2024 = the 369 ratio in time for $82.42 (time & price 📐)
NEXT TARGET PROJECTION IS 50% OF THE MAX TARGET ANGLE = ($121)
(BETWEEN 2025 - 2029)
MAX TARGET = $183 - $212
(BETWEEN 2025 - 2034)

The S&P 500 Has Officially Entered a Bear MarketThe technical definition is simple:
✅ A decline of 20% or more from recent all-time highs.
That’s exactly where we are.
🔻 The S&P 500 has been free-falling and just hit that 20% mark.
🔴 The index is on pace to close the day deep in red — confirming what many feared:
We are in a bear market.
👀 What does this mean?
Expect continued volatility, emotional markets, and high sensitivity to macroeconomic news.
Historically, bear markets can last from a few months to over a year, depending on policy response and investor sentiment.
While painful, bear markets often plant the seeds of the next bull run 🌱 — but that doesn’t mean we’re there yet.
🧠 Time to zoom out, stay informed, and trade with caution. Capital preservation becomes just as important as returns.
What’s your strategy during bear markets? Averaging down? Hedging? Sitting in cash?
#SP500 #BearMarket #StockMarketCrash #TradingStrategy #MarketUpdate #InvestSmart

SP500 In Reverse: Unpacking the latest markets setbackThe SP500 continued its decline on Friday. The downward price action is now very violent and could continue in the coming days as well. No signs of recovery still..

BTC - One More Leg...Hello TradingView Family / Fellow Traders!
This is Richard, also known as theSignalyst.
📉 BTC has been overall bearish , trading within the falling channel marked in red.
But the big question is — where could the potential bottom be?
👉 I’m watching the $70,000 zone!
Here’s why:
The $70,000 area is a key confluence zone — it aligns with the lower red trendline, horizontal support, a psychological round number, and a potential demand zone.
📚 According to my trading style:
As #BTC approaches the blue circle zone, I’ll be looking for bullish reversal setups — such as a double bottom pattern, trendline break, and more.
📚 Reminder:
Always stick to your trading plan — entry, risk management, and trade management are key.
Good luck, and happy trading!
All Strategies Are Good, If Managed Properly!
~Rich

DXY Bearish trend continues on SSL and Bearish ORDER BLOCKDXY is known for extreme liquidity grabs especially after Trump's tariff announcements. Until we see countries remove tariffs and companies changing factory locations DXY will still be week. A decent pullback this week?? Probably not, Next? Maybe STAY SHARP!!

Merck & Co. (NYSE: $MRK) Sets Up Q125 Earnings Call for April 24Merck & Co. (NYSE: NYSE:MRK ) will hold its Q1 2025 earnings call on April 24 at 9:00 a.m. ET. Company executives will present financial results and performance updates during the call.
As of April 4th, 2025, MRK closed at $81.47, down $4.92 (5.70%). The stock has declined steadily since peaking at $134 in June 2024.
In Q4 2024, Merck posted global sales of $15.6 billion, a 7% increase from the previous year. Sales growth stood at 9% when excluding foreign exchange effects. Full-year 2024 revenue reached $64.2 billion, a 7% increase over 2023. Human health sales grew 8%, driven mainly by oncology treatments.
KEYTRUDA remained the company’s top product with sales of $7.8 billion in Q4, rising 21%. WINREVAIR generated $200 million in sales, while new vaccine CAPVAXIVE added $50 million. The Animal Health division showed strong momentum, growing 13% year-over-year. Merck’s global reach extended to nearly 500 million people in 2024.
However, GARDASIL vaccine sales dropped 18% in Q4 due to lower demand in China. This led Merck to pause GARDASIL shipments to the region temporarily. Operating expenses for the quarter totaled $7.4 billion. The company reported a gross margin of 80.8%, up by 3.6 percentage points. Earnings per share came in at $1.72.
For 2025, Merck expects revenue between $64.1 billion and $65.6 billion. EPS guidance is set at $8.88 to $9.03, excluding foreign exchange impact. The Medicare Part D redesign could reduce revenue by about $400 million in 2025. This would affect WINREVAIR and other small molecule oncology drugs.
Technical Analysis
MRK stock is currently testing a major support level at $81.A confirmed breakdown at this critical level could push the stock lower. Price momentum and volume suggest a likely continuation of the bearish trend unless support holds. With the bearish pressure in place, the next support level lies at $70.
The weekly chart shows consistent lower highs and lower lows since June 2024. MRK has fallen nearly 65% from its peak of $134.
If the $81 current support holds, a short-term rebound is possible, with an immediate resistance target around $95. Reclaiming this level may signal early signs of a trend reversal. If a strong break at the $81 level is witnessed, the next target remains the $70 support.
The current trend favors sellers. One thing to watch closely is the April 24th, 2025, earnings call as performance updates may provide clarity on near-term price direction.

1987 vs 2025: Are We on the Edge of Another Black Monday? 🕳️📉 The chart comparison is chilling.
On the left, the infamous 1987 crash—a sudden gap over the weekend followed by a brutal free fall.
On the right? 2025. A similar gap, a similar setup... and the fear is creeping in. 🫣
🔍 Here’s what we’re seeing:
The current price action on the S&P 500 Futures eerily mirrors that of 1987.
A sharp drop after a failed breakout, followed by a massive gap down.
The psychological setup is nearly identical: markets under pressure, global tension, and growing uncertainty.
⚠️ While history never repeats exactly, it often rhymes. Is this just a healthy correction—or the beginning of something bigger?
📊 Keep an eye on volume, volatility, and macro catalysts—if we see continued panic selling, this pattern might live up to its reputation.
🧠 What do you think—coincidence, or a warning we shouldn’t ignore?
#BlackMonday #1987Crash #S&P500 #MarketCrash #SP500 #HistoryRepeats #TechnicalAnalysis

TRUMP & MELANIA Collapse - Sh*tcoin Reality CheckIf you had bought BINANCE:TRUMPUSDT or BINANCE:MELANIAUSDT.P at any point during the last three months, you’d likely be deep in loss within just days. These tokens, despite using the names of major political figures, followed a typical memecoin pattern:
🚀 Launch hype → 💰 Speculation → 📉 Massive dump
But here’s what traders need to remember:
🔁 These types of tokens can pump again. All it takes is a tweet, a trending news event, or a post from an influencer or celebrity—think Elon Musk. A spark like that could fuel a rally.
⚠️ However, the risk is extremely high. These projects often lack fundamentals, and the price action is driven mostly by hype and speculation. If you choose to trade them, know your risk tolerance and never overexpose your portfolio.
💡 This is the reality of memecoins. Recognize the pattern, protect your capital, and stay sober in the market.
📊 Follow for grounded insights and market wisdom—no hype, just facts. 🔔

GOLD BREAKS SHARPLY — BUT THE MOVE WAS WRITTEN IN THE STRUCTURE🟡 GOLD BREAKS SHARPLY — BUT THE MOVE WAS WRITTEN IN THE STRUCTURE
A steep drop in gold just rattled the markets — but if you’ve been following the macro and technical setup closely, this was not only expected, but anticipated.
From the first week of April, we’ve been tracking signals of potential exhaustion in XAUUSD:
🕯️ Candlestick wicks on higher timeframes
📈 Overextended structure
🧠 Macro divergence
Now, all signs have converged — and we’re finally seeing the correction play out.
🔍 Why This Isn’t Just About Gold
What we’re seeing is a broader shift in global market sentiment:
U.S., European, and Asian equities are all under pressure
Crypto has stagnated with little to no fresh capital inflow
Gold — after months of aggressive buying — is now facing wave after wave of profit-taking
This is classic risk-off behaviour.
Investors are choosing cash, sitting tight, and waiting for clarity — not only in the charts but in the headlines too.
📉 DXY Building a Case for Recovery
The U.S. Dollar Index (DXY) has been heavily sold in recent months — but is now holding at a multi-year structural support zone that’s been tested multiple times since 2021.
With Trump returning to the spotlight and triggering a fresh round of global tariff negotiations, the USD is regaining narrative strength.
Trump’s stance has already prompted discussions among major economies, putting the U.S. in a dominant position — and the market is beginning to price that in.
🤔 What’s Holding the Fed Back?
Despite rising trade tensions, the Federal Reserve has remained cautious — choosing not to act until the dust settles from geopolitical and policy developments.
This creates a window of opportunity:
If the Fed holds rates while global central banks soften
And if the USD holds this major support
→ We could see strong dollar flows return in Q2.
🔮 Gold Outlook – Where Next?
In the short term:
Expect continued volatility
Potential for gold to slide further toward 308x – 305x range
Any bounce is likely to be technical rather than fundamental
In the medium term:
Once political noise fades, gold may find support again
Especially if inflation expectations persist or the Fed pivots dovish later in Q2
💡 Takeaways for UK Traders
✅ Don't trade the news — trade the reaction
✅ Macro structure matters more than the daily headlines
✅ Capital preservation beats chasing euphoria
We’re not guessing.
We’re reading the story and planning with structure.

Golden Momentum to Short the goldWe already know what FED powell talked about on the 4th and trump's tariffs which have a very big effect on the global economy.
exchanges have fallen, this pattern is very similar where during the crisis the price of gold also fell sharply because there was no demand from the world and they saw the USD as a safe heaven because the price of gold was also too high.
Price between 3040 -3070 is a entry price to short
Price rocketing above 3110 = bull resisting (very small chance, only below 5%)
Good luck for your trade, lets win this trade.

SPX 1D 200 EMA Retest? As the 9&21W EMAs cross and a new local low printing after a SFP top, could the S&P500 be getting its first major correction since Jan 2022?
From a TA standpoint this kind of setup looks to be high probability with good R:R for the bears. Targeting the 1W 200 EMA is the most logical area as it remains major support and whenever tested holds strong.
From a bulls standpoint this is worrying but could be rectified with a reclaim of the 9&21 EMAs preventing a "death cross" from there acceptance above the high would be the next step to maintain the rally.
Fundamentals play a major role and the geopolitical world shows no signs of slowing down, perhaps the tariffs angle is introducing uncertainty in American companies? Or the index is just exhausted from 2.5 years of climbing? Either way the chart is an interesting one to monitor for now.

HOLY MOLY! ARE WE IN A RECESSION? $TSLA $120 BEAR FLAG PATTERNA bear flag trading pattern is a technical analysis formation that features a downward-sloping flagpole, followed by a consolidation phase forming a parallel channel. This pattern suggests a potential sharp decline or continuation of the downward trend
I also notice a head and shoulders pattern, as well as an inverse cup and handle.
Everything points to $120.
Sell/Short NASDAQ:TSLA right now with fact check:
+brand reputation risk, high competition, loss of EV market leadership, cyber truck/ product recalls, declining sales with lower margin, stock volatility concern, insider selling, investors buy it based on expected future earnings rather than its current profitability.
+ potential stagflation, tariff war, slow economic growth, inflation, rising public debt, geopolitical tensions, ai bubble, and more

$SOXL $SOXX BOTTOMED (ASCENDING TRIANGLE)An ascending triangle is a bullish breakout pattern that occurs when the price breaks through the upper horizontal trendline with increasing volume. The upper trendline is horizontal, showing nearly identical highs that create a resistance level. Meanwhile, the lower trendline slopes upward, indicating higher lows as buyers gradually increase their bids. Eventually, buyers become impatient and push the price above the resistance level, triggering further buying and resuming the uptrend. The upper trendline, which previously acted as resistance, then becomes a support level.
Semiconductors NASDAQ:SOXX are crucial to the United States for several reasons:
Technological Backbone: Semiconductors power essential technologies like smartphones, computers, cars, and medical devices. They are integral to almost everything with an on/off switch. The semiconductor industry aka NASDAQ:SOXX significantly contributes to the U.S. economy. It supports millions of jobs and drives innovation in various sectors, including artificial intelligence, biotechnology, and clean energy.
Semiconductors are vital for national security. They are used in military systems, aircraft, weapons, and the electric grid, making them critical for defense and infrastructure. Maintaining a strong semiconductor industry helps the U.S. stay competitive globally so BUY AMEX:SOXL , $SOXX. The CHIPS and Science Act, for example, aims to revitalize the U.S. semiconductor industry, create jobs, and support American innovation. Strengthening the domestic semiconductor supply chain reduces dependency on foreign sources, enhancing the resilience and security of supply chains.
BUY NOW AND HOLD

SP500 Plunges 8% in a day!! Oversold or more pain ahead?The SP500 has suffered a massive 8% drop, currently trading around 5158 at the moment, after market turmoil triggered by Trump's new tariff war. Panic selling has pushed the 30-minute RSIto an extreme oversold level of around 28, signaling potential short-term exhaustion.
Possible Scenarios:
🔹 Short-Term Bounce? The RSI suggests a possible technical rebound, with key resistance around 5200-5250 if buyers step in. Watch for volume confirmation.
🔹 Further Downside? If panic continues, the next major support lies at 5100, followed by 5000 psychological level, where institutional buyers might defend price.
⚠️ Caution: Markets remain highly volatile! A dead-cat bounce is possible, but uncertainty surrounding tariffs could fuel more downside pressure. Stay sharp!
📊 What’s Your Take? Will SP500 recover or break lower? Drop your thoughts below! 🚀🔥
#SP500 #StockMarketCrash #Tariffs #Trading #TechnicalAnalysis #RSI

WTI / OIL PoV - Break Point 65$ / 62$ / 47$ LONG The price of oil has recently undergone a significant retracement, dropping to its lowest levels in the last three months. This decline has been influenced by several factors, including trade tariff policies and decisions made by OPEC+.
In March 2025, the price of Brent crude fell below $70, touching a low of $69.76, its lowest since September. In New York, West Texas Intermediate (WTI) lost 1.64%, reaching $67.24. New tariffs imposed by the Trump administration on imports from Canada and Mexico have fueled uncertainty about international trade, raising concerns that global economic slowdown might cause oil demand to fall behind supply.
Additionally, OPEC+ decided to increase production by 138,000 barrels per day in April, with the goal of reaching a production level of 2.2 million barrels per day by 2026. This decision contributed to an oversupply that could negatively affect prices, especially if economic growth slows.
Trade tariffs have had a direct impact on the oil market. In February 2025, China imposed a 10% tariff on U.S. crude oil in response to U.S. tariffs, contributing to the drop in oil prices to their lowest levels of the year. Additionally, U.S. crude oil inventories increased beyond expectations, indicating further weakness in demand.
Geopolitical tensions, such as the U.S. proposals to take control of Gaza and the intention to strengthen sanctions on Iran, have added further uncertainty to the market, affecting consumer and investor confidence.
Regarding the price levels you’ve identified for potential purchases, it's important to note that the oil market is influenced by a combination of geopolitical, economic, and supply factors. The support levels at $65, $62, and $57 that you've pointed out may represent significant technical levels, but it’s crucial to monitor geopolitical developments and trade policies that can affect price volatility. It is advisable to consult up-to-date sources and market analysis before making investment decisions.

Apple (AAPL) Shares Plummet Over 9% Following Trump's TariffApple (AAPL) Shares Plummet Over 9% Following Trump's Tariff Announcement
Many stock indices declined after the US President announced the introduction of tariffs for multiple countries, as we reported yesterday morning. During yesterday’s trading session, the sell-off in equities intensified.
According to media reports, market participants had hoped that the tariff threats were mere rhetoric and a negotiation tactic. However, many were shocked by both the number of countries affected and the scale of the imposed tariffs. Several well-known technology companies led the market downturn.
How Do Trump's Tariffs Impact Big Tech Companies?
Significant tariffs were imposed on Chinese imports, yet Apple manufactures around 90% of its iPhones in China. Many affordable products sold on Amazon are also set to become more expensive, as they are sourced from China.
Meta Platforms' advertising business could suffer considerable losses as companies worldwide cut advertising budgets. Nvidia and Broadcom may also struggle, given that the tariffs apply to many electronic devices incorporating their chips.
As a result, shares of Apple (AAPL), Amazon (AMZN), Meta Platforms (META), Broadcom (AVGO), and Nvidia (NVDA) fell by approximately 9% by the close of trading yesterday.
Microsoft (MSFT) shares, however, proved more resilient, dropping just 2.3%, as software products are not easily subject to tariffs. Moreover, software developers do not rely on international supply chains.
Technical Analysis of AAPL Chart
Apple’s stock price fluctuations have formed a trend channel (shown in blue), with:
→ The upper boundary acting as resistance since last autumn, although bulls managed to push the price above it during the Christmas rally. We previously highlighted Apple’s overbought condition and the possibility of a correction on 27 December 2024.
→ New data indicates that resistance has now shifted to the median at around $225.
This puts the lower boundary of the trend channel at risk of a bearish breakout. In the coming days, AAPL’s chart may see a bearish assault on the psychological $200 level, which proved significant in August 2024.
This article represents the opinion of the Companies operating under the FXOpen brand only. It is not to be construed as an offer, solicitation, or recommendation with respect to products and services provided by the Companies operating under the FXOpen brand, nor is it to be considered financial advice.

Not Even Gold Escaped the Volatility of Liberation DayWe finally saw the shakeout on gold I was expecting around $3000. This clearly changes things for gold traders over the near-term, even though the fundamentals remain in place for bulls. I highlight key levels for gold and take a look at the devastation left across key assets on Thursday.
Matt Simpson, Market Analyst at City Index and Forex.com
