OH NO GUESS WHAT I FOUND $TSLA HEAD AND SHOULDERThe head and shoulders pattern is a chart formation in technical analysis that signals possible trend reversals, often suggesting a change from a bullish to a bearish trend. It features three peaks: a central "head" that is the highest, flanked by two "shoulders," with a neckline connecting the troughs between these peaks.
Tesla's stock is often viewed as a risky investment for several reasons:
High Valuation: NASDAQ:TSLA stock price is considered very high compared to traditional car manufacturers, with a much higher price-to-earnings ratio.
Market Volatility: The NASDAQ:TLSA price is highly volatile, influenced by factors like CEO Elon Musk's public comments, regulatory changes, and overall market sentiment.
Intense Competition: The electric vehicle market is becoming more competitive, with many established and new companies investing heavily in EV technology.
Production Issues: Tesla has experienced production and supply chain challenges, which can affect its ability to meet demand and maintain profitability.
Regulatory Risks: Changes in government policies and regulations, especially those related to environmental standards and EV incentives, can significantly impact Tesla's business.
While these points highlight potential risks, Tesla also has strengths such as strong brand recognition, technological innovation, and leadership in the EV market. It's important to consider both the risks and potential rewards when evaluating Tesla as an investment.
SELLL NOW!!!!!
Trump

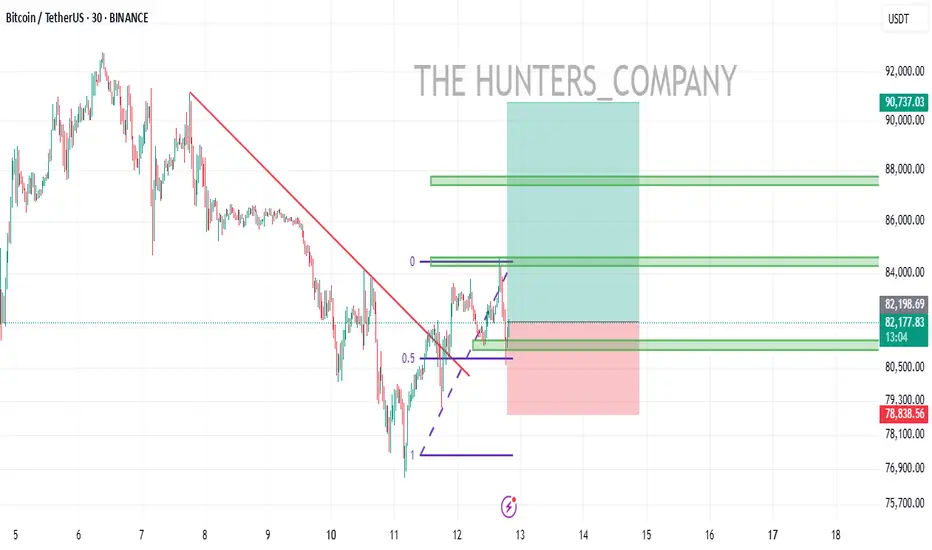
BTC/USDTHello friends
After a heavy fall, now with the trend line broken and the ceiling and floor higher after creating a pullback, you can enter the capital with capital management.
*Trade safely with us*
POPCAT...Hello friends
Given the good price growth and the arrival of buyers, you can enter into a transaction during the price correction with capital and risk management.
*Trade safely with us*

PEPE...Hello friends
Regarding the price drop, now that buyers are supporting the price, it was entered within the specified support ranges with capital and risk management.
*Trade safely with us*

EASY $280Hey, I'm back with $TSLA.
Buy now! It will reach $283 soon.
+ Let's see if NASDAQ:TSLA breaks $283.
I don't need to explain why it will rise again cause the selloff has been too intense (oversold), and all the bad news is already factored in.
We buy in fear and sell in greed

Already kicking the dead for a whileChart
From October 22 to march 24 we had a strong upside move.
Now we are in a deep retrace, the chart is reacting on further down moves with little emotion, I think we are kicking the dead for a while already.
In my opinion we can do even 150$ in 2 months. Than we will see.
Strategically
Trump most likely works for russian secret service. US is on the way to a regular dictatorship unfortunately, I have seen it many times before, all the same approach. He can destroy many important things and harm the usual economy in general, but the AI is so important that it could be the one of islands that will outperform despite the craziness.

3/24/25Happy Monday
@ 9:45am we have news:
US Flash Manufacturing PMI
US Flash Services PMI
As long as this long trend line isnt broken, I will look for an entry at 3038 AFTER 10:00am

CAKE/USDT(BUY)hello friends
According to the price correction, we can now buy in steps and move with it until the specified goals.
*Trade safely with us*

TRUMP(UPDATE)Hello friends
Given the good price growth, now in the pullbacks that the price makes, we can buy in the specified support areas and move with it to the specified targets.
Of course, with capital and risk management...
*Trade safely with us*

XAUUSD – Bullish Surge on Fort Knox UncertaintyMarket Context
Gold has been on a tear, recently hitting all-time highs above $3,000, driven by geopolitical tensions, inflation fears, and a weakening U.S. dollar. A new wildcard has emerged: whispers of President Trump exposing whether the U.S. gold reserves at Fort Knox are intact—or missing. Posts on X suggest Trump and Elon Musk might push for an audit, with some claiming Treasury officials are resisting. If Trump reveals the gold is gone or encumbered, it could shatter trust in the dollar, sending gold parabolic. Conversely, confirmation of reserves might trigger a short-term pullback as uncertainty fades.
Fundamental Thesis
Bullish Case: If Trump exposes Fort Knox as empty or compromised, gold becomes the ultimate safe haven. A loss of faith in U.S. financial credibility could weaken the dollar further, driving XAUUSD toward $3,500 or higher as investors pile in.
Bearish Risk: If an audit confirms the gold is there, profit-taking could hit, dropping gold to key support levels around $2,900-$2,950.
Wildcard: Market volatility spikes either way due to the headline risk.
Technical Analysis
Current Trend: XAUUSD is in a strong bullish channel, consolidating near $3,000-$3,020 after breaking $2,950 resistance.
Key Resistance: $3,050 (psychological), $3,100 (next Fibonacci extension from the October 2024 low).
Key Support: $2,980 (21-day EMA), $2,950 (recent breakout level), $2,900 (50-day EMA).
RSI: 68 – nearing overbought but not extreme, suggesting room for more upside.
Volume: Rising, indicating strong buyer interest as the Fort Knox story gains traction.
Trading Plan
Entry: Buy at $3,015 (current price) or on a dip to $2,980-$2,990 (strong support zone).
Target 1: $3,100 (short-term profit-taking level).
Target 2: $3,250 (if Fort Knox fears escalate and dollar dumps).
Stop Loss: $2,950 (below recent breakout and 50-day EMA for risk management).
Risk/Reward: ~1:3 on Target 1, ~1:6 on Target 2.
Scenario Breakdown
Trump Exposes Fort Knox Issue: Gold breaks $3,050 with momentum, targeting $3,250-$3,500 as a dollar crisis unfolds. Watch for a spike in volatility and X posts amplifying the narrative.
Gold Confirmed Safe: Expect a quick drop to $2,950-$2,900 as speculators exit, but the broader bullish trend likely holds due to ongoing macro drivers (inflation, geopolitics).
No News: Consolidation continues between $2,980-$3,050 until clarity emerges.
Why This Matters
Fort Knox holds (supposedly) 147.3 million ounces of gold, valued at ~$42 billion at $42/oz (book value) but over $440 billion at current prices. If Trump proves it’s missing or leveraged, it’s a game-changer—gold could soar as the ultimate hedge. X chatter is heating up, with sentiment leaning toward skepticism of official claims.
Final Thoughts
This is a high-probability bullish setup with a rare fundamental kicker. Stay nimble—watch Trump’s next move, X sentiment, and dollar strength (DXY). If the Fort Knox lid blows off, $3,500 isn’t a ceiling; it’s a stepping stone. Trade safe, and let’s see where the yellow metal takes us!

2 more reasons to buy gold? Israel is sending a delegation to Washington for strategic talks on Iran, while Trump has reportedly given Tehran a two-month deadline for a nuclear deal—so far, Iran isn’t engaging.
So, the question is: Are we headed towards military conflict or a significant wave of sanctions?
Meanwhile, protests erupted after Erdoğan’s main rival was arrested, triggering a sharp selloff in Turkish markets. The lira hit record lows, forcing the central bank to intervene with nearly $10 billion in currency sales.
Turkey’s inflation remains elevated at 39%, with interest rates at 42.5%. Continued lira weakness could push inflation higher, forcing further rate hikes and adding to the country’s economic instability.
DAX Trade Log DAX Buy Setup with Ichimoku Confluence
Geopolitical tensions—especially the ongoing conflict in Eastern Europe—continue to influence risk sentiment, while inflation and central bank policy remain in the spotlight. The European Central Bank’s more hawkish stance contrasts with fears of slowing growth in the Eurozone. Despite these headwinds, the DAX could see a near-term bounce, supported by technical signals:
1. Ichimoku Confluence : Price is testing the Kijun and the lower edge of the cloud, aligning with a daily pivot. A close back above the Kijun/cloud area suggests potential upside.
2. Volume Spike : Recent volume surge around this support zone may indicate bullish absorption—watch for follow-through.
3. Macro Backdrop : Although persistent inflation and geopolitical uncertainties loom large, short-term volatility can present trading opportunities. Keep an eye on ECB communications and any unexpected developments in global tensions.
4. Risk Management : A 120-point SL (around 2% account risk) below the key support could help protect against false breaks. Targets include the top of the cloud or previous swing highs.
5. 8-Day Cycle : Day 2 in your cycle analysis suggests a potential upswing—confirmation will come if price holds above this confluence zone.
Stay vigilant, monitor news flow, and maintain discipline in your trading plan. This is not financial advice—always do your own due diligence.

Trump Zelensky and Putin Phone Calls
Hi, my name is Andrea Russo and I am a Forex Trader. Today I want to talk to you about how the recent phone calls between Donald Trump, Volodymyr Zelensky and Vladimir Putin have had a significant impact on the financial markets, especially the Forex market.
In recent days, US President Donald Trump has had crucial phone conversations with Ukrainian President Volodymyr Zelensky and Russian President Vladimir Putin. These talks have mainly focused on finding a truce in the conflict in Ukraine and stabilizing international relations.
Trump-Zelensky Phone Call
The call between Trump and Zelensky was described as "very good" by both leaders. During the conversation, Trump promised support for strengthening Ukraine's air defense, with a focus on the resources available in Europe. In addition, the possibility of the United States taking a role in managing Ukraine's energy infrastructure, such as nuclear power plants, to ensure greater security was discussed2. This has opened up hope for a partial truce, with technical negotiations expected in the coming days in Saudi Arabia.
Trump-Putin Call
The conversation between Trump and Putin, which lasted about three hours, touched on key issues such as the ceasefire and the need for lasting peace. Both leaders agreed on a path that includes a partial ceasefire on energy infrastructure and negotiations to extend the truce to the Black Sea. In addition, they discussed improving bilateral relations between the United States and Russia, with a focus on economic and geopolitical cooperation5.
Impact on the Forex Market
These developments had an immediate impact on the Forex market. The prospect of a truce strengthened the Russian ruble (RUB) and the Ukrainian hryvnia (UAH), while the US dollar (USD) showed slight volatility due to the uncertainties surrounding the negotiations. Investors reacted positively to the possibility of geopolitical stabilization, increasing demand for emerging market currencies. However, the market remains cautious, awaiting further details on the negotiations and the actual implementation of the measures discussed.
Conclusion
The phone calls between Trump, Zelensky and Putin represent a significant step towards resolving the conflict in Ukraine and stabilizing international relations. For Forex traders, these events offer opportunities but also risks, making it essential to closely monitor geopolitical developments and their implications on financial markets.

TRUP/USDT in the coming hoursHello everyone, let's look at the 4H TRUMP to USDT chart, in this situation we can see how it has come out of the triangle on top and currently we can see a fight with the current resistance at $11.45, in a situation when it comes out of it on top it can go towards the targets at the levels:
T1 = $11.89
T2 = $12.58
Т3 = $13.08
Now let's move on to the stop-loss in case the market continues to fall:
SL1 = $11.06
SL2 = $10.40
SL3 = $9.76
When we look at the RSI indicator we can see how on the 4h interval we have come out of the range on top, which however in the short term may give an attempt to recover the price or a temporary sideways trend.

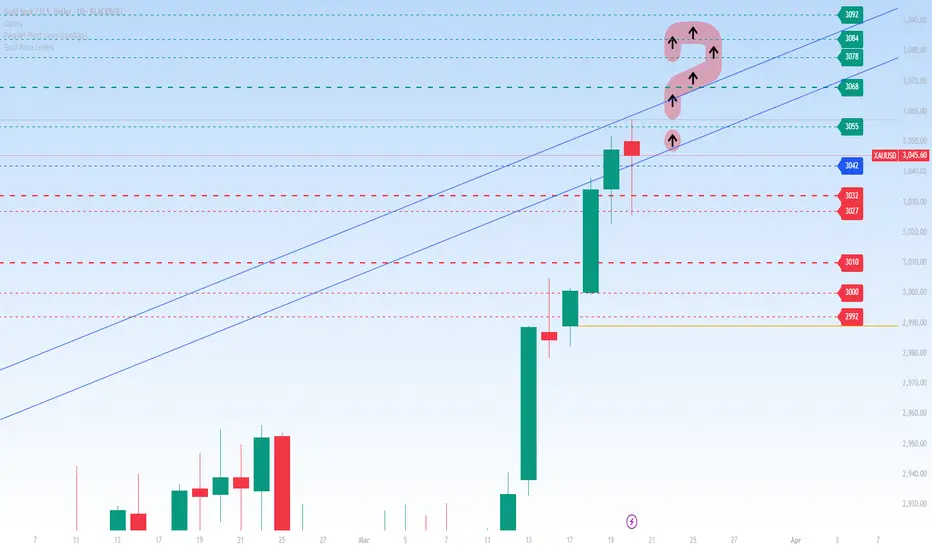
GOLD market Update: BUY DIPS 2990 USD TP 3100 USD🏆 Gold Market Update / Wednesday
📊 Technical Outlook
🔸Bullish OUTLOOK
🔸5 waves Bullish Sequence on H1
🔸2846/2930 w1, 2930/2887 w2, 2887/3045 w3
🔸3045-3055/2980-2990 wave 4 pullback now
🔸2980-2990/3100 - final wave 5 pump
🔸Recommend to BUY DIPS 2980/2990 USD
🔸Price Target BULLS: 3100 USD in Wave5
🏆🔥 Latest Gold Market Update – March 2025 🔥🏆
🚀 Gold Prices Hit New Highs!
💰 Gold Breaks $3,040+ – Soaring to record levels as investors seek safe-haven assets. 🏦✨📈
📊 Analysts Raise Targets – UBS forecasts $3,200 by June amid strong bullish momentum. 🔮💎
🌎 Key Market Drivers:
⚠️ Geopolitical Tensions Rising – Middle East conflicts fuel gold’s safe-haven appeal. 🌍🔥
📉 Stock Market Volatility – Investors flee equities, boosting gold demand. 📊📢

Just In: $TRUMP Dips 5% Down to $10.86 Pivot Trump token a coin created in the start of the year 2025 that saw a noteworthy uptick surging from a low of $3 to almost $80 dips 5% today retracing to the $10.888 support point amidst general crypto landscape.
The 78.6% Fibonacci retracement point is acting as support point for $TRUMP a break below that level could lead to the 1-month low axis as the RSI is weak presently at 37.
Similarly, a break above the 38.2% Fibonacci retracement point could spark a bullish reversal move or a temporary reprieve albeit the crypto market is volatile at the moment.
OFFICIAL TRUMP Price Live Data
The live OFFICIAL TRUMP price today is $10.84 USD with a 24-hour trading volume of $476,149,181 USD. OFFICIAL TRUMP is down 5.55% in the last 24 hours, with a live market cap of $2,167,125,027 USD. It has a circulating supply of 199,999,527 TRUMP coins and a max. supply of 999,999,993 TRUMP coins.

TRUMP buy/long setup (4H)It seems that a diametric has completed on the chart. However, Wave G is suspected not to have fully ended yet, and only a part of Wave G might be complete.
A trigger line has been broken, and a support zone has formed, where short-term trades or scalping opportunities can be considered.
As you know, this is a meme coin and carries risk, so make sure to manage leverage and capital properly.
Targets are marked on the chart—secure profits at each target.
The closure of a 4-hour candle below the invalidation level will invalidate this analysis.
For risk management, please don't forget stop loss and capital management
Comment if you have any questions
Thank You

Will Trump’s crypto lose 26% more after breaking key levels?Hello and greetings to all the crypto enthusiasts, ✌
All previous targets were nailed ✅! Now, let’s dive into a full analysis of the upcoming price potential for Trump 🔍📈.
Trump’s cryptocurrency has undergone a sharp decline, losing all Fibonacci support levels and previously established temporary support zones. I had foreseen this downturn from higher price levels, and current market conditions suggest the potential for at least another 26% drop. A break below the critical psychological support at $10 could accelerate further losses, with my primary downside target set at $9. This scenario aligns with my broader technical analysis, indicating continued bearish momentum in the asset.📚🙌
🧨 Our team's main opinion is: 🧨
Trump’s cryptocurrency is crashing hard, breaking all key supports, and if it falls below $10, I expect at least another 26% drop, with $9 as my main target. 📚🎇
Give me some energy !!
✨We invest hours crafting valuable ideas, and your support means everything—feel free to ask questions in the comments! 😊💬
Cheers, Mad Whale. 🐋

Why gold remains strong: Latest on Ukraine and Yemen Gold remains in high demand as a safe-haven asset, currently trading at $2,998.7 per ounce.
Why the need for a haven? Here’s an update:
A ceasefire in Ukraine hinges on some unpalatable conditions. Donald Trump has announced plans to speak with Vladimir Putin on Tuesday, saying that land and power plants are part of the negotiations. Reports suggest his administration is considering recognising Crimea as Russian territory and may push for UN recognition.
In the Middle East, the U.S. carried out military strikes over the weekend on Houthi-controlled areas in Yemen. The strikes came after the group threatened to resume attacks on Red Sea shipping.
Trump has declared that Iran will be held directly responsible for “for every shot fired” by the Tehran-backed Houthi rebels. In response, the Houthis vowed to “respond to escalation with escalation.”.

Nasdaq pushIv been watching this chart for a long time now and it seems on the 6month chart we are retesting the last candle close and coming down to lower-time frames i can see consolidation and a mix on reversals here im looking at it as one big break and retest

17/03/25 Weekly outlookLast weeks high: $85,306.40
Last weeks low: $76,622.98
Midpoint: $80,964.69
It's FOMC week again! Last week it was CPI week and inflation numbers came in under forecast signaling the Tradfi market sell-off and implementation of tariffs have at least had a positive impact on the consumer price index, a 2.8% print 0.1% lower than forecast. As this relates to FOMC the forecast is a non mover with interest rates staying at 4.5%.
However this does not necessarily mean that FOMC will be a non event in terms of the markets, volatility is always expected and with a suspected Trump insider opening a $380m 40x short position on BTC with a liquidation price of $86,600. I expect this price to be hit at some point this week purely because CT is targeting this account that has had a perfect 8/8 trade record to stop hunt it, I think FOMC could proved the volatility to do it.
The general structure of BTC as a whole despite this stop hunt narrative is bearish, after losing $91k support and a retest confirming the level as new resistance structurally it makes sense to revisit FWB:73K to retest it as support. This would be horrible for the broader altcoin market that has suffered greatly so far this year but it would eliminate the need to fill the FVG in the future.
This week I am keeping a close eye on that stop hunt and FOMC as I feel that will dictate if we retest $91K or $73K.

TrumpHello Traders,
Today we are posting a trade we see that we know you are all eyeing. BINANCE:TRUMPUSDT
This is a trade we saw in our weekly trade hunt. If you are not familiar in TA and have a hard time understanding the chart feel free to reach out to us and we will happily help you understand.
Stay profitable,
Savvy

WIF/USDTHello friends
According to the market cycle, the price decline is ongoing and is expected to continue.
Now the only important support is the green area, which the price reaches there and we will see what reaction we get from the buyers.
Will they support the price or will the decline continue...
If you want to be with us in this alt season, send us a message.
*Trade safely with us*
