All-Time Highs (3% Up) or US/China Trade Gap (4-5% Down)?It's summer time (1st week of June)
Brutally slow price action thus far, Non-Farm Payroll hits this Friday
Next week will be more US Inflation Date (CPI, PPI)
S&P and Nasdaq are only 3% (or slightly less) away from all-time highs
Melt-up momentum says it's the path of least resistance
US/China Trade Agreement Gap (that silly little Monday announcement) is 4-5% lower
Whatever we hit, there will be disappointed traders and investors - the ultimate pain trade :)
I'm not bearish, I'm ridiculously cautious as a bull and wanting to see a pullback. I can tell
because it's actually annoying watching the market grind so slow to the upside shrugging
off every bad news bite and sense of reality
The big beautiful tax bill is losing support (see Elon Musk's latest comments)
The Trump Administration has pivoted so hard the other way the market is virtually
ignoring tariff news now
Let price be your guide. I'm connecting the April 7 lows forward and if the bears cross it and price sweeps some lows, there might be some pullback potential in the cards
Plenty to watch - be patient - opportunities await. Not forcing anything for now and I'm
doing the "boring" stuff for income trading.
Thanks for watching!!!
Trump

TRUMPUSDT – Daily Technical AnalysisTRUMPUSDT – Daily Technical Analysis
The price has reached a key daily support level at $10, showing potential signs of a bullish reversal.
If the support holds, we may see a move toward the resistance area around $14, offering a decent upside opportunity.
In a more bearish scenario, the price could extend its correction to the $9 support zone, which may serve as a stronger foundation for the next upward impulse.
🟢 Key Support Levels: $10 (daily), $9 (secondary support)
🔴 Resistance Zone: $14
Stay tuned for more technical insights and updates.

Tesla vs. BYD: The Market’s Greatest IllusionIntroduction: The Tale of Two Companies
You don’t need to be an economist to see it. Just compare Tesla and BYD.
BYD: Founded in 1995, Chinese, over $107 billion in revenue.
Tesla: Founded in 2003, American, with less revenue—but a market cap six times bigger.
The reason? Because one sells cars, and the other sells dreams. And Wall Street loves a good dream.
The Illusion Economy: When Hype Outweighs Reality
Tesla’s valuation isn’t tied to assets, production, or profits. It’s a ritual of collective belief—a performance act where branding replaces substance, and expectation outweighs reality.
It’s the same logic behind a $1,000 jacket that costs $100 to make. Put a fancy logo on it, and suddenly, it’s not overpriced—it’s "premium." You're not just buying a product; you're investing in a lifestyle. Sure. Keep telling yourself that.
Tesla is the $1,000 jacket. BYD is the actual tailor shop.
Tesla vs. BYD: The Numbers Tell the Story
Tesla’s market cap is over $1 trillion, while BYD’s is under $200 billion. Yet, BYD outsells Tesla globally, especially in China, where it dominates the EV market. Tesla’s valuation is built on brand perception, future promises, and speculative optimism, while BYD’s is grounded in actual production and revenue.
Financial Storytelling Over Business Reality
Tesla isn’t just a car company—it’s a financial illusion. Markets rise not on performance, but on promise. Stock prices reflect not what a company is, but what a hedge fund feels it might become. It’s not a business model—it’s mood swings with decimal points.
BYD’s Competitive Edge
Production Power: BYD manufactures more EVs than Tesla annually.
Battery Innovation: BYD’s Blade Battery is safer, lasts longer, and is cheaper than Tesla’s.
Affordability: BYD’s EVs are significantly cheaper, making them more accessible to global consumers.
Market Reach: BYD dominates China, the world’s largest EV market, while Tesla struggles with pricing and competition.
The Consequences of Buying the Dream
Tesla’s valuation isn’t creating better cars. It’s just creating dumber investors.
Investors who think they’re visionaries because they bought into the hype.
Consumers who think they’re elite because they bought the label.
Boards who think they’re gods because someone inflated their stock ticker.
But every illusion has an expiration date. Every bubble has its needle. And when dreams are sold on credit, reality always comes to collect.
Reality Always Comes to Collect
This isn’t growth. It’s speculative theater funded by your retirement account.
Real value doesn’t need hype. It appears in supply chains, production lines, tangible goods, and on profit sheets that make sense even without a TED Talk.
So next time you see Tesla’s trillion-dollar valuation, ask yourself: Are you investing in a business? Or are you just buying the dream—before it bursts?

What is the TACO trade in forex trading? The “TACO trade” – short for “Trump Always Chickens Out” – originated in equity markets but is equally relevant in forex. The pattern is simple: Trump signals aggressive tariffs, markets react and then reverse when the threat is walked back.
One example: In May 2025, the U.S. dollar weakened sharply after Trump announced a 50% tariff on EU imports. EUR/USD rallied to 1.1440 as traders priced in slower U.S. growth. But just days later, the Trump delayed the tariffs to July, and the dollar quickly regained ground.
For forex traders, the TACO trade strategy is about timing: entering on initial panic and exiting on the rollback.
That said, it’s not without risk. If tariffs are actually enforced, the dollar’s decline may be more prolonged. And with markets increasingly aware of this pattern, reactions may become less predictable.

CRUDE OIL TO HIT $160?!Oil prices broke down lower in the past few weeks, after a much needed LQ grab, following a 2 year consolidation. We’ve seen a ‘5 Wave Complex Correction’, which should now be followed by price recovery.
Wait for buyers to BREAK ABOVE our ‘buying confirmation’ level, followed a by a retest before buying, otherwise leave it❗️

#TRUMP/UDT#TRUMP
The price is moving within a descending channel on the 1-hour frame, adhering well to it, and is heading towards a strong breakout and retest.
We are experiencing a rebound from the lower boundary of the descending channel, which is support at 11.10.
We are experiencing a downtrend on the RSI indicator that is about to break and retest, supporting the upward trend.
We are heading towards stability above the 100 Moving Average.
Entry price: 11.22
First target: 11.37
Second target: 11.55
Third target: 11.77

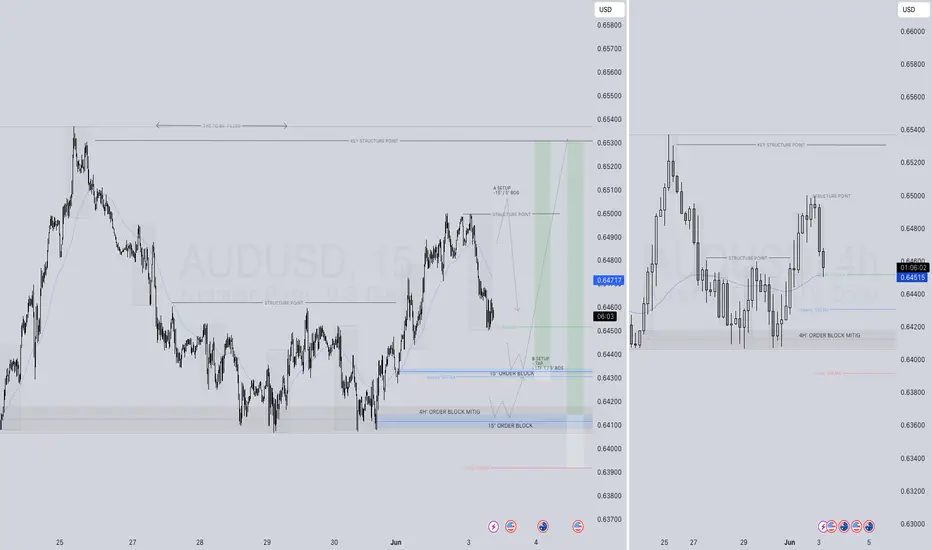
AUDUSD LONG FORECAST Q2 W23 D3 Y25👀 AUDUSD LONG FORECAST Q2 W23 D3 Y25
Professional Risk Managers👋
Welcome back to another FRGNT chart update📈
Diving into some Forex setups using predominantly higher time frame order blocks alongside intraday confirmation & breaks of structure.
Let’s see what price action is telling us today! 🔥
💡Here are some trade confluences📝
✅Weekly 50 EMA
✅Daily 50 EMA
✅15’ order block
✅Intraday bullish breaks of structure
🔑 Remember, to participate in trading comes always with a degree of risk, therefore as professional risk managers it remains vital that we stick to our risk management plan as well as our trading strategies.
📈The rest, we leave to the balance of probabilities.
💡Fail to plan. Plan to fail.
🏆It has always been that simple.
❤️Good luck with your trading journey, I shall see you at the very top.
🎯Trade consistent, FRGNT X
$BTC not finished yetHey!
I'm still me, just a quick rebranding honoring my father.
CRYPTOCAP:BTC cycle is far from over. Not saying we bottomed yet. I think prices bewteen 96 - 102k could be reached on the upcoming days.
Althought this bearish momentum, we should encounter a goooood support level which would lead us to a great short absortion. If price holds those levels this week (maybe next too) there is a high chance we will see a new leg above the ATH level.
Im long here. Stay tuned

$TRUMP Bounces from Golden Pocket – Rally Incoming?$TRUMP has bounced from a strong support zone around $10.30–$10.50, which lines up with the 0.618 Fib level.
As long as this support holds, price could push toward $11.78 and possibly higher to $13.00+ if momentum builds.
The structure looks healthy, and buyers are stepping in again.
Keep watching, a move toward the upper levels may be starting! 👀
#Trump #ALTSEASON

Bitcoin - Will Bitcoin reach $120,000?!Bitcoin is in its short-term descending channel on the four-hour timeframe, between the EMA50 and EMA200. Personally, I would look to sell Bitcoin at a target of $100,000. Either from the channel ceiling or after an invalid breakout of the specified channel. If this corrective move occurs, Bitcoin buying opportunities can be sought within the demand zone.
It should be noted that there is a possibility of heavy fluctuations and shadows due to the movement of whales in the market, and capital management in the cryptocurrency market will be more important. If the downward trend continues, we can buy within the demand range.
The Bitcoin 2025 Conference, widely regarded as the largest global event dedicated to Bitcoin and blockchain technology, took place from May 27 to 29 at the Venetian Convention Center in Las Vegas, Nevada. First launched in 2019 and held annually since, the conference has become the central meeting point for Bitcoin enthusiasts and professionals, offering a platform for knowledge exchange, ideation, and innovation within the Bitcoin ecosystem. With over 30,000 attendees, 400 speakers, and participation from around 5,000 companies, this year’s event played a significant role in advancing the global adoption of Bitcoin—often referred to as “hyperbitcoinization.”
The 2025 edition covered not only technical subjects such as Layer 2 scaling solutions and privacy enhancements, but also broader themes like institutional adoption, strategic Bitcoin reserves, and its implications for financial freedom on a global scale.From an economic perspective, there was a strong emphasis on Bitcoin’s role as a store of value amid inflationary pressures and unstable monetary policies. Forecasts presented by key figures such as Michael Saylor and Paolo Ardoino pointed to Bitcoin’s potential to emerge as a foundational asset within global financial systems. These projections were further supported by the expansion of the M2 money supply in 2024 and expectations for continued growth into 2025.
In addition to highlighting opportunities, the event also addressed the challenges facing Bitcoin. One major concern was the lack of clear legal and regulatory frameworks in certain countries—a topic addressed by Caitlin Long and other speakers. Such regulatory uncertainty could hinder broader Bitcoin adoption. Moreover, Bitcoin’s price volatility—highlighted by a 3.4% decline in the weeks leading up to the conference—raised questions about the market’s long-term stability.
Meanwhile, Coinbase reported that the repayment of debts related to the bankrupt FTX exchange could act as a $5 billion liquidity injection into the crypto market. This development is expected to boost capital inflows and potentially draw major institutional players back into the space.
According to Coinbase, as of May 30, the “FTX Recovery Trust” has begun its second phase of repayments, distributing over $5 billion in stablecoins to creditors. These payouts are being processed over three days via the BitGo and Kraken platforms. Unlike the first round in February, this phase involves only stablecoin disbursements rather than a mix of crypto and cash—enabling recipients to reinvest their funds more quickly and efficiently.
Additionally, U.S.-based companies currently hold 94.8% of all Bitcoin owned by publicly traded firms. The U.S. also commands 36% of the global Bitcoin hash rate, underscoring its dominance in mining activities. So far, 36 U.S. states have enacted pro-Bitcoin legislation, signaling a growing legal endorsement of the cryptocurrency across the country. This level of concentration—in ownership, regulatory leadership, and mining capacity—could position the U.S. to play a more decisive role in shaping future global Bitcoin regulations.

$DOT - Polkadot imminent bullish momentumHey traders!
Hope you are doing GREAT!
On this occasion I've decided to spot on CRYPTOCAP:DOT as its showing a clear bullish momentum ( as other alts). The chart is clear about the movement. There is no need to use fancy indicators neither a complex analysis.
Just price action.
As a brief comment, $Polkadot broke a clear bearish trend with confirmation on the daily timeframe. That's why I'm looking for a speculative trade (just in and out).
What I'm targeting? Prices between 6.00 USD and 7.00 USD in short term could be a nice zone to take profits.
Stay tuned!

The TACO Trade Is Back!🌮 AMEX:SPY
📊 The Setup:
The TACO trade ("Trump Always Chickens Out") continues to prove its resilience in the face of trade war headlines. The market dips sharply when tariffs are announced, and then surges back up as the news cycle turns, with Trump pausing or reversing his decisions.
We’ve seen multiple examples of this year-to-date on the AMEX:SPY chart:
🔹 Trump Pauses Tariffs for Canada & Mexico – market bounces.
🔹 Trump Pauses Most Liberation Day Tariffs – another bounce.
🔹 Trump Floats Lowering Tariffs on China – bounce continues.
🔹 Trump Pushes Back EU Tariffs to July – market rips higher.
It’s as if every tariff tantrum is followed by an inevitable rebound. Could this be the pattern to trade around for the next few months?
At this point, it almost feels like we’re watching a predictable movie. Every new threat to impose tariffs or spark a trade war is just a scene in the “TACO” storyline, and the markets are starting to get used to the plot twist.
Are we playing into an endless loop of fear and relief? Is this time different, or just the same old TACO? How much longer can we trust that the market will “chicken out” and bounce back every time tariffs are floated?

DR COPPER vs GOLD as a Safe HavenAn enlightening ratio provides additional proof that 2026 is set to be a remarkable year of economic growth, propelling us into the upcoming peak of the #AI cycle.
A key indicator of the AI peak is the initial public offering (IPO) of Open AI on the stock market. This is a definitive signal to capitalise and harvest as much economic energy as possible during the euphoric frenzy, and establish Open AI as a new Tech Titan for the next decade.

US500 - Will the stock market reach ATH?!The index is above the EMA200 and EMA50 on the four-hour timeframe and is trading in its ascending channel. I expect the index to continue moving, and on the other hand, if the index declines towards a certain zone, you can also look for the next S&P long positions with a risk-reward ratio.
Yesterday, a U.S. federal court halted the implementation of President Trump’s “Freedom Day” tariffs. The U.S. Court of International Trade ruled that these tariffs exceeded the legal authority granted to the president and unanimously decided to revoke them. Nonetheless, Trump still retains the right to appeal the ruling.
Following the court’s decision, President Trump promptly filed an appeal. In response, the White House issued a statement asserting, “The decision on how to handle a national emergency should not fall into the hands of unelected judges.”
Meanwhile, the market reacted strongly to Nvidia’s latest financial report. The company’s stock surged by as much as 5.8% in after-hours trading, before settling at a 4.8% gain compared to the previous day.
This bullish movement reflects investors’ confidence in Nvidia’s continued strong performance.
Nvidia is actively expanding into new markets, including the Middle East—an indication that the company is poised for sustained growth even if its presence in China is constrained.
The rally in Nvidia’s stock didn’t just lift semiconductor companies; broader markets followed suit. The S&P 500 index climbed to 6,005.75 points, representing a 1.7% increase from the prior session.
According to the company’s announcement, Nvidia posted $44.1 billion in revenue for the first quarter of fiscal year 2026, marking a 69% increase year-over-year and slightly surpassing analysts’ expectations. Revenue from data center operations rose 73% to reach $39.1 billion.
CEO Jensen Huang stated: “Our Blackwell NVL72 AI supercomputer—designed for reasoning and acting as a ‘thinking machine’—is now being mass-produced by system builders and cloud service providers.” He added, “There is enormous global demand for Nvidia’s AI infrastructure. Over the past year alone, AI inference token generation has grown tenfold. As AI agents become mainstream, the demand for AI compute will continue to surge.”
A Reuters poll now projects that the S&P 500 will reach 5,900 by the end of 2025—down from the 6,500 level forecast in February. Similarly, the Dow Jones index is expected to close 2025 at 43,708, compared to the previous projection of 47,024 from the February survey.
Separately, the Federal Deposit Insurance Corporation (FDIC) reported that the increase in U.S. bank profits was largely driven by growth in noninterest income. Bank earnings in the first quarter of 2025 rose by 5.8%, reaching $70.6 billion. While overall asset quality remains favorable, the commercial real estate loan portfolios continue to show signs of weakness. The number of “problem banks” declined by three, bringing the total down to 63. The banking industry also reported a slowdown in lending growth; the annual loan growth rate for the first quarter was just 3%, down from the pre-pandemic average of 4.9%.


Australian inflation higher than expected, Aussie extends lossesThe Australian dollar has extended its losses on Wednesday. AUD/USD is trading at 0.6415 in the North American session, down 0.44% on the day.
Australia's inflation rate remained unchanged in April at 2.4% y/y for a third straight month, matching the lowest rate since Nov. 2024. The reading was slightly higher than the market estimate of 2.3% but remained within the central bank's inflation target of 2%-3%. Trimmed mean inflation, the central bank's preferred indicator for underlying inflation, edged up to 2.8% from 2.7% in March.
The inflation report was mildly disappointing in that inflation was hotter than expected. Underlying inflation has proven to be persistent which could see the Reserve Bank of Australia delay any rate cuts.
The markets have responded by lowering the probability of a rate cut in July to 62%, compared to 78% a day ago, according to the ASX RBA rate tracker. A key factor in the July decision will be the second-quarter inflation report in late July, ahead of the August meeting.
The Reserve Bank lowered rates last week by a quarter-point to 3.85%, a two-year low. The central bank left the door open to further cuts, as global trade uncertainties are expected to lower domestic growth and inflation.
The Federal Reserve releases the minutes of its May 7 meeting later today. At the meeting, the Fed stressed that it wasn't planning to lower rates anytime soon and the minutes are expected to confirm the Fed's wait-and-see stance.
US President Trump has been zig-zagging on trade policy, imposing and then cancelling tariffs on China and the European Union. Fed Chair Powell said at the May meeting that the economic uncertainty due to tariffs means that the appropriate rate path is unclear and that message could be reiterated in the Fed minutes.

Momentum builds in GBP/USD and NZD/USD following tariff delayThe U.S. dollar weakened sharply in recent sessions as President Trump's announcement that the proposed 50% tariffs on EU imports will now be delayed until July 9, giving markets temporary relief.
GBP/USD edged toward 1.3600, testing levels last seen three years ago. The RSI sits just under 60, suggesting there’s still room before overbought conditions are reached. Volume has been gradually increasing, potentially reinforcing the strength of the breakout.
Risk-on flows also lifted the Australian and New Zealand dollars. NZD/USD has broken above the Ichimoku cloud and rose 0.62% on the day. Price is well above the Tenkan-sen (blue) and Kijun-sen (red), indicating strong upward momentum. However, the pair is pulling back slightly after the sharp breakout, suggesting short-term consolidation.

X Swing Options Trade Plan 2025-05-23X Swing Analysis Summary (2025-05-23)
Model Summaries • Grok/xAI Report – Strongly bullish across 15-min, daily, and weekly timeframes; price above all key EMAs. – RSI overbought (15-min 76.7, daily 81.3, weekly 71.7) and touching upper Bollinger Bands but MACD remains positive. – Positive news catalyst (U.S. Steel/Nippon partnership) and call OI at $55 suggests further upside. – Recommends buying the $55 call (expiry 2025-06-06) at $0.22, 50% profit target to $0.33, stop-loss at $0.11, 80% confidence.
• Claude/Anthropic Report – Technicals severely overbought; short-term pullback likely despite fundamental news. – Max pain at $45.50 vs current $53.22 signals mean reversion. – Recommends buying puts, ideally $50 strike, targeting reversion to max pain, 75% confidence.
• Llama/Meta Report – Moderately bullish: price well above EMAs, bullish MACD, but overbought RSI/Bollinger Bands and max pain counter-signal. – Recommends buying the $55 call at $0.22, profit target $0.50, stop-loss $0.10, hold up to 10 days, 75% confidence.
• DeepSeek Report – Strongly bullish: parabolic move, high-volume news catalyst, price above upper bands. – Recommends buying the $55 call (expiry 6/06) at $0.22, target 100–150% gain ($0.44–$0.55), stop if price closes below $51.97, 80% confidence.
• Gemini/Google Report – Moderately bullish: powerful news and momentum outweigh overbought signals in the near term. – Recommends buying the $55 call at market open, entry $0.22–$0.25, profit target $0.44/$0.66, stop-loss $0.11, 70% confidence.
Agreements and Disagreements • Agreement: Four of five models favor buying the $55 call for a near-term swing. • Disagreement: Claude advocates a bearish put play ($50 strike) due to extreme overbought conditions and max pain. • Risk view: All acknowledge overbought RSI/Band readings; only Claude sees near-term downside.
Conclusion • Overall Market Direction Consensus: Moderately to strongly bullish in the very short term, driven by a major news catalyst and sustained momentum. • Recommended Trade: Buy a single-leg, naked $55 call option expiring 2025-06-06. • Strategy: Naked call purchase. • Expiration: 2025-06-06 (swing‐trade timeframe). • Premium: $0.22 per contract. • Entry Timing: Enter at market open. • Confidence Level: 75% • Key Risks and Considerations: – Severely overbought RSI and price trading above upper Bollinger Bands—risk of pullback. – Elevated VIX and max pain at $45.50 exert downside pressure over the next two weeks. – Low absolute premium and liquidity—wide bid/ask spread potential. – News-driven volatility could reverse if there’s profit-taking or adverse headlines.
TRADE_DETAILS (JSON Format)
{ "instrument": "X", "direction": "call", "strike": 55.0, "expiry": "2025-06-06", "confidence": 0.75, "profit_target": 0.44, "stop_loss": 0.11, "size": 1, "entry_price": 0.22, "entry_timing": "open", "signal_publish_time": "2025-05-23 15:51:18 UTC-04:00" } 📊 TRADE DETAILS 📊 🎯 Instrument: X 🔀 Direction: CALL (LONG) 🎯 Strike: 55.00 💵 Entry Price: 0.22 🎯 Profit Target: 0.44 🛑 Stop Loss: 0.11 📅 Expiry: 2025-06-06 📏 Size: 1 📈 Confidence: 75% ⏰ Entry Timing: open 🕒 Signal Time: 2025-05-23 15:51:33 EDT
Disclaimer: This newsletter is not trading or investment advice but for general informational purposes only. This newsletter represents my personal opinions based on proprietary research which I am sharing publicly as my personal blog. Futures, stocks, and options trading of any kind involves a lot of risk. No guarantee of any profit whatsoever is made. In fact, you may lose everything you have. So be very careful. I guarantee no profit whatsoever, You assume the entire cost and risk of any trading or investing activities you choose to undertake. You are solely responsible for making your own investment decisions. Owners/authors of this newsletter, its representatives, its principals, its moderators, and its members, are NOT registered as securities broker-dealers or investment advisors either with the U.S. Securities and Exchange Commission, CFTC, or with any other securities/regulatory authority. Consult with a registered investment advisor, broker-dealer, and/or financial advisor. By reading and using this newsletter or any of my publications, you are agreeing to these terms. Any screenshots used here are courtesy of TradingView. I am just an end user with no affiliations with them. Information and quotes shared in this blog can be 100% wrong. Markets are risky and can go to 0 at any time. Furthermore, you will not share or copy any content in this blog as it is the authors' IP. By reading this blog, you accept these terms of conditions and acknowledge I am sharing this blog as my personal trading journal, nothing more.

Gold H4 Technical update and key levels bulls/bears📊 Technical Outlook Update H4
🏆 Bull Market Overview
▪️stuck in range for now
▪️overhead resistances will limit upside
▪️Bears key S/R: 3410/3460 USD
▪️Bulls key S/R: 3160/3240 USD
▪️Expect range price action
▪️Focus on selling high / buying low
▪️volatility likely to remain low
▪️next few weeks as no major headlines
⭐️Recommended strategy
▪️short high and buy low
▪️detailed price levels above
▪️right now no trade recommended
Latest gold market updates:
📈 Gold surges as renewed tariff threats and geopolitical tensions drive safe-haven demand.
💳 Fiscal concerns escalate after the U.S. credit rating is downgraded, increasing investor interest in gold.
📊 Analysts identify $3,300 as a crucial support level, with strong buying interest keeping prices elevated.
🔮 Major banks project gold to surpass $4,000 per ounce within the next year, citing robust demand from both investors and central banks.
💍 Record gold prices prompt jewelry designers to shift toward 14-karat gold and alternative materials to control costs.
📉 Gold jewelry demand in India continues to decline due to high prices, while investment gold purchases rise.
🌍 Central banks, especially in emerging markets, sustain gold purchases to hedge against currency volatility and inflation.
🛡 Gold maintains key support above $3,200 despite market volatility and profit-taking pressures.
📈 Leading investment banks remain bullish, forecasting significant upside for gold through year-end.
💰 Gold is currently trading near $3,358 per ounce, reflecting ongoing volatility and global economic uncertainty.

$ETH - Ethereum enters buy zoneHey traders!
How is your portfolio doing? Trump is shaking us!
After all these months in 2025 I've tried to project a new scenario (bullish/bearish) that clarifies our next outlook.
Not an easy job. As you see day by day, markets are in high volatility due to trade war and (not trying to be pesimistic) could be worse.
However, In my opinion Ethereum (and altcoin markets) are entering into a golden opportunity. that has to be taken 100%. Don't know where is the bottom for CRYPTOCAP:ETH on a short scenario. But, what I can certainly say is that won't fall as a stone for too long.
Ranges between 1400 - 2000 USD are gold prices to make progressives buys. Although it could fall even more ( 900 - 1200 USD) I think this is a high Risk reward buy.
But, timing is not on time. Shouldn't I sell, expecting a bear market( you know Halving and Posthalving ideas). Times have changed as the macro scenario has not been the same as the previous bullruns.
So, it's time to accumulate and expect a possible expansion cycle in 2026.. That could lead Ethereum to prices never seen before. Yes, the range between 8.000 - 15.000 USD.
As I always say. Just my opinion. Stay safe!

Bitcoin - Will Bitcoin Continue to Rise?!Bitcoin is above the EMA50 and EMA200 on the four-hour timeframe and is in its medium-term ascending channel. A break of the drawn trend line will lead to a decline in Bitcoin. If Bitcoin moves downwards towards the specified demand zone, we can look for its next buying opportunities. Maintaining the drawn trend line will lead to its reaching $120,000.
It should be noted that there is a possibility of heavy fluctuations and shadows due to the movement of whales in the market and compliance with capital management in the cryptocurrency market will be more important. If the downward trend continues, we can buy within the demand range.
Over the past 200 days, since Trump’s electoral victory, investment funds (ETFs) and major corporations have collectively purchased and withdrawn approximately 607,000 bitcoins from the market.
▪️ Around 200,000 bitcoins were acquired by ETFs.
▪️ MicroStrategy alone accumulated nearly 300,000 bitcoins.
▪️ The remaining 100,000 bitcoins were bought by other companies.
This substantial level of acquisition has removed a significant portion of bitcoin from circulation, creating what is known as a “supply shock”—a situation where the reduced availability of bitcoin could drive prices higher due to scarcity.
On February 6, 2025, Eric Trump declared that it was an opportune time to invest in bitcoin. Shortly after this statement, the price of bitcoin dropped by about 25%. However, the market soon shifted momentum, and bitcoin entered a strong upward trend. On May 22, Trump tweeted again, stating: “Hope you listened… This is just the beginning!”
Meanwhile, U.S. Vice President JD Vance is scheduled to speak at the Bitcoin 2025 Conference, set to take place on May 28 in Las Vegas.Earlier in March, President Trump signed an executive order establishing a “Strategic Bitcoin Reserve” and a “U.S. Digital Asset Reserve,” solidifying the government’s new, supportive stance toward cryptocurrencies.
The Vice President’s upcoming participation in this event underscores the seriousness of the administration’s digital asset policy and reinforces the likelihood that digital assets will gain a more formal and structured role within the U.S. financial and strategic reserve systems.
Jurrien Timmer, Chief Economist at Fidelity, believes that bitcoin surpassing the $100,000 mark signals its growing alignment with gold as a store-of-value asset. He suggests a 4-to-1 ratio of gold to bitcoin in a value-preservation investment portfolio.
Although bitcoin had a sluggish start in 2025, capital inflows into bitcoin ETFs have resumed—especially as macroeconomic conditions have begun to improve. While gold has posted gains of around 30% so far this year, bitcoin hasn’t matched that performance yet. Nonetheless, analysts continue to project significantly higher price targets for bitcoin within this same year.
Meanwhile, the crypto exchange Kraken announced that it will soon launch tokenized stock offerings for Apple, Tesla, and Nvidia. These tokenized stocks will be available for trading by users outside of the United States.
Importantly, these assets will be tradable 24/7—much like cryptocurrencies—which marks a major departure from the traditional trading hours of Wall Street. Kraken confirmed that the feature will roll out in the coming weeks, initially targeting regions such as Europe, Latin America, Africa, and Asia.

Big bill, big debt, bullish goldGold recently broke above a descending trendline and reclaimed the 0.382 Fibonacci level at $3,333.05. The bullish momentum now faces resistance near the 0.618 retracement at $3,366.29 and the $3,389.94 zone (0.786). A clean breakout could open the way toward the $3,440–$3,507 area, aligning with the 1.0 and 1.618 Fib extensions.
The rally follows rising trade tensions, as President Trump announced 50% tariffs on EU imports from June 1st and threatened Apple with 25% tariffs unless it relocates iPhone production to the U.S.
Further fuel for gold comes from the proposed ‘One Big Beautiful Bill Act,’ which includes major tax cuts and spending reforms. Expected to add $3–5 billion to U.S. debt, the bill passed the House and now moves to the Senate.

Weekly Analysis for BTC (May 26–30)BTC played out clean last week. Broke above 108k, tapped a new ATH at 110.5k, and pulled back slightly. Structure still bullish — 4H HLs holding strong and 107k retest held nicely into weekend close.
Key level to watch is 110k. If we break that with momentum, price can push to 115k or even 120.7k based on fibs and hype continuation. If we reject again, we might pull back to 107k or 100k — still a buy zone unless 88k breaks.
On the macro side, confluence is heavy:
– ETFs still driving big money inflow
– US debt growing after Trump’s new tax bill
– Moody’s downgrade adds more pressure
– Geopolitical tensions + safe-haven flow also helping BTC hold strength
– Holiday week in the US (Memorial Day), so volume might be low — fakeouts possible if liquidity dries up
Best zones to watch this week:
🔸 110k breakout for continuation
🔸 107k and 100k pullback buys
🔸 110.5k ATH for possible rejection scalps
As long as 88k holds, structure is clean. Bias remains bullish with both TA and macro pointing up.
Will be posting more detial daily anaylsis. follow for more updates. Or check out Streefree_trade IG.
