Trump token bullishKey Levels: The main resistance is at 10.40 dollars , and the main support is at 7.71 dollars . The descending trendline keeps the price below it, and the 200-period moving average above the price confirms the bearish trend .
Closer Zones: A nearby resistance is observed at 8.06 dollars, overlapping with the trendline. The closer support is at 7.71 dollars. A break above 8.06 dollars could push the price toward 9.60 dollars .
Intermediate Level: On the way up, the 8.25 dollars level acts as an intermediate resistance.
Target: Based on the previous move of 2.50 dollars, the potential upside target is around 9.60 dollars .
Conclusion: A breakout above the nearby resistance could signal a weakening bearish trend and the start of an upward move .
Trumptrade

TRUMP price analysis✊ At the end of March, we last wrote about #Trump and “looked like water” predicting a price drop to $7-7.20 if the “great and brilliant leader” did not stop doing stupid things.... but then came the April sanctions...
We can comment and discuss it for a long time, but it's no use - you can't get the rust out of the metal or out of your head...
It was interesting on 19.04 - when a large unlock of 40 million #Trump coins took place and participants expected the price dump to continue.... but no...
and already on 23.04 - the news comes out that #Trump will have dinner with the largest holders of his token and, oh, miracle = 75% of the OKX:TRUMPUSDT price pump
There are already jokes on Twitter that the TOP-5 holders will be able to choose to who will be the next to set or remove abnormal taxes during dinner)
But seriously, there is every chance that the #TRUMUSDC price pump will continue and God grant us patience to keep and hold this small amount of #Trump coins to $24-$32 or maybe to $40...
_____________________
Did you like our analysis? Leave a comment, like, and follow to get more

TRUMP - Dead cat bounce?TRUMP looks like a typical dead cat bounce, acquiring major short squeeze getting bonked and probably a dead cat bounce. Plan at 18.21

Tears of Liberty. Lets Make America Sell Again.Over the past decade, the U.S. stock market has significantly outperformed global stock markets excluding the United States. This divergence in returns has been one of the defining features of global investing since 2015, with U.S. equities—especially large-cap technology stocks—driving much of the outperformance.
Annualized Returns (2015–2025)
AMEX:SPY , S&P 500 Index(U.S.):
The S&P 500 delivered an average annualized return of 13.8% over the past ten years.
NASDAQ:ACWX , MSCI All World ex U.S. (Rest of World):
Global stocks outside the U.S. returned an average of 4.9% annually over the same period
Year-by-Year Breakdown
Year | SPX | World ex U.S. | U.S. Surplus
2024 23.9% 4.7% +19.2%
2023 23.8% 17.9% +5.8%
2022 -19.6% -14.3% -5.4% (!)
2021 26.6% 12.6% +14.0%
2020 15.8% 7.6% +8.2%
2019 30.4% 22.5% +7.9%
2018 -6.6% -14.1% +7.5%
2017 18.7% 24.2% -5.5% (!)
2016 9.8% 2.7% +7.1%
2015 -0.7% -3.0% +2.3%
Key Drivers of Performance
U.S. Outperformance
The U.S. market’s dominance was driven largely by the rapid growth of technology giants (such as Apple, Microsoft, Amazon, and Alphabet), which benefited from strong earnings growth, global market reach, and significant investor inflows.
International Underperformance
Non-U.S. markets faced headwinds such as multiply choking sanctions and tariffs, slower economic growth, political uncertainty (notably in Europe), a stronger U.S. dollar, and less exposure to high-growth technology sectors.
Valuation Gap
By 2025, U.S. stocks are considered relatively expensive compared to their international counterparts, which may offer more attractive valuations going forward.
Recent Shifts (2025 Trend):
As of early 2025, international stocks have started to outperform the S&P 500, with European and Asian equities seeing renewed investor interest. Factors include optimism over economic recovery in China and strong performance in European defense and technology sectors.
Long-Term Perspective
Historical Context
While the past decade favored U.S. equities, this has not always been the case. For example, during the 2000s, international stocks outperformed the U.S. following the dot-com bust.
Market Weight
The U.S. accounts for roughly 60% of global stock market capitalization and about 25% of global GDP, so its performance has a substantial impact on global indices.
Conclusion
From 2015 to 2025, the U.S. stock market delivered nearly triple the annualized returns of global markets excluding the U.S., primarily due to the outperformance of large-cap technology stocks.
While this trend has persisted for most of the decade, early 2025 shows signs of a potential shift, with international equities beginning to close the performance gap. Investors should remain aware of valuation differences and the cyclical nature of global market leadership.
The main technical chart for U.S./ ex U.S. ratio indicates the epic reversal is in progress.

TRUMPUSDT 12HTRUMP ~ 12H Analysis
#TRUMP Buy gradually from here with a short -term target of at least 10%+ from here. We think this will be an area of whale accumulation

GBPUSD SHORT FORECAST Q2 W16 D18 Y25GBPUSD SHORT FORECAST Q2 W16 D18 Y25
Fun Coupon Friday!
Summary
- Weekly order block short set up
- Awaiting clear shift in price action to downside
- C setup - Short from 5' order block with confluence of daily high wick fill prior turn over in price.
- B Setup - 15' break of structure anticipating 15' creation order block creation. Solid point of interest to short from
A Setup - Multiple 15' break of structure plus all of the above
FRGNT X

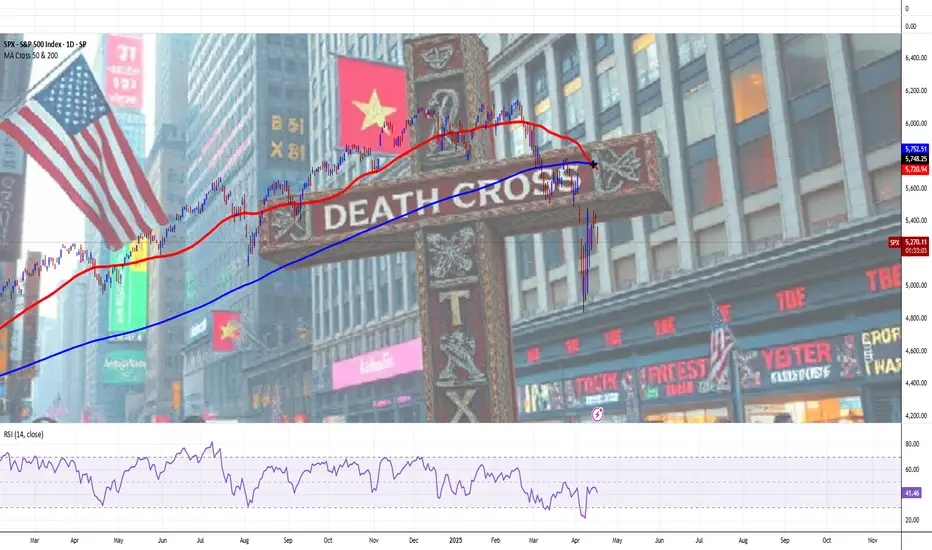
S&P 500 Index Goes 'Death Crossed' Again, Due To Unruly EconomyThe "Death Cross" is a technical chart pattern signaling potential bearish momentum in the US stock market, occurring when a short-term moving average (typically the 50-day) crosses below a long-term moving average (usually the 200-day).
Despite its foreboding name, historical data shows its implications are often less dire than perceived, serving as a coincident indicator of market weakness rather than a definitive predictor of collapse.
Historical Examples and Market Impact
The death cross gained notoriety for preceding major market downturns:
2000 Dot-Com Bubble: The Nasdaq Composite’s death cross in June 2000 coincided with the burst of the tech bubble, leading to a prolonged bear market.
2008 Financial Crisis: The S&P 500’s death cross in December 2007 foreshadowed the 2008 crash, with the index losing over 50% of its value by early 2009.
2020 COVID-19 Crash: The S&P 500, Dow Jones, and Nasdaq 100 all formed death crosses in March 2020 amid pandemic-driven panic, though markets rebounded sharply within months.
2022 Ukraine's War Crisis: The S&P 500, Dow Jones, and Nasdaq 100 all formed death crosses in March 2022 due to proinflationary surge on Ukraine's war and Arab-Israel conflict, leading to a prolonged bear market within next twelve months, up to March quarter in the year 2023.
These examples highlight the pattern’s association with extreme volatility, but its predictive power is inconsistent. For instance, the 2022 death cross in the S&P 500—its first in two years—occurred amid Fed rate hikes and geopolitical tensions, yet the market stabilized within weeks rather than entering a prolonged downturn.
Perspectives on Reliability and Use Cases
While the death cross reflects deteriorating short-term momentum, its utility depends on context:
Lagging Nature: As a lagging indicator, it confirms existing trends rather than forecasting new ones. The 50-day average crossing below the 200-day often occurs after prices have already declined.
False Signals: Post-2020 data shows the S&P 500 gained an average of 6.3% one year after a death cross, with Nasdaq Composite returns doubling typical averages six months post-cross.
Combined Analysis: Traders pair it with metrics like trading volume or MACD (Moving Average Convergence Divergence) to validate signals. Higher selling volume during a death cross strengthens its bearish case.
Strategic Implications for Investors
For market participants, the death cross serves as a cautionary tool rather than a standalone sell signal:
Short-Term Traders: May use it to hedge long positions or initiate short bets, particularly if corroborated by weakening fundamentals.
Long-Term Investors: Often treat it as a reminder to reassess portfolio diversification, especially during elevated valuations or macroeconomic uncertainty.
Contrarian Opportunities: Historical rebounds post-death cross—such as the 7.2% Nasdaq gain three months after the signal—suggest potential buying opportunities for risk-tolerant investors.
Fundamental Challenge
Stocks Extend Drop as Powell Sees Economy ‘Moving Away’ From Fed Goals
Powell sees economy ‘moving away’ from job, price goals due to Trump's tariff chainsaw.
Fed well positioned to wait for policy clarity. Strong jobs market depends on price stability, he adds.
Stocks extend declines, bonds rally as Fed chair speaks.
Conclusion
The "Death Cross" remains a contentious yet widely monitored pattern. Its dramatic name and association with past crises amplify its psychological impact, but empirical evidence underscores its role as one of many tools in technical analysis. Investors who contextualize it with broader market data—such as earnings trends, interest rates, and macroeconomic indicators—are better positioned to navigate its signals.
While it may foreshadow turbulence, its historical track record emphasizes resilience, with markets often recovering losses within months of the pattern’s appearance.
--
Best wishes,
Your Beloved @PandorraResearch Team 😎
// Think Big. Risk Less
USDJPY LONG FORECAST Q2 W16 D16 Y25USDJPY LONG FORECAST Q2 W16 D16 Y25
Good morning all.
It may look like we are holding onto a bias. I can understand why that assumption is created. However, a short position is invalid for FRGNT whilst in a higher time frame order block long.
As per, that does not mean LONG blindly.
Two set ups illustrated.
1) 15' Break of structure
2) Lower time frame Break of structure without 15' break.
Trading is risky.
Both positions of course come with a side dish of risk and reason to loose. The question is, would you like to see USDJPY explode long without you?
Lets see how price actions plays.
FRGNT X

DJT Weekly Options Trade Plan 2025-04-15NASDAQ:DJT DJT Weekly Analysis Summary (2025-04-15)
Below is a consolidated analysis based on the four reports:
─────────────────────────────
SUMMARY OF EACH MODEL’S KEY POINTS
• Grok/xAI Report:
– Notes that DJT is trading near its 10‐period EMAs on both the 5‑minute and daily charts.
– Indicates a moderately bullish short‐term outlook (helped by positive news about “Truth Social” investment accounts) even though the max pain is at $19.00.
– Recommends a call option trade (buy naked call) at or near the $20.00 strike with an acceptable premium (~$0.63).
• Claude/Anthropic Report:
– The report encountered an error and produced no usable analysis.
• Llama/Meta Report:
– Observes that while the 5‑minute chart shows short‐term bullishness (with price above key EMAs), the overall daily picture and max pain theory (targeting $19.00) point toward a slightly bearish bias.
– Suggests trading a put (such as buying the $19.50 put) but notes factors like high daily volatility and mixed indicators.
• Gemini/Google Report:
– Provides a nuanced view where the 5‑minute charts show consolidation near $20 while the daily chart’s indicators (RSI, MACD histogram, bullish postive news) favor a moderately bullish move.
– Highlights key liquidity around the $20 strikes and ultimately favors a call trade—leaning toward a slightly out‑of‑the‐money option ($20.50 call) but noting that trade risk should be managed tightly.
• DeepSeek Report:
– Summarizes the technical picture with DJT trading above short‐term moving averages but acknowledges max pain at $19.00.
– With a positive news catalyst and falling volatility (VIX), it leans moderately bullish and recommends a call purchase at the $20.00 strike.
─────────────────────────────
AREAS OF AGREEMENT AND DISAGREEMENT
• Agreement:
– All models note a current price of roughly $19.96 with technical support around the short‐term (near the 10‑period EMA).
– Ea
ch analysis recognizes key levels: immediate support near $19.85–$19.94 and resistance around $20.00–$20.50.
– Most models see positive momentum from favorable news (Truth Social catalyst) and improving short‑term indicators.
– Options-chain details (high OI and volume at the $20 strikes) underline the importance of that level.
• Disagreement:
– Llama/Meta tilts toward a bearish reading (using daily MACD and max pain theory, expecting a move toward $19.00) and suggests puts rather than calls.
– Strike selection differs slightly—with some reports favoring the ATM $20.00 call (Grok/xAI and DeepSeek) and others suggesting a slightly OTM $20.50 call (Gemini/Google).
─────────────────────────────
CONCLUSION AND RECOMMENDATION
Overall Market Direction Consensus:
The majority of analyses (three out of four usable models) lean moderately bullish on DJT in the near term. Positive technical momentum on the daily charts together with supportive news outweigh the bearish hints (like max pain and Llama/Meta’s view).
Recommended Trade:
– Trade Type: Buy single‑leg, naked call
– Chosen Strike: $20.00 call (weekly option)
– Expiration: 2025‑04‑17
– Entry: At open with an entry price near the ask of $0.63 per contract
– Risk/Reward Targets:
• Profit Target: Approximately a 20% premium gain (rising from $0.63 to about $0.76)
• Stop‑Loss: About 50% loss of the premium (around $0.32)
– Confidence Level: About 70% (reflecting the bullish bias driven by news and short‑term technicals, while remaining cautious of the max pain level)
Key Risks & Considerations:
– The max pain at $19.00 may exert downward pressure as expiration nears.
– Short‑term volatility remains high (VIX at 30.12), so the trade will need tight risk management.
– Should DJT fail to break above immediate resistance or show signs of a sharp reversal (e.g. dropping below $19.85), consider exiting early to protect capital.
─────────────────────────────
TRADE_DETAILS (JSON Format)
{
"instrument": "DJT",
"direction": "call",
"strike": 20.00,
"expiry": "2025-04-17",
"confidence": 0.70,
"profit_target": 0.76,
"stop_loss": 0.32,
"size": 1,
"entry_price": 0.63,
"entry_timing": "open"
}

Nasdaq 100 Opens with Bullish GapTrump Exempts Electronics from Tariffs; Nasdaq 100 Opens with Bullish Gap
Despite the weekend, the news flow remained intense amid the escalating trade war. According to media reports:
→ Certain tech products, including those made by Apple, have been exempted from Trump’s tariffs.
→ Trump announced he would make a significant statement regarding semiconductor tariffs on Monday, 14 April.
Stock Indices React to Trump’s Tariff Moves
These announcements were taken positively by the markets. As shown on the chart of the Nasdaq 100 index (US Tech 100 mini on FXOpen), the new week opened with a bullish gap exceeding 1.5% – a stronger performance than the S&P 500 (US SPX 500 mini on FXOpen), which also saw a bullish gap.
This may suggest that market participants are cautiously optimistic that the sweeping tariff measures might be eased through exemptions, delays, or negotiation concessions. Nevertheless, the CNN Business Fear & Greed Index remains in "extreme fear" territory, despite inching higher compared to last week.
As of this morning, the Nasdaq 100 (US Tech 100 mini on FXOpen) has recovered approximately 15% from its 2025 low.
Technical Analysis: Nasdaq 100 (US Tech 100 mini on FXOpen)
Seven days ago, we plotted an ascending blue channel and suggested that its lower boundary could act as support – which has indeed played out.
With the latest data in hand, there is reason to believe that bulls may now be aiming to push the price up toward the channel’s median line. However, as indicated by the arrows on the chart, this median appears to have shifted from acting as support to acting as resistance.
Bulls may also face headwinds from the wide bearish candle to the left, which was formed in reaction to Trump's tariff announcements. According to Smart Money Concept methodology, this area – marked by a bearish Fair Value Gap (highlighted with a rectangle) – may now serve as resistance.
This article represents the opinion of the Companies operating under the FXOpen brand only. It is not to be construed as an offer, solicitation, or recommendation with respect to products and services provided by the Companies operating under the FXOpen brand, nor is it to be considered financial advice.

USDJPY LONG FORECAST Q2 W16 D14 Y25USDJPY LONG FORECAST Q2 W16 D14 Y25
We caught a the long play for a similar setup. We need more this time around.
Why? To be sure of the weekly order block rejection. Compared to EURUSD and EURGBP for example... That is the type of weekly order block rejection we prefer. With that said we will not give up on USDJPY. We simply must await more levels of confluences.
15' break of structure, Order block creation as a result of the BOS. Pull back into area, lower time frame break of structure.
Let's see what USDJPY provides us with.
FRGNT X

BTC 97K Long Target Inverse Head and ShouldersTHIS BLUE NECKLINE IS 100% THE LINE TO FOLLOW
Inverse Head And Shoulders
Active Long Target - 97,050
What To Expect?
Trump's tweets are highly volatility just like the markets so rather then trying to call the exact bottom use this for your bull / bear transition. I'm not saying when it will happen... but above the blue line bullish, below it flip bearish despite it would take a number in the 60Ks to invalidate this target.
Downside seems to be the orange support line in 73.8... but money is on 97K sooner than later and this chart staying valid.

Trump's Second Term Brings Sharpest Market Decline Since 2001It's gone nearly three months or so... (Duh..? WTF.. less than 3 months, really? 🙀) since Donald Trump entered The White House (again).
Those times everyone was on a rush, chatting endless "Blah-Blah-Blah", "I-crypto-czar", "crypto-capital-of-the-world", "we-robot", "mambo-jumbo", "super-duper", AI, VR and so on super hyped bullsh#t.
What's happened next? We all know.. mostly all US stocks and crypto markets turned to 'a Bearish Mode', or to at least to 'a Correction' (that is still actual at this time).
Here's a short educational breakdown for Nasdaq Composite index NASDAQ:IXIC what we think about all of that, at our beloved 💖 @PandorraResearch Team.
Trump's Second Term Brings Sharpest Market Decline Since 2001: Analyzing the recent 15% Stock Market Plunge
President Donald Trump's second term has coincided with a dramatic stock market downturn, with the S&P 500 losing approximately 15% of its value since his January 2025 inauguration. This represents the worst start to a presidential term since George W. Bush in 2001 during the dot-com crash. The decline has erased more than $3 trillion in market value, driven primarily by concerns over trade policies, particularly the implementation of new tariffs.
Market analysts point to growing fears of potential stagflation—a toxic combination of slow economic growth and high inflation—as investor confidence continues to deteriorate despite pre-election expectations of business-friendly policies.
Unprecedented Market Decline Under the New Administration
Historical Context of Presidential Market Performance
The current market downturn stands out in stark relief when compared to previous presidential transitions. The S&P 500 has fallen nearly 10% in the first 10 weeks since Trump's inauguration on January 20, 2025, marking the worst start under a new president since George W. Bush in 2001. This decline is significantly worse than the start of the prior five administrations, with Bush's roughly 18% drop during the dot-com crash being the only steeper decline in recent presidential history. Looking further back, only Richard Nixon experienced a comparable early-term market decline with a 7.2% drop, highlighting the severity of the current situation.
When examining presidential market performance metrics, Trump's second term has already distinguished itself negatively. During the first 50 days, the S&P 500 declined by 6.4%, positioning it among the poorest market starts since 1950. By contrast, the best 50-day starts were achieved by John F. Kennedy (up 9.4%), Barack Obama (up 5.7%), and Bill Clinton (up 4.2%), demonstrating how unusual the current market trajectory is in historical context.
Magnitude of the Current Decline
The scale of market value destruction has been substantial. More than $3 trillion has been erased from the S&P 500's value over approximately 52 trading sessions since Trump's inauguration. By early April 2025, the decline had accelerated to approximately 15% from Inauguration Day, pushing the market dangerously close to bear territory. Market analysts note that if the S&P 500 reaches a 20% decline from its recent peak, it would mark the earliest instance of a bear market during a new administration based on S&P 500 history since 1957.
The tech-heavy Nasdaq Composite has suffered even more severely, with declines exceeding 11% by mid-March. This demonstrates the particular vulnerability of growth stocks that had previously led market gains, now facing the most significant corrections.
Key Factors Driving the Market Downturn
Trade Policy Uncertainty and Tariff Concerns
Trade policy, particularly the implementation and threat of tariffs, has emerged as the primary catalyst for market turmoil. The unpredictable nature of these policies has created significant uncertainty for businesses, investors, and consumers alike. Trump's "on-again, off-again approach to tariffs" has effectively extinguished the optimism that initially buoyed markets following his election victory in November 2024.
The market decline accelerated dramatically after what was termed the "Liberation Day" event, during which Trump announced plans for unprecedented tariff escalation. Two-thirds of the S&P 500's 15% decline occurred after this announcement, prompting Ed Yardeni of Yardeni Research to observe that "Liberation Day has been succeeded by Annihilation Days in the stock market".
Fear of Stagflation and Economic Instability
Many economists have warned that the new tariffs could reaccelerate inflation at a time when economic growth may be slowing, creating conditions for stagflation. This combination is particularly concerning for investors, as it creates a challenging environment for corporate profitability and economic prosperity. The risk that tariffs could trigger this economic condition has effectively neutralized investor optimism regarding other aspects of Trump's agenda, including potential regulatory reforms and tax reductions.
Shift in Market Sentiment
The market has undergone a fundamental transformation in sentiment from the period immediately following Trump's election victory to the current environment. Initially, investors had bid stocks up to record highs, anticipating benefits from tax cuts, deregulation, and business-friendly policies. However, this optimism has been replaced by growing concern about economic direction.
As one market strategist noted, "We have witnessed a significant shift in sentiment. A lot of strategies that previously worked are now failing". The S&P 500 has relinquished all gains made since Trump's November 2024 election victory, representing a striking reversal in market confidence.
Potential Long-Term Implications
Historical Patterns and Future Outlook
Historical analysis suggests that poor market starts during presidential transitions often foreshadow continued challenges. According to SunDial Capital Research strategist Jason Goepfert, rough starts represent a "bad omen" for stocks based on past performance patterns. His analysis indicates that markets typically show a median return of -1.9% six months after such a start, and after a year, they generally remain flat. Among similar historical instances, only four out of ten cases resulted in more gains than losses over the following year.
Administration's Response to Market Decline
Unlike during his first term, when Trump regularly referenced strong stock market performance as evidence of his administration's success, his second-term approach appears markedly different. Some market analysts have noted that "The Trump administration appears to be more accepting of the market's decline, potentially even welcoming a recession to achieve their broader objectives". This shift in attitude has further unsettled investors who previously expected the administration to prioritize market stability.
Technical challenge
The tech-heavy Nasdaq Composite index has recently soared 12% for its best day since January 2001.
But did you know what happened next in 2001? The major upside trend as well as 5-years SMA were shortly broken and market printed extra 40 percent Bearish decline.
Similar with what's happening in 2025..!? Exactly!
Conclusion
Trump's second presidential term has coincided with one of the worst stock market starts in modern American history, comparable only to George W. Bush's entry during the dot-com crash of 2001.
The approximately 15% market decline since inauguration represents a loss of trillions in market value and a complete reversal of the optimism that followed his election. Trade policy uncertainty, particularly regarding tariffs, has emerged as the primary driver of market instability, creating fears of potential stagflation and undermining business confidence.
As historical patterns suggest that poor starts often lead to continued underperformance, investors remain concerned about the market's trajectory through the remainder of 2025 and beyond.
--
Best 'a bad omen' wishes,
Your Beloved @PandorraResearch Team 😎

TRUMPHello friends
Due to the price drop, we reached a good support area where good buyers supported the price.
Now we can buy in steps and with capital management in the specified support areas and move to the specified targets.
Always buy in fear and sell in greed.
*Trade safely with us*

VIX Clips 60 as Market Volatility and Tariff UncertaintyThe VIX Clips 60 as Market Volatility and Uncertainty Surge on Tariff Announcement
The CBOE Volatility Index (VIX), often dubbed the “fear gauge,” surged past the 60 threshold this week—the highest level since August 5, 2023—as markets reacted violently to an unexpected announcement by the U.S. President regarding global tariffs. The sharp rise in the VIX, which measures market expectations of 30-day volatility, underscores the profound uncertainty now gripping investors, with the Dow Jones Industrial Average plummeting over 1,000 points and the S&P 500 entering correction territory. The trigger? A sweeping tariff policy unveiled by the administration on Liberation Day, a symbolic holiday marking a shift in economic strategy, which has sent shockwaves through global markets.
The VIX at 60: A Sign of Extreme Fear
The VIX typically hovers around 15-20 under normal conditions, reflecting moderate uncertainty. However, readings above 30 indicate heightened anxiety, and levels above 50 are rare, historically occurring during major crises like the 2008 financial collapse or the 2020 pandemic sell-off. This week’s spike to 60 marks a dramatic escalation, signaling a market gripped by fear. Analysts attribute this to the suddenness and scale of the President’s tariff announcement, which caught investors off guard after a period of relative calm.
The Liberation Day Tariff Announcement
On Liberation Day—a holiday commemorating historical freedoms—the administration announced a 25% tariff on a broad range of imports from key trading partners, including China, the EU, and others, effective immediately. The move, framed as a “national economic security initiative,” aims to curb perceived trade imbalances and protect domestic industries. However, its immediate impact has been severe:
Scope and Speed: The tariffs apply to $500 billion in goods, targeting sectors like semiconductors, automotive parts, and consumer electronics. The abrupt implementation, with no prior warning or negotiation, has left businesses scrambling to adjust supply chains.
Political Context: The announcement coincided with domestic political tensions, including debates over inflation and job creation. The White House argued the tariffs would “level the playing field” for American workers, but critics warned of retaliation and inflationary pressures.
Market Chaos: Sectors Under Siege
The tariff shockwave rippled across asset classes:
Equities: The S&P 500 fell 2+% on Monday, its worst single-day drop since March 2020. The Nasdaq, heavily weighted in tech stocks reliant on global supply chains, plunged over 5%.
Sectors: Semiconductor firms like Intel and AMD tanked, while automakers such as Ford and Tesla declined sharply.
Expert Analysis: A Volatility Tipping Point
Historical Parallels and Economic Risks
The current volatility mirrors past crises:
2008 Financial Crisis: The VIX hit 80 as Lehman Brothers collapsed, but the current crisis stems from policy, not financial contagion.
2020 Pandemic Sell-Off: The VIX spiked to 82 as lockdowns paralyzed economies, but today’s uncertainty is self-inflicted.
However, the tariff-driven uncertainty poses unique risks:
Inflation: Higher import costs could push inflation back above 4%, complicating the Fed’s rate-cut path.
Global Growth: The World Bank warns that trade wars could shave 2% off global GDP by 2025. Emerging markets, reliant on exports, face currency crises.
Looking Ahead: Can Calm Return?
Markets may stabilize if the administration signals flexibility. Potential pathways include:
Negotiations: A G20 summit in September offers a venue for de-escalation, though diplomatic progress is uncertain.
Policy Reversal: If tariffs are delayed or narrowed, the VIX could retreat. However, the President’s rhetoric suggests a hardline stance.
Corporate Adaptation: Companies might pivot to domestic suppliers, but such shifts take years, prolonging volatility.
Conclusion: A New Era of Uncertainty
The VIX at 60 marks a pivotal moment. Markets are now pricing in not just the immediate tariff impact but a broader shift toward protectionism and policy-driven instability. For investors, the path forward is fraught with uncertainty. While short-term volatility may ebb with reassurances, the long-term consequences—trade wars, inflation, and geopolitical friction—could redefine global economics for years.
With Liberation Day’s tariffs reshaping the landscape, one thing is clear: the era of low volatility is over. The question now is whether policymakers can navigate this new turbulence—or if markets will remain hostages to fear.

Trump Goes "The Peacemaker", as Crude Oil Turns Gradually LowerThe notion that crude oil prices might decrease due to an abatement of the Ukraine's war not seems to be counterintuitive, as the conflict has historically led to increased oil prices due to supply disruptions and geopolitical tensions.
There are several factors that could contribute to a decrease in oil prices if tensions were to ease.
Factors Contributing to Decreased Oil Prices:
Easing of Sanctions on Russia: If tensions between the U.S. and Ukraine were to ease, it might lead to a relaxation of sanctions on Russia, potentially allowing more Russian oil to enter the global market. This increase in supply could help reduce prices.
Market Perception of Reduced Conflict: The market might perceive a decrease in conflict as a sign of reduced risk to global oil supplies, leading to lower prices. This perception could be influenced by expectations of increased oil availability from Russia and other regions.
OPEC Production Increases: If OPEC decides to increase production, as it has recently done, this could add more oil to the market, further pressuring prices downward.
Global Economic Concerns: Economic slowdowns or concerns about global growth can reduce demand for oil, leading to lower prices. The Ukraine conflict has contributed to economic uncertainty, and its abatement might not necessarily increase demand if global economic concerns persist.
Fundamental considerations
Well, in early March 2025, oil prices fell due to a combination of factors, including tensions between the U.S. and Ukraine and OPEC's decision to gradually increase output. Brent crude fell to around $71.08 per barrel, and WTI to about $68.01 per barrel.
Impact of Sanctions: Despite sanctions not directly targeting Russian oil, they have affected its exports by limiting financing and causing some buyers to avoid Russian crude. Easing these sanctions could increase Russian oil exports, potentially lowering global prices.
Market Dynamics: The war in Ukraine initially caused oil prices to surge due to supply concerns. However, if the conflict were to abate, market dynamics could shift, leading to decreased prices as supply risks diminish and global economic factors come into play.
Post war challenge
Crude oil and gasoline prices today are moderately lower, but crude oil tends to breakthrough a long-term 3 - to - 4 years low.
Crude oil prices are under pressure as US tariff uncertainty weighs on the outlook for energy demand.
Also, ramped-up Russian oil exports boost global supplies and are negative for prices.
In addition, crude prices have some negative carryover from Wednesday when weekly EIA crude inventories rose more than expected to a 7-month high.
Conclusion
In summary, while the Ukrainian war has historically driven oil prices up due to supply disruptions and geopolitical tensions, an easing of tensions could lead to decreased prices through increased supply, reduced market risk, and global economic factors.
--
Best 'Peacemaking' wishes,
@PandorraResearch Team 😎

Using Put Options to Protect Your Stock PortfolioCME: Options on E-Mini S&P 500 Futures ( CME_MINI:ES1! )
Last week’s bloodshed of global financial market made history. Nearly all major asset classes fell into a market turmoil driven by tariffs and retaliations.
Let’s focus on the US stock market:
• Dow Jones Industrial Average dropped 7.76% in the week of March 31st to April 4th, making it the 4th worst weekly performance on record
• S&P 500 slipped 8.77%, the 4th worst week in history
• Nasdaq Composite fell 9.18%, the 2nd worst week
• Russell gave up 9.34%, the 3rd worst week
All four stock index futures were in negative territory year-to-date. On Sunday evening, E-Mini S&P 500 opened 178 points lower to 4,932, losing 17.1% YTD.
All parties ultimately come to an end. After two years of double-digit gains, the unstoppable US stock market finally cracked. As more tariffs and retaliations are expected to escalate, I am afraid that we are only seeing the beginning, rather than the end.
For stock investors, this is a good reminder of market risk, something we always talk about but seldomly pay attention to. The “return of investment” should be focusing on the repayment of your money, a safety issue. Only after that should we talk about the gain from the investment. It is a necessity to protect your portfolio to achieve long-term growth.
Trading with Options on E-Mini S&P 500 Futures
For investors with a diversified portfolio, Put Options on the E-Mini S&P 500 futures are effective and cost-efficient tools. Investors who long the stocks will lose money, should stock prices fall. Put options would gain in value, providing a hedge to the portfolio.
The following illustration shows a hypothetical example, given:
• An investor has a $250,000 portfolio holding a diversified pool of U.S. stocks
• CME E-Mini S&P 500 futures ( NYSE:ES ) have a contract size of $50 times the index value
• The June contract (ESM5) was quoting at 4,935 Sunday evening Friday, making the notional value of 1 contract $246,750, approximately equal to our portfolio value
• Assuming the portfolio moves closely in line with the S&P 500
• The investor wants to limit the loss of his portfolio to 12%. If the S&P 500 index is currently around 4950, a put option with a strike price of 4350 would roughly correspond to a 12% decline
Hedging trade illustration:
• The investor buys 1 put option on the June futures with the strike price of 4,600
• CME quote on that Put option is 223. As the contract is $50 times the index, the premium upfront for one put option contract is $11,150 (223*$50), ignoring any commissions
• The put premium is calculated as 4.46% of the $250K portfolio
If S&P drops to 4,200 (-15.15%) by the end of April:
• Without the put, the portfolio lost $37,879, assuming the same loss with the S&P
• The 4600-strike put is now 400 points in-the-money
• The investor sells the put and receives $20,000 (= 400 x 50)
• The loss of portfolio will be 37879+11150-20000 = $29,029
• With an E-mini S&P put protection to mitigate loss from the stock portfolio, the investor lost 11.6% (= 29029 / 250000), which is 3.5% lower than the S&P loss and with the preset loss limit
If S&P drops to 4,000 (-19.2%) by the end of May:
• Without the put, the portfolio lost $47,980, assuming the same loss with the S&P
• The 4850-strike put is now 600 points in-the-money
• The investor sells the put and receives $30,000 (= 600 x 50)
• The loss of portfolio will be 47980+11150-30000 = $29,130
• With an E-mini S&P put protection to mitigate loss from the stock portfolio, the investor lost 11.6% (= 29,130 / 250000)
As we can see here, when the S&P falls sharply, the investor will be able to cap his loss to 11.6%. In a “protective put” strategy, we would consider the option premium an insurance contract for owning stocks. If the index rises, the portfolio return would be lowered a little because of the premium upfront, that is, the cost of insurance. However, the protection is a lifesaver if the index falls.
Before jumping into action, the investor needs to run a correlation analysis using the daily value of the portfolio against the S&P 500 closing prices. Here is how:
• Some trading software has correlation feature built in already
• If not, pull 1-year daily portfolio balance and 1-year S&P closing prices, export them to Excel. Run correlation test with these two data series using Excel data analysis tool.
• Alternatively, we could drop the data into ChatGPT and ask AI to do the work for us.
If the correlation is greater than 50%, it means that S&P 500 is a good fit to hedge the portfolio. If it is not, we could try the correlation analysis using the other stock index closing prices, such as the Dow, the Nasdaq 100 and the Russell 2000. Then replace E-Mini S&P 500 futures with the stock index futures contract best fit the portfolio.
Happy Trading.
Disclaimers
*Trade ideas cited above are for illustration only, as an integral part of a case study to demonstrate the fundamental concepts in risk management under the market scenarios being discussed. They shall not be construed as investment recommendations or advice. Nor are they used to promote any specific products, or services.
CME Real-time Market Data help identify trading set-ups and express my market views. If you have futures in your trading portfolio, you can check out on CME Group data plans available that suit your trading needs www.tradingview.com

WILL GOLD MARK NEW ATH TRUMP TERRIF ALERT!🚨 GOLD UPDATE (XAU/USD)🚨
Gold is showing a strong bullish trend, and it’s expected to continue for the next month. 🌟 If you see any dips, buy in again and again! We could see gold touch 3200 soon, especially with the ongoing China & Trump tensions. The US economy remains strong, and fundamentally, gold is primed to soar even higher! 📈💥
After Trump's tariffs, gold may dip and sweep more liquidity before bouncing back stronger. ⚡ As China and Trump battle, US strength keeps pushing gold to new heights. 📊
Key Buying Zones 🔑:
- 3030 – 3035: Last zone for reversal 🔄
- 3000: Strong support zone 🚀
Targets 🎯:
- 3100 💰
- 3200 💎
- After 1 month: 3300 💥
⚠️ Always follow risk management⚠️

Tariff FUD is reking ports. SPY 505 First Stop. 460 Second.Trading Fam,
It's no surprise that Trump's implementation of high tariffs would cause initial FUD. This can be observed in the massive spikes on the $VIX. What is unknown and has caught many traders by surprise, myself included, is how substantial of a drop would be incurred by investor uncertainty.
Initially, it did appear that 500 might hold. That was a huge support. I knew if it broke, the sell-off would be deep. But I held hope that the market would hold above this trendline. It did not. So, yesterday and today, investors who held are incurring substantial losses.
For those who were smarter than me and sold at or near the top, congratulations! You've saved yourself some duress and cash. Now, some are calling this the beginning of a longer bear market. I still don't see it that way. Honestly (and I know this will be hard to believe), I still see the SPY hitting my target #3 at 670-700 before 2026 comes to an end. Longer-term we still remain in a massive secular bull market since 2009 and to break this long-term trend, the SPY would actually have to break below 300. That is a long way down and I just don't see that happening, though as always, I definitely could be wrong.
Shorter-term I am seeing two prominent areas of support. The first has almost been reached at 505. If I would have played this correctly, I'd be DCA'ing in my first load of cash here. The second area of support is at around 460 and slightly rising daily. This would be where I DCA'ed in another load of cash. However, if that broke, I'd exit immediately and reassess the charts. 300 is a long way down, but over the past 5 years we have seen some extraordinary market price action and volatility. TBH, even the best of us technicians are struggling to understand the larger macro-economic picture, but I'd wager to say that tariff fears may be overexaggerated as market reactions often tend to be.
One interesting note is that crypto price action no longer seems to correlate and prices have help up surprisingly well. Could this be our first indicator that the markets are due to turn up again in a few weeks/months? Unknown. But I can promise you I'll be watching this all closely.
✌️Stew

Trump Goes 'Cynosure' of All Eyes as He Walked Into '1930' RoomThe Striking Parallels Between Trump's 2025 Tariffs and the Smoot-Hawley Tariff Act of 1930
The recent trade policies under President Trump's second administration bear remarkable similarities to the controversial Smoot-Hawley Tariff Act of 1930, both in approach and potential consequences. These parallels offer important historical lessons about protectionist trade policies.
Protectionist Foundations and Scope
Both trade initiatives share fundamentally protectionist motivations aimed at shielding American industries from foreign competition. The Smoot-Hawley Act increased import duties by approximately 20% with the initial goal of protecting struggling U.S. farmers from European agricultural imports. Similarly, Trump's 2025 trade agenda explicitly aims at "backing the United States away from integration with the global economy and steering the country toward becoming more self-contained".
What began as targeted protections in both eras quickly expanded in scope. While Smoot-Hawley initially focused on agricultural protections, industry lobbyists soon demanded similar protections for their sectors. Trump's tariffs have followed a comparable pattern, beginning with specific sectors but rapidly expanding to affect a broad range of imports, with projected tariffs exceeding $1.4 trillion by April 2025—nearly four times the $380 billion imposed during his first administration.
Specific Tariff Examples
The parallel implementation approaches are notable:
Trump imposed a 25% global tariff on steel and aluminum products effective March 12, 2025
Trump raised tariffs on all Chinese imports to 20% on March 4, 2025
Trump imposed 25% tariffs on most Canadian and Mexican goods
Smoot-Hawley increased overall import duties by approximately 20%
Smoot-Hawley raised the average import tax on foreign goods to about 40% (following the Fordney-McCumber Act of 1922)
Global Retaliation and Economic Consequences
Perhaps the most striking similarity is the international backlash. The Smoot-Hawley tariffs triggered retaliatory measures from over 25 countries, dramatically reducing global trade and worsening the Great Depression. Trump's 2025 tariffs have already prompted counter-tariffs from major trading partners:
China responded with 15% tariffs on U.S. coal and liquefied natural gas, and 10% on oil and agricultural machines
Canada implemented 25% tariffs on approximately CA$30 billion of U.S. goods
The European Union announced tariffs on €4.5 billion of U.S. consumer goods and €18 billion of U.S. steel and agricultural products
Expert Opposition
Both policies faced significant opposition from economic experts. More than 1,000 economists urged President Hoover to veto the Smoot-Hawley Act.
Trump's 2025 tariffs? Reaction is coming yet...
Potential Economic Impact
The historical record suggests caution. The Smoot-Hawley Act is "now widely blamed for worsening the severity of the Great Depression in the U.S. and around the world". Trump's "more audacious intervention" similarly carries "potentially seismic consequences for jobs, prices, diplomatic relations and the global trading system".
These striking parallels between trade policies nearly a century apart demonstrate that economic nationalism and retaliatory trade cycles remain persistent challenges in international commerce, with historical lessons that remain relevant today.
Stock market Impact
Just watch the graph..
--
Best wishes,
Your Beloved @PandorraResearch Team 😎

Using Micro Soybean Futures to Finetune Trading StrategiesCBOT: Micro Soybean Futures ( CBOT_MINI:MZS1! )
Shipping industry news recently reported that 30 U.S. soybean ships (about 2 million tons) are currently heading to China, nearly half of which will arrive after April 12th, when China's 10% retaliatory tariffs on U.S. soybeans will take effect.
How big are the tariffs? Let’s say a cargo of soybeans, or 65,000 tons, is sent to China. Assuming the trade is $10 per bushel, given 36.74 bushels per ton, total cargo value is $23.88 million. Upon arriving in China, you owe a new tax bill for $2.39 million!
According to people familiar with the matter, many cargoes are for China Grain Reserves, which may be exempted from tariffs. Soybean cargoes loaded before March 12th are eligible for a one-month grace period. Data from the U.S. Department of Agriculture on March 20th showed that the stock of unsold agricultural products in China was 1.22 million tons. Any sign of order cancellation will help us assess the real impact of tariffs.
In anticipation of the tariffs, China rushes to buy U.S. soybeans in the past two months. In January and February, China bought 9.13 million metric tons of soybeans from the U.S., up 84% year-over-year. I expect the buying will vanish by the second quarter, given new crop arriving from Brazil at much lower prices without the tariffs imposed by China.
China relies heavily on imported soybeans to crush into soybean oil for cooking use and soybean meal, a key ingredient in animal feed.
The oversupply of soybeans pushes the downstream soybean meal market to crash. According to the statistics of China Feed Industry Information, soybean meals spot market prices tumbled more than 600 yuan per ton to 3,180 since February, nearly a 20% drop.
Top feed processing companies, including New Hope, Haida, and Dabeinong, have each announced price cuts ranging from 50 to 300 yuan per ton for their chicken feed and hog feed products.
With lower overall demand, and tariffs making South American soybeans more competitive, U.S. soybeans face a shrinking export market. On my March 17th commentary “Soybeans: Déjà vu all over again”, I expressed a bearish view on CBOT Soybean Futures and discussed the possibility of $8 beans.
Trading with Micro Soybean Futures
On February 24th, CME Group launched a suite of micro-size agricultural futures contracts, including Micro Corn (MZC) futures, Micro Wheat (MZW) futures, Micro Soybean (MZS) futures, Micro Soybean Meal (MZM) futures and Micro Soybean Oil (MZL) futures.
The contract size of the micro soybean futures (MZS) is 500 bushels, or just 1/10 of the benchmark standard soybean futures (ZS). The minimum margin is $200 for the front futures month, and it gets smaller further out. For instance, the margins for May, July, August, September and November are $200, $190, $180, $170, and $165, respectively.
The smaller capital requirement makes it easier for traders to express an opinion ahead of the release of a USDA report or anticipate the impact of tariffs and retaliation.
The latest CFTC Commitments of Traders report shows that, as of March 25th, CBOT soybean futures have total open interest of 853,368 contracts, up 5% in two weeks.
• Managed Money has 89,649 in long, 123,470 in short, and 139,427 in spreading
• Compared to two weeks ago, long positions were down by 12% while shorts were increased by 12%. This shows that the “Small Money” has turned bearish on soybeans
In my opinion, micro soybean futures would be a great instrument to trade market-moving events, particularly the USDA reports. I list the big reports here for your information:
• World Agricultural Supply and Demand Estimates (WASDE), monthly, April 10th
• Prospective Plantings, annually, March 31st
• Grain Stocks, quarterly, March 31st, June 30th, September 30th
• Export Sales, weekly, every Thursday
• Crop Progress, weekly during growing season, April 7th, April 14th, April 21st
• Acreage, annually, June 30th
Hypothetically, a trader expects more soybean planting in this crop year and wants to express a bearish opinion ahead of April 7th Crop Progress. He could enter a short order for May contract MZSK5 at the current market price of 1,023. If he is correct in his view and the contract price drops to 900, the short position would gain $1.23 per bushel (= 1023-900) and the total gain is $615 given the contract size at 500 bushels.
The risk of short futures is the continuous rise in soybean prices. The trader would be wise to set a stoploss at his sell order. For example, a stop loss at $11.00 would set the maximum loss to $385 (= (11.00-10.23) x 500).
To learn more about all Micro Ag futures contracts traded on CME Group platform, you can check out the following site:
www.cmegroup.com
Happy Trading.
Disclaimers
*Trade ideas cited above are for illustration only, as an integral part of a case study to demonstrate the fundamental concepts in risk management under the market scenarios being discussed. They shall not be construed as investment recommendations or advice. Nor are they used to promote any specific products, or services.
CME Real-time Market Data help identify trading set-ups and express my market views. If you have futures in your trading portfolio, you can check out on CME Group data plans available that suit your trading needs www.tradingview.com

#TRUMPUSDT — Breakdown or Reversal Confirmation🚀 BYBIT:TRUMPUSDT.P — Breakdown or Reversal Confirmation? Full Breakdown on 1H & 4H!
Let’s start by analyzing the charts on different timeframes:
✅ On the 1H chart , we clearly see a reversal pattern — Inverted Head & Shoulders — and the neckline breakout has already occurred. The volume on the breakout is high, which confirms the strength of the signal.
➡️ The target for this pattern is around $10.75–$10.80, which also aligns with the upper VPOC level from the previous range.
➡️ The POC level for BYBIT:TRUMPUSDT.P is $10.159, which may now act as support — this can be a potential entry zone.
➡️ Nearest resistance is at $10.40. A breakout above this level could trigger an impulse move towards $10.75–$10.80.
✅ On the 4H chart , a bearish flag is forming, which could potentially push the price lower — but this scenario hasn't played out yet.
➡️ There's also a local double bottom, confirmed by a price bounce. A retest of the flag’s lower boundary will be a key moment.
Let’s break down the patterns:
✅ 1. Inverted Head & Shoulders (1H) – A classic bottom reversal formation.
➡️ The neckline breakout occurred on increased volume — a key confirmation for a long setup.
✅ 2. Volume (Volume Profile & Bars) – Strong volume spike during the breakout confirms buyer interest.
✅ 3. Price broke out of consolidation – We’ve seen an impulsive breakout and the price is holding above the neckline.
✅ 4. Local Market Structure Break (MSB) – A shift from local downtrend to an emerging uptrend.
📍 Key Point: If the price holds above $10.40, this confirms a breakout from the descending channel, increasing the chance of reaching $10.75–$11.00.
📍 Price must also stay above $10.15 and not fall back into the previous range. A retest and bounce from this level would serve as further confirmation.
📢 If the price drops back below $10.15 and breaks $9.87, the “Inverted Head & Shoulders” pattern will be invalidated. In that case, a bearish trend will likely resume and a short toward $9.50–$9.00 could be considered.
📢 On the 4H chart, the risk of the bearish flag playing out still remains. We are monitoring the structure closely — a sharp pullback is possible.
📢 The volume zone around $10.15–$10.20 is key. As long as the price stays above it — the long scenario remains dominant.
🚀 As of now, BYBIT:TRUMPUSDT.P has strong technical reasons to support a long bias, especially if it holds above $10.40 — that would open the door to $10.75–$11.00.
Risks remain — particularly around the 4H bearish flag — but for now, bullish momentum prevails.
🚀 BYBIT:TRUMPUSDT.P still holds upside reversal potential — LONG scenario remains the priority!

Official Trump price analysis$Trump coin will probably only go off when and if Trump wins the Nobel Peace Prize. And for this to happen, his activities and rhetoric must change completely... at the moment, it looks "on the verge of fantasy."
Meanwhile: A major investor lost money on TRUMP again - this time $3.3m, he sold 743,947 TRUMP for $7.92m, but did so at a loss.
The irony is that at the very beginning of trading this token, he earned $11.82 million. However, a series of unsuccessful trades resulted in serious losses - now his total loss on $TRUMP has reached $15.7 million.
1️⃣ If by some miracle OKX:TRUMPUSDT manages to break out above the trend price, then we can dream of $14.26 and $17.36
2️⃣ А if, again, he writes, or says, or does something stupid, which is more likely for this personality.... then #Trump at $7-7.2, why not.
Ten times less than the highs... that's where the success is!)
