TRUMP COIN 4H TRADE PLANS.Currently ranging but its different from other alts coins because of its manipulation. So i will stay away from this coin in marked area and long short areas are also marked.
TRUMPUSDT

TRUMPUSDT 12H Analysis TRUMP ~ 12H Analysis
#TRUMP Buy after successfully breaking this resistance line or buy when retesting this support block with a short-term target of at least 10%++

TRUMP 4X Lev. Full PREMIUM Trade-Numbers (PP: 1266%)The market always offers a second chance... Good evening my fellow Cryptocurrency trader, look what I have for you!
This is definitely one of your favorite Altcoins, a memecoin, and I want to give you great numbers right now.
This is very, very, very simple. Just buy and hold.
This is a high probability trade-setup but still kind of risky because the action is happening "mid-air." But this is great timing, I believe because only the market can decide about this.
If you don't know what the below numbers mean, you can skip them all together and just go spot. To go "spot," buy as much as you can. "Buy as if the world is ending tomorrow." "Buy like is the end of the world —and hold." That's the greatness of spot, you can't go wrong.
For more advanced and experienced trader, I am wishing you tons of profits and success. Full trade-numbers below:
_____
LONG TRUMPUSDT
Leverage: 4X
Entry levels:
1) $13.80
2) $12.65
3) $11.20
4) $9.85
Targets:
1) $15.8
2) $17.9
3) $20.8
4) $24.5
5) $28.6
6) $31.2
7) $35.3
8) $42.0
9) $46.7
10) $52.7
Stop-loss:
Close weekly below $9
Potential profits: 1266%
Capital allocation: 3%
_____
Remember, while I believe this is a great setup with great prices and great timing, market conditions can always change. If you cannot handle the weight of your actions, do not trade.
Only use money you can afford to lose.
Plan ahead. There is always risk involved.
With that said, get ready for another successful leveraged trade.
Thank you for reading.
I love you—your support is highly appreciated.
Namaste.

OFFICIAL TRUMP Main trend. 16 05 2025Logarithm. Time frame 3 days. After a super pump and a drive of "stupid money", a descending channel was formed on a natural dump. The price came out of it. Now a triangle is forming. The price is clamped. The reversal zones and percentages to the key support/resistance levels are shown extremely accurately according to TA.
If there is no aggressive exit in the medium term, then there will be consolidation and, as a consequence, the formation of a horizontal channel "sholtai / chattai", its key zones are shown.
Now, this "cryptocurrency" is now on 16 05 2025 in 41st place by capitalization.
Reductions from the price highs are about -90%.
From the liquid zone about -84%.
These are not the minimum values of the decline of such hype cryptocurrencies. Just take this into account in your money management. For clarity, the level zones and the % of potential decline if the trend breaks again are shown on the chart (pull the chart down).
Even with such a decline, the price is now at a huge profit. I am not speaking for the creators of the cryptocurrency, but for the first speculators and "investors" who may not have sold everything on the hype.
For the creators of the cryptocurrency, perhaps these are manipulators close to the Trump family, for them, any sale is super profit. But in order to sell, you need to maintain liquidity, and from time to time make interest in speculation and asset retention by investors, that is, do pumps and hype. Use this, and do not be greedy...
Levels and zones, pump/dump, which the price will "feel" are shown in advance. Click "play" on the chart and move the chart up. With a high degree of probability, the hype and pumping of the price of this cryptocurrency will be repeated, given the hype and the long term of the political figure whose name this cryptocurrency bears. Now it is a Trump dump, in the future it will become a Trump pump for some time.
Do not forget to sell on the next hype. If you understand that you are very greedy, and the news background affects you, then sell in parts, or use stop losses to protect profits.
There is no need to guess the minimums and maximums. It is important to know these zones, and have an acceptable average price, from the position of the trend, and its potential. It is regulated by the distributed entry volume (in advance) at potential reversal zones.

OFFICIAL Trump: Should I Sell Everything Now?Notice how interesting this is, while TRUMPUSDT peaked 26-April, the "higher low" on the chart remains untested, that is, this trading pair is consolidating while staying sideways.
While there was a lower high 10-May compared to 26-April, there is no strong retrace. TRUMPUSDT is trading high up.
This is not the time to sell, no. This is the time to buy, buy strong and hold because not only OFFICIAL TRUMP but everything Crypto will grow.
The longer the consolidation (sideways) period, the stronger the bullish wave that follows. In fact, it is good that TRUMPUSDT is sideways now and working to gain strength. This means that the project is preparing for a massive bullish wave. This wave will happen next in a matter of time, can be a week from now... Prices will be moving higher for certain, patience is called for.
Namaste.

TRUMPUSDTi Observed these Levels based on Price Action and Demand & Supply which is my own Concept "PENDAM CONCEPTS"... Please don't take any trades based on this chart/post... Because this chart is for educational purpose only not for Buy or Sell Recommendation... Thank Q

$TRUMP BREAKOUT - Short EntryOn the 1hr chart, we saw that $TRUMP consolidated from 9th May and has broken out of the box. Looks like it’s a gonna drop. Trade with caution
Please support this idea with a LIKE👍 if you find it useful🥳
Happy Trading💰🥳🤗

Trump Asset Eyes 20% Surge Toward $17 – Breakout ConfirmedHello and greetings to all the crypto enthusiasts, ✌
All previous targets were nailed ✅! Now, let’s dive into a full analysis of the upcoming price potential for Trump's officia l 🔍📈.
Last month, Trump's official successfully broke above its descending channel and has since completed a clean retest of the breakout zone. The technical structure remains bullish, and current momentum supports a potential continuation toward the $17 level—reflecting an estimated 20% upside from here. 📊🚀
🧨 Our team's main opinion is: 🧨
After breaking out of its descending channel and retesting successfully, this Trump shows bullish momentum with a 20% upside potential toward the $17 target. 📈
Give me some energy !!
✨We invest hours crafting valuable ideas, and your support means everything—feel free to ask questions in the comments! 😊💬
Cheers, Mad Whale. 🐋

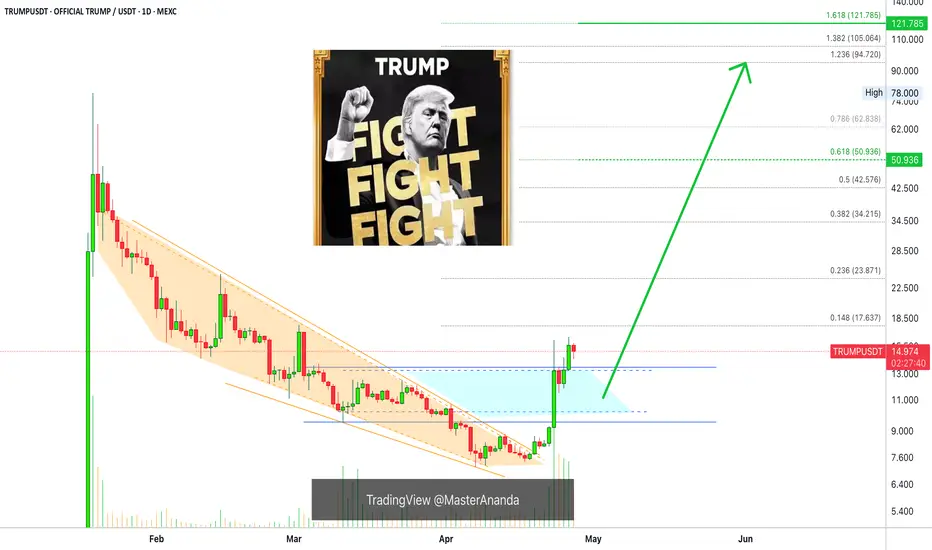
OFFICIAL TRUMP Targets: $50—264%, $121—764%, $192—1,271% &..."Patience is key" has been a valuable and valid tool in the past few weeks. TRUMPUSDT has been consolidating above support and nothing more is needed other than patience to win.
Today we are going to be looking at multiple targets, long-term and short-term. All the targets that are likely to hit in this upcoming bullish cycle.
$TRUMP is growing and will continue to grow. It is normal to see some consolidation before a major move. In fact, the consolidation phase (sideways) is what makes a strong bullish impulse possible. The first wave is in.
A bullish impulse consist of 5 waves. Three waves forward, advances, and two waves backward, corrections. The third wave tends to be the biggest wave based on size and volume but it can happen that the fifth wave ends up being the biggest one.
TRUMPUSDT is about to enter its third wave based on Elliott Wave Theory. The third wave would easily cut through $34 as a resistance level and continue higher to reach $51. This $51 target gives a nice 264% but this is easy. Additional growth can happen within months and TRUMPUSDT can hit $121 for a total of 764%.
The fourth wave is a correction. Seeing that the second wave was very small and short, the fourth wave can be long in size and duration. After this wave comes the final wave which is the speculative wave. In this wave, Wave 5, anything goes.
TRUMPUSDT can continue growing through late 2025 and reach major new All-Time Highs. A $148 target can be easy if $121 is reached within the third wave. A strong peak price for the fifth wave would be $192 for a huge 1,271%. With a strong blow-off top, a $263 target can close the cycle with an astonishing 1,778%. Of course, it can go higher on a wick based on the weekly or monthly timeframes. Surely, this is a new trading pair with no historical data, growth can definitely go beyond the chart.
These targets are based on Elliott Wave Theory and Fibonacci proportions, they can work as a map to help us navigate future price action as the bull market develops.
Thanks a lot for your continued support.
Namaste.

A bet on US geopolitical power I lomged trump some time ago. I won't say at what price but i think this will pump a bit today as the dinner snapshot approaches. Some normie influenzas are convincing their followers to short it into the snapshot but i think except for some minor corrections there will be no major crash to $8 or whatever. This token is slowly and steadily going to creep back up to $100 price. whenever trump solves global conflicts such as india-pakistan, ukraine- israel etc. It'll positively influence the price of this token. A bet on $trump is a bet on $trump's presidency. Whether he will prove to be a good president or not is upto you. Regardless, keks will be had.

TRUMP Declares Ceasefire with Bears? Or No?Greetings! - This is the M-prof of TRUMP/USDT
The 4H SVP chart for TRUMP/USDT shows a clear breakout from a prolonged accumulation range that held below the $12.5 zone for several days. We can see a clean shift in structure starting May 9, with a breakout candle supported by a strong volume node at $12.55 and a sharp migration in the Value Area High (VAH) and POC upwards toward $14+. The current POC now sits at $14.14 with acceptance forming above it, which confirms that buyers are in control. The latest 4H candles show price holding the upper part of the volume distribution, suggesting strong value acceptance and potential continuation. As long as TRUMP stays above $13.90 (VAL of the recent profile), bulls are in charge and any dips near $14.00–$14.10 can be considered for long entries. A breakout above $14.65–$14.80 could trigger the next leg toward $15.50+. Only a close below $13.70 would invalidate the current bullish structure.
Doodle structure looks good for short, Likely a small liquidity grab will happen!

$TRUMPUSDT Breakout Alert!$TRUMP has officially broken above its descending trendline after holding firm support around $11.8. The price also reclaims the 100 EMA (orange line), signaling strength and potential for a trend reversal.
📈 Technical Highlights:
Downtrend breakout confirmed ✅
Retest of resistance turned support around $13.3 ✅
Targets in sight:
• TP1: $16.52
• TP2: $21.04
• TP3: $26.35
This breakout setup remains valid as long as TRUMPUSDT holds above $13.3. A clean trendline flip often leads to explosive follow-throughs.

OFFICIAL TRUMP Exact Levels Predicted, Next Target (Explained)The higher low is in and this will lead to a higher high.
As TRUMPUSDT moves up, there will be no resistance until the action reaches $25.35. This is the exact number for the next stop.
After a target is reached, there is always a retrace. Just as it happened after 26-April. The retrace ends in a higher low and the higher low ends by producing a continuation of the bullish move and trend.
After $25.35 and a small retrace, TRUMPUSDT will continue growing to reach $34.61. The market never moves straight up nor straight down, it fluctuates, patience is key.
There is no need to buy and sell at each target, the best and easiest way to earn big money is to buy at support and hold long-term. When prices are high enough, one can easily sell and collect profits.
On a bigger and broader perspective, the three targets on the chart will be taken out as part of the 3rd wave of the current bullish impulse. This will lead to a retrace, wave 4, and this will then lead to additional growth and higher prices, wave 5.
Wave 5 will lead to a strong correction and this strong correction to a higher low based on the broader structure. This higher low will resume to produce an advance that will end up in a bull run phase and a new All-Time High.
After the All-Time High comes the long-term correction also known as bear market. The next bear market won't be as bad as the previous one. Compared to the 2022 bear market and the transition period, it will be fast and small. We are set for an entire decade of mostly growth. Still, allow for the usual fluctuations and variations. If you hold focusing on the long-term, you can't go wrong. Right now, you should be buying like it is the end of the world. The world won't end, but low prices won't be available for too long.
When strong bullish action starts we wonder, "Why didn't I buy when prices were low?"
Just recently, between 7 and 22 April, TRUMPUSDT was trading very, very low. While the initial bullish breakout is in, it is still early.
Thanks a lot for your continued support.
Namaste.

Bitcoin: The Robot Taxi Driver We Didn’t NeedWhy Blockchain Is Driving the Future Without It
In the 1990 sci-fi classic Total Recall, Arnold Schwarzenegger’s character hails a futuristic taxi only to be greeted by “Johnny Cab”—a creepy, clunky robot driver that awkwardly talks while struggling to navigate.
Back then, audiences imagined a future where robotic taxi drivers would be commonplace. But instead, we got something far superior: fully autonomous, self-driving cars that render robot drivers unnecessary.
The same is happening with Bitcoin. It was revolutionary, sure—but much like Johnny Cab, it’s outdated, inefficient, and rapidly becoming irrelevant in a world driven by advanced blockchain technology.
Bitcoin: The Nostalgic First Step
When Bitcoin burst onto the scene, it felt groundbreaking—just like the idea of robot taxi drivers in the Total Recall era. It gave us a new way to transact, free from centralized banks. People were thrilled, seeing it as the future of money.
But here’s the problem: Bitcoin was never the endgame. It was merely the proof-of-concept—like Johnny Cab showing that, yes, you can put a robot behind the wheel… but does that mean we should?
As financial systems evolved, Bitcoin’s shortcomings became glaringly obvious:
✅ Slow transaction speeds
✅ High fees
✅ Lack of scalability
✅ Energy inefficiency
Meanwhile, blockchain technology—the real revolution—kept advancing, proving that we don’t actually need Bitcoin any more than we needed Johnny Cab.
Enter Blockchain: The Self-Driving System
Self-driving cars didn’t need robot taxi drivers, and blockchain doesn’t need Bitcoin.
Blockchain is the foundation—an autonomous, self-sustaining system that underpins everything from finance to supply chains to digital assets.
In fact, precious metals, equities, and commodities are all moving toward digitization—but not through Bitcoin. Instead, they’re being integrated directly into blockchain-based ecosystems that offer seamless, smart contract-driven transactions.
The result?
💨 Faster
💡 More efficient
🛠️ Scalable & adaptable
Bitcoin, on the other hand, is stuck in the past. It’s clunky, expensive, and increasingly unnecessary—just like a robot taxi driver frantically punching buttons while self-driving cars smoothly navigate the streets.
Why Bitcoin Will Be Left Behind
Much like how we skipped the “robot taxi driver phase” and went straight to autonomous vehicles, the financial world will soon skip Bitcoin entirely as blockchain technology takes over.
Everything digital is moving toward streamlined, automated systems—systems that don’t require Bitcoin as an intermediary.
So the real question isn’t, “Will Bitcoin survive?”
It’s: “Why would we even need it?”
Just like Johnny Cab in Total Recall, Bitcoin might be fun to look back on—but it’s not the future.
Blockchain is the self-driving car. Bitcoin is the unnecessary robot driver.
And in a world that values efficiency, guess which one we’re leaving behind? 🚗💨
INDEX:BTCUSD CRYPTO:BTCUSD NASDAQ:COIN NASDAQ:MSTR NASDAQ:MARA TVC:GOLD TVC:SILVER TVC:DXY SP:SPX NYSE:BLK NASDAQ:TSLA NYSE:GME INDEX:ETHUSD CRYPTO:XRPUSD CRYPTO:ADAUSD

TRUMP: Advanced Trading Strategy For 6,666% Instant ProfitsThe higher low is in and support is being confirmed now as I write this; patience is key.
It is a waiting game. This whole trading experience, venture or adventure... It is all a waiting game.
The better you get at waiting the best you can do.
You see, when the market is bland, boring and sideways this can last for a long while. When the market starts crashing or rising everything can happen within a day.
In order to catch the rise, we have to be in and ready to wait.
In order to avoid the crash, we have to set our sell orders on target before the rise takes place. Something like buying in, setting the orders high up (never stop-loss) and then waiting for the market to take care of the rest.
I know it can be boring sometimes and at other times doubt can even creep up. This is not bad nor is there anything wrong with you if this happens, this is normal but you shouldn't worry if you are ready to hold.
The market can go up slowly for 3 months and you wouldn't mind the fact that it is growing if the price moves from $10 to $13 in three months. Then on the fourth month, there is an advance from $13 to $50 and wow!
But if the market drops slowly from $10 to $7 within 3 months we start to become anxious and scared, why? Then, on the fourth month there is an advance from $7 to $50 and wow!
You see? It is all psychological you know. When the market was rising slowly, there was no difference, no secured profits and yet you didn't mind having to wait. But when the market moves lower, you might want to secure a losing trade.
Both the up and the down produce $$$ changes on paper only, nothing changes when it comes to the amount of coins you bought and hold.
If the coins are going to be worth more down the road, six months from now, say, 500% more; this should be an easy hold.
Ignore the short-term, ignore the noise hold strong.
You can do it and you are doing it, for doing this you will be paid and when you get paid you will be happy with the results.
I should give you my strategy once more: Buy and hold.
Thanks a lot for your continued support.
Bitcoin and the Altcoins market is set to grow really, really strong in the coming months.
Just be prepared to wait, it will be worth every day, every minute every second once you get your reward.
Actually, I like to wait. I can study and exercise—prepare—while the market goes through its consolidation phase. I can plan.
Once the new high—All-Time High—is in and the bullish wave is over, I will be prepared to pocket huge profits because I planning and studying today.
Thank you for reading.
Namaste.

What Happened To OFFICIAL TRUMP? No More Bullish Action? Read...Did you give up already?
If you did you are not playing the game right. Patience is key.
The initial bullish breakout is in so the next bullish wave is confirmed; but, the initial bullish breakout is corrected and ends in a higher low. This retrace can last a few days just as it can last a few weeks, it is random the market chooses how big is this wait.
If the whales learn that participants are anxious and desperate, the retrace and higher low will take longer so that people will fold and they can buy more at the lows.
If the bots track your trading and see that you are likely to fold if the next rise is delayed by 3-5 more days, then the bots will not start buying until people sell at low prices. The moment you sell the next rise starts to develop almost instantly. Patience is key is what I say.
How long it takes it doesn't matter that's not how it works. The way it works is that you buy with a long-term mindset, "I will wait for as long as it is necessary for my money to grow." Once in, you hold. That's it, nothing more can be done.
Prediction: Just watch! TRUMPUSDT will grow from a higher low. The last low was the bottom and the current retrace, literally five days, is nothing more than bullish consolidation. After some time, a small wait, we will have a higher high. That is how it works. The market never moves straight down but neither straight up. It fluctuates... Doing zig-zags... And that's what you see on the chart.
Be patient, Trump will grow.
Just set it and forget it, comeback when prices are up.
Namaste.

Breakout+Support+Fib = 20% Trump upside coming. Targeting $17Hello and greetings to all the crypto enthusiasts, ✌
All previous targets were nailed ✅! Now, let’s dive into a full analysis of the upcoming price potential for Trump's official 🔍📈.
Trump's official has broken out of its descending channel to the upside, indicating a potential bullish reversal. A bounce from the Fibonacci retracement level and daily support suggests upward momentum could resume. I'm targeting a minimum 20% move toward the $17 level, which aligns with a major trendline resistance.📚🙌
🧨 Our team's main opinion is: 🧨
Trump broke its downtrend, and with support from key Fibonacci and daily levels, it could climb 20% toward the $17 trendline resistance.📚🎇
Give me some energy !!
✨We invest hours crafting valuable ideas, and your support means everything—feel free to ask questions in the comments! 😊💬
Cheers, Mad Whale. 🐋

TRUMPUSDT BUY/LONGBy utilizing Fibonacci retracement levels, historical patterns, , we can formulate a hypothesis that the market might follow a similar trajectory if bullish sentiment prevails.

TRUMP Update!TRUMP Update:
TRUMP is currently sitting at the 21 MA support. If it holds strong, we are likely to see a rebound. There is another support around $13.6, but it may weaken if the price breaks down below the 21 MA.
The RSI is forming a bearish divergence, suggesting that a short-term correction is likely.
Strategy:
~ Entering a short position at CMP to $15.6.
~ Stop loss: $16.5.
~ Leverage: 5x to 10x.
~ Target: $11.5 to $12.
Note: Always do your own research and analysis before investing.
Regards,
Dexter.

Breaking: $TRUMP Set to Go Parabolic Amidst Golden Cross PatternThe price of Trump coin is set to go parabolic with an anticipated 120% surge on the horizon amid forming a golden cross pattern- a pattern formed when the 50-day MA crosses above the 200-day MA resorted to a trend reversal.
Further solidifying the bullish thesis is the fact that $TRUMP coin has broken a bullish pennant earlier on surging 70% for the past 5 days. With the RSI at 46 and the anticipated Trump’s private dinner for TRUMP $TRUMP token holders, this Polit-Fi memecoin on Solana could be the catalyst for the next bull run.
While already down 9% for the past 24 hours, this is a market shake-off to, accumulate liquidity for the big pump up. However, should $TRUMP coin experience selling pressure, the possible retracement level will be the $11.55 support pivot.
OFFICIAL TRUMP Price Data
The OFFICIAL TRUMP price today is $13.69 USD with a 24-hour trading volume of $1,162,628,325 USD. OFFICIAL TRUMP is down 9.58% in the last 24 hours. The current CoinMarketCap ranking is #35, with a market cap of $2,738,579,157 USD. It has a circulating supply of 199,999,397 TRUMP coins and a max. supply of 999,999,993 TRUMP coins.

Is Trump's official Set for a 20% Rally to $18.95?Hello and greetings to all the crypto enthusiasts, ✌
All previous targets were nailed ✅! Now, let’s dive into a full analysis of the upcoming price potential for Trump's official 🔍📈.
I successfully shorted Trump at key levels with precision and later identified the bottom near the $8 zone. Following a strategic accumulation, I now anticipate at least 20% additional upside. My primary price target is set at $18.95.📚🙌
🧨 Our team's main opinion is: 🧨
I shorted Trump perfectly, bought near $8, and now see at least 20% upside toward my main $18.95 target.📚🎇
Give me some energy !!
✨We invest hours crafting valuable ideas, and your support means everything—feel free to ask questions in the comments! 😊💬
Cheers, Mad Whale. 🐋

OFFICIAL TRUMP Update —Your Guide Through Light & DarkIt gets better and better. Yesterday TRUMPUSDT produced the highest session close since 3-March. Think about it... The bottom is fully in and confirmed and now almost two months of bearish action have been completed obliterated. The action is happening now the same as if it were early February 2025.
Another interesting fact is that almost two months of bearish action has been deleted but the chart is only a little over 3 months old. The bears are no more we are in the bullish zone.
This is important and a strong confirmation.
TRUMPUSDT started trading when the market was bearish and moving within a strong corrective phase. The correction for the last major 2024 bullish wave.
Corrections are tough I agree and the market bleeds but they end and once they end the action turns the other way and that's what you are seeing today.
There is no doubt here, nothing to fear, the rise won't stop it is only getting started. Make no mistakes.
How far up TRUMPUSDT will grow is only speculation but you can expect a new All-Time High for sure. And that's easy for a Cryptocurrency project and one with so much buyers, holders, attention and market support.
This is a simple update mentioning the highest close in months, the bottom is in and bullish continuation confirmed. Keep holding and you win. Keep buying, double-win. Only sell when the market reaches new All-Time High and is full green.
Right now is the time to buy and hold, when prices are low. Only when prices are high we take the profits and move on.
Trading is meant to make money. To make money, you have to let go of your position once the market grows.
Prepare now. Plan ahead of time.
You will do great. You have my support.
Thanks a lot for your continued support.
I will be your guidance through the light and through the dark.
Namaste.
TRUMP COIN BUY...Hello friends
Given the price growth we had, the price correction has now managed to make good bottoms, which indicates the strength of the trend, so we can enter the trade.
The purchase and target points have also been identified...
Follow capital management.
*Trade safely with us*
