What Happened To OFFICIAL TRUMP? No More Bullish Action? Read...Did you give up already?
If you did you are not playing the game right. Patience is key.
The initial bullish breakout is in so the next bullish wave is confirmed; but, the initial bullish breakout is corrected and ends in a higher low. This retrace can last a few days just as it can last a few weeks, it is random the market chooses how big is this wait.
If the whales learn that participants are anxious and desperate, the retrace and higher low will take longer so that people will fold and they can buy more at the lows.
If the bots track your trading and see that you are likely to fold if the next rise is delayed by 3-5 more days, then the bots will not start buying until people sell at low prices. The moment you sell the next rise starts to develop almost instantly. Patience is key is what I say.
How long it takes it doesn't matter that's not how it works. The way it works is that you buy with a long-term mindset, "I will wait for as long as it is necessary for my money to grow." Once in, you hold. That's it, nothing more can be done.
Prediction: Just watch! TRUMPUSDT will grow from a higher low. The last low was the bottom and the current retrace, literally five days, is nothing more than bullish consolidation. After some time, a small wait, we will have a higher high. That is how it works. The market never moves straight down but neither straight up. It fluctuates... Doing zig-zags... And that's what you see on the chart.
Be patient, Trump will grow.
Just set it and forget it, comeback when prices are up.
Namaste.
TRUMPUSDT

Breakout+Support+Fib = 20% Trump upside coming. Targeting $17Hello and greetings to all the crypto enthusiasts, ✌
All previous targets were nailed ✅! Now, let’s dive into a full analysis of the upcoming price potential for Trump's official 🔍📈.
Trump's official has broken out of its descending channel to the upside, indicating a potential bullish reversal. A bounce from the Fibonacci retracement level and daily support suggests upward momentum could resume. I'm targeting a minimum 20% move toward the $17 level, which aligns with a major trendline resistance.📚🙌
🧨 Our team's main opinion is: 🧨
Trump broke its downtrend, and with support from key Fibonacci and daily levels, it could climb 20% toward the $17 trendline resistance.📚🎇
Give me some energy !!
✨We invest hours crafting valuable ideas, and your support means everything—feel free to ask questions in the comments! 😊💬
Cheers, Mad Whale. 🐋

TRUMPUSDT BUY/LONGBy utilizing Fibonacci retracement levels, historical patterns, , we can formulate a hypothesis that the market might follow a similar trajectory if bullish sentiment prevails.

Breaking: $TRUMP Set to Go Parabolic Amidst Golden Cross PatternThe price of Trump coin is set to go parabolic with an anticipated 120% surge on the horizon amid forming a golden cross pattern- a pattern formed when the 50-day MA crosses above the 200-day MA resorted to a trend reversal.
Further solidifying the bullish thesis is the fact that $TRUMP coin has broken a bullish pennant earlier on surging 70% for the past 5 days. With the RSI at 46 and the anticipated Trump’s private dinner for TRUMP $TRUMP token holders, this Polit-Fi memecoin on Solana could be the catalyst for the next bull run.
While already down 9% for the past 24 hours, this is a market shake-off to, accumulate liquidity for the big pump up. However, should $TRUMP coin experience selling pressure, the possible retracement level will be the $11.55 support pivot.
OFFICIAL TRUMP Price Data
The OFFICIAL TRUMP price today is $13.69 USD with a 24-hour trading volume of $1,162,628,325 USD. OFFICIAL TRUMP is down 9.58% in the last 24 hours. The current CoinMarketCap ranking is #35, with a market cap of $2,738,579,157 USD. It has a circulating supply of 199,999,397 TRUMP coins and a max. supply of 999,999,993 TRUMP coins.

Is Trump's official Set for a 20% Rally to $18.95?Hello and greetings to all the crypto enthusiasts, ✌
All previous targets were nailed ✅! Now, let’s dive into a full analysis of the upcoming price potential for Trump's official 🔍📈.
I successfully shorted Trump at key levels with precision and later identified the bottom near the $8 zone. Following a strategic accumulation, I now anticipate at least 20% additional upside. My primary price target is set at $18.95.📚🙌
🧨 Our team's main opinion is: 🧨
I shorted Trump perfectly, bought near $8, and now see at least 20% upside toward my main $18.95 target.📚🎇
Give me some energy !!
✨We invest hours crafting valuable ideas, and your support means everything—feel free to ask questions in the comments! 😊💬
Cheers, Mad Whale. 🐋

OFFICIAL TRUMP Update —Your Guide Through Light & DarkIt gets better and better. Yesterday TRUMPUSDT produced the highest session close since 3-March. Think about it... The bottom is fully in and confirmed and now almost two months of bearish action have been completed obliterated. The action is happening now the same as if it were early February 2025.
Another interesting fact is that almost two months of bearish action has been deleted but the chart is only a little over 3 months old. The bears are no more we are in the bullish zone.
This is important and a strong confirmation.
TRUMPUSDT started trading when the market was bearish and moving within a strong corrective phase. The correction for the last major 2024 bullish wave.
Corrections are tough I agree and the market bleeds but they end and once they end the action turns the other way and that's what you are seeing today.
There is no doubt here, nothing to fear, the rise won't stop it is only getting started. Make no mistakes.
How far up TRUMPUSDT will grow is only speculation but you can expect a new All-Time High for sure. And that's easy for a Cryptocurrency project and one with so much buyers, holders, attention and market support.
This is a simple update mentioning the highest close in months, the bottom is in and bullish continuation confirmed. Keep holding and you win. Keep buying, double-win. Only sell when the market reaches new All-Time High and is full green.
Right now is the time to buy and hold, when prices are low. Only when prices are high we take the profits and move on.
Trading is meant to make money. To make money, you have to let go of your position once the market grows.
Prepare now. Plan ahead of time.
You will do great. You have my support.
Thanks a lot for your continued support.
I will be your guidance through the light and through the dark.
Namaste.
TRUMP COIN BUY...Hello friends
Given the price growth we had, the price correction has now managed to make good bottoms, which indicates the strength of the trend, so we can enter the trade.
The purchase and target points have also been identified...
Follow capital management.
*Trade safely with us*

Important section: 12.560-18.301
Hello, traders.
If you "Follow", you can always get new information quickly.
Please click "Boost" as well.
Have a nice day today.
-------------------------------------
(TRUMPUSDT.P 1D chart)
The HA-Low indicator on the 1D chart is showing an upward trend after being created.
The HA-Low indicator is currently formed at 7.933.
-
The 12.560-18.301 section corresponds to the Close value of Heikin-Ashi on the 1M chart.
Accordingly, in order to continue the upward trend, it is expected that the price will have to rise above 12.560-18.301 to maintain the price.
-
If it falls below 11.796-12.560, it is likely to meet the HA-Low indicator on the 1D chart again, so a response strategy is needed.
-
If it rises above 18.301 and maintains the price, it is expected to determine the trend again by touching around 27.329.
-
Thank you for reading to the end.
I hope you have a successful trade.
--------------------------------------------------
- This is an explanation of the big picture.
I used TradingView's INDEX chart to check the entire range of BTC.
I rewrote it to update the previous chart while touching the Fibonacci ratio range of 1.902 (101875.70) ~ 2 (106275.10).
(Previous BTCUSD 12M chart)
Looking at the big picture, it seems to have been following a pattern since 2015.
In other words, it is a pattern that maintains a 3-year bull market and faces a 1-year bear market.
Accordingly, the bull market is expected to continue until 2025.
-
(Current BTCUSD 12M chart)
Based on the currently written Fibonacci ratio, it is displayed up to 3.618 (178910.15).
It is expected that it will not fall again below the Fibonacci ratio of 0.618 (44234.54).
(BTCUSDT 12M chart)
I think it is around 42283.58 when looking at the BTCUSDT chart.
-
I will explain it again with the BTCUSD chart.
The Fibonacci ratio ranges marked in the light green boxes, 1.902 (101875.70) ~ 2 (106275.10) and 3 (151166.97) ~ 3.14 (157451.83), are expected to be important support and resistance ranges.
In other words, it seems likely to act as a volume profile range.
Therefore, in order to break through this section upward, I think the point to watch is whether it can rise with support near the Fibonacci ratios of 1.618 (89126.41) and 2.618 (134018.28).
Therefore, the maximum rising section in 2025 is expected to be the 3 (151166.97) ~ 3.14 (157451.83) section.
To do that, we need to look at whether it can rise with support near 2.618 (134018.28).
If it falls after the bull market in 2025, we don't know how far it will fall, but considering the previous decline, we expect it to fall by about -60% to -70%.
So, if the decline starts near the Fibonacci ratio 3.14 (157451.83), it seems likely that it will fall to around Fibonacci 0.618 (44234.54).
I will explain more details when the downtrend starts.
------------------------------------------------------

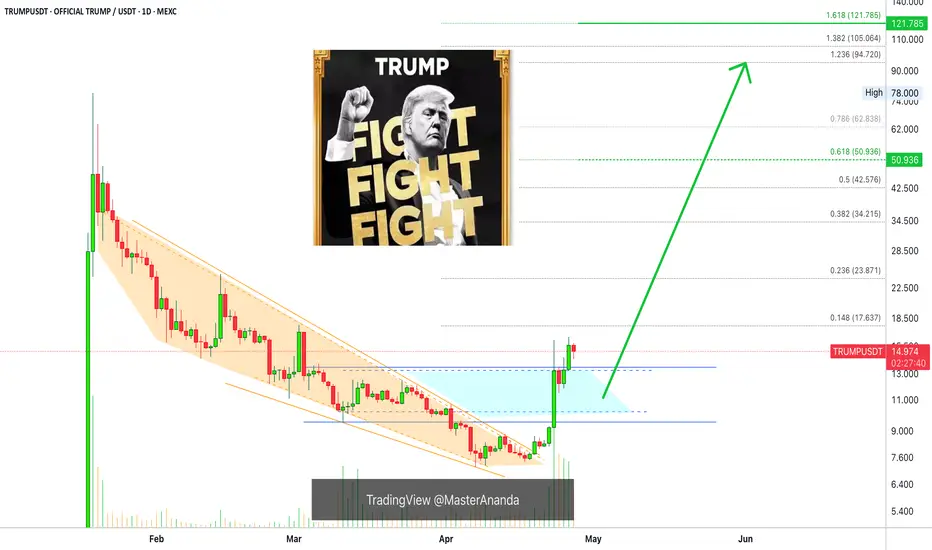
Trump Short & Long-Term With Targets ($263, $192 & $121 —1,627%)This is the long-term chart for TRUMPUSDT (OFFICIAL TRUMP), all bullish signals are strong and 100% confirmed. Higher prices next with a high lever of certainty. An uptrend will develop now, higher highs and higher lows.
The weekly session is full green, current session.
The trading volume on this session is the highest ever. Check.
There is a falling wedge pattern fully broken.
The downtrend has been broken.
There is a rounded bottom pattern (stop-loss hunt event) that work as a reversal signal.
The action is happening back above support, recently a resistance zone. These are the blue lines on the chart.
All these are bullish signals.
Next comes the targets:
1) The first and easy target sits at $24.
2) This one is followed by $34 and $42.5.
3) The main target in the coming weeks is $51.
4) Mid-term, within 3 months, we have $63, $94 and $122.
5) The remaining set of targets will be hit long-term, 6 months or more. These are in the range of a strong new All-Time High, it can be seen on the chart.
Thank you for reading.
Boost for more frequent updates and comment.
Namaste.

TRUMPUSDT LongTRUMP buy signal on M15 Timeframe. Triangle pattern was succesfully broken on bullish side. Now bullish target is 8.66 level, Risk reward 1/5. On higher TimeFrame bullish target is 9.4 level.

OFFICIAL TRUMP 100X Chart Setup Now PossibleLook at this, the bottom is in.
I draw a black line on the chart that matches the wick low from the 3-April candle. Today, the action is back above this low.
All the action below this line is the bottom pattern. It takes time for a bottom to form and this bottom is now confirmed. Once the bottom is in, nothing else can happen other that sustained long-term growth. If the action wasn't sustained long-term, then this wouldn't be the bottom, just another low in place.
This is it, feel free to go All-In with 100X...
I am just kidding of course, leveraged trading is for experts and experts will never gamble their money away.
We trade with 2-3X maximum when we are doing our daily work and we go to higher leverage when the market is trading at its lowest prices possible and this happens only once every 6-8 months.
So, no 100X.
On top of the bottom pattern there is also a falling wedge. The falling wedge has been broken and this means a broken downtrend. What happened with the token unlock?
People were saying that prices were to drop because there was going to be a token unlock, but the market cycle does not care about these things. When prices are low we buy and hold, we sell when prices are high and green.
The targets on the chart are just easy targets, it can go much higher... Much, much higher than what is shown on this chart.
As prices grow, I will publish updates. If you are interested, make sure to boost and follow to show your support.
More comments and boosts, more updates.
Just let me know and I'll get it done.
Namaste.

Trump token bullishKey Levels: The main resistance is at 10.40 dollars , and the main support is at 7.71 dollars . The descending trendline keeps the price below it, and the 200-period moving average above the price confirms the bearish trend .
Closer Zones: A nearby resistance is observed at 8.06 dollars, overlapping with the trendline. The closer support is at 7.71 dollars. A break above 8.06 dollars could push the price toward 9.60 dollars .
Intermediate Level: On the way up, the 8.25 dollars level acts as an intermediate resistance.
Target: Based on the previous move of 2.50 dollars, the potential upside target is around 9.60 dollars .
Conclusion: A breakout above the nearby resistance could signal a weakening bearish trend and the start of an upward move .

TRUMP price analysis✊ At the end of March, we last wrote about #Trump and “looked like water” predicting a price drop to $7-7.20 if the “great and brilliant leader” did not stop doing stupid things.... but then came the April sanctions...
We can comment and discuss it for a long time, but it's no use - you can't get the rust out of the metal or out of your head...
It was interesting on 19.04 - when a large unlock of 40 million #Trump coins took place and participants expected the price dump to continue.... but no...
and already on 23.04 - the news comes out that #Trump will have dinner with the largest holders of his token and, oh, miracle = 75% of the OKX:TRUMPUSDT price pump
There are already jokes on Twitter that the TOP-5 holders will be able to choose to who will be the next to set or remove abnormal taxes during dinner)
But seriously, there is every chance that the #TRUMUSDC price pump will continue and God grant us patience to keep and hold this small amount of #Trump coins to $24-$32 or maybe to $40...
_____________________
Did you like our analysis? Leave a comment, like, and follow to get more

Resistance Watch📈 $TRUMP Analysis: Resistance Watch 🔴
$TRUMP has formed a key red resistance zone.
A breakout above this zone could signal potential trend continuation. 🚀
Keep an eye on volume for confirmation!
Remember that this coin is highly volatile.

Phemex Analysis #76: Pro Tips for Trading the TRUMP Rally!The TRUMP token ( PHEMEX:TRUMPUSDT.P ) has recently experienced a surge in value, with a 60% increase, fueled by news of President Donald Trump inviting the top 220 token holders to a dinner on May 22nd. Additionally, the top 25 holders are reportedly invited to a private event and tour at the White House. These exclusive events have generated significant excitement and speculation within the market, driving increased trading volume and price appreciation. This analysis will explore the potential scenarios for TRUMP token's price action in the short to medium term.
Possible Scenarios
1. Hype-Driven Rally Continuation
The current rally is largely driven by hype and speculation surrounding the upcoming events. If this momentum continues, TRUMP token could see further short-term price increases.
Pro Tips:
Monitor social media sentiment and trading volume for signs of continued hype.
Identify key resistance levels that the price may test, such as $17, $24 & $30.
Consider taking profits on short-term long positions as the event date (May 2nd) approaches.
Implement a trailing stop-loss to protect profits while staying in the trend.
2. Post-Event Sell-Off
It is common for the price of an asset to decline after a major event, as the initial excitement fades. This is a potential risk for TRUMP token following the May 22nd dinner.
Pro Tips:
Be prepared for a potential "sell-the-news" event.
Tighten stop-loss orders or consider exiting long positions before the event.
Consider shorting opportunities if the price breaks below key support levels following the event, but manage risk.
3. Consolidation and Long-Term Value Assessment
After the initial volatility, TRUMP token's price may consolidate as the market attempts to determine its intrinsic value. This consolidation phase could be influenced by factors beyond the immediate hype.
Pro Tips:
Identify the consolidation range and trade accordingly, buying low and selling high within the range.
Assess the token's long-term viability and adoption potential.
Be cautious about long-term positions until the consolidation phase resolves.
Conclusion
The upcoming events involving President Trump have introduced a significant element of hype into the TRUMP token market, leading to a rapid price increase. Traders should be aware of the potential for both continued short-term gains and a post-event sell-off. It is crucial to monitor market sentiment, volume, and price action closely. By employing appropriate risk management strategies and considering the token's long-term fundamentals, traders can navigate the volatility and make informed decisions.
Pro Tips:
Elevate Your Trading Game with Phemex. Experience unparalleled flexibility with features like multiple watchlists, basket orders, and real-time adjustments to strategy orders. Our USDT-based scaled orders give you precise control over your risk, while iceberg orders provide stealthy execution.
Disclaimer: This is NOT financial or investment advice. Please conduct your own research (DYOR). Phemex is not responsible, directly or indirectly, for any damage or loss incurred or claimed to be caused by or in association with the use of or reliance on any content, goods, or services mentioned in this article.

TRUMPUSDT 12HTRUMP ~ 12H Analysis
#TRUMP Buy gradually from here with a short -term target of at least 10%+ from here. We think this will be an area of whale accumulation

Watch These 4 Crypto and Thank Me Later!I analyze several crypto assets that have strong potential to rebound nicely next week
They are:
TRUMP
GALA
TAO
FARTCOIN
Enjoy the analysis!

DJT Weekly Options Trade Plan 2025-04-15NASDAQ:DJT DJT Weekly Analysis Summary (2025-04-15)
Below is a consolidated analysis based on the four reports:
─────────────────────────────
SUMMARY OF EACH MODEL’S KEY POINTS
• Grok/xAI Report:
– Notes that DJT is trading near its 10‐period EMAs on both the 5‑minute and daily charts.
– Indicates a moderately bullish short‐term outlook (helped by positive news about “Truth Social” investment accounts) even though the max pain is at $19.00.
– Recommends a call option trade (buy naked call) at or near the $20.00 strike with an acceptable premium (~$0.63).
• Claude/Anthropic Report:
– The report encountered an error and produced no usable analysis.
• Llama/Meta Report:
– Observes that while the 5‑minute chart shows short‐term bullishness (with price above key EMAs), the overall daily picture and max pain theory (targeting $19.00) point toward a slightly bearish bias.
– Suggests trading a put (such as buying the $19.50 put) but notes factors like high daily volatility and mixed indicators.
• Gemini/Google Report:
– Provides a nuanced view where the 5‑minute charts show consolidation near $20 while the daily chart’s indicators (RSI, MACD histogram, bullish postive news) favor a moderately bullish move.
– Highlights key liquidity around the $20 strikes and ultimately favors a call trade—leaning toward a slightly out‑of‑the‐money option ($20.50 call) but noting that trade risk should be managed tightly.
• DeepSeek Report:
– Summarizes the technical picture with DJT trading above short‐term moving averages but acknowledges max pain at $19.00.
– With a positive news catalyst and falling volatility (VIX), it leans moderately bullish and recommends a call purchase at the $20.00 strike.
─────────────────────────────
AREAS OF AGREEMENT AND DISAGREEMENT
• Agreement:
– All models note a current price of roughly $19.96 with technical support around the short‐term (near the 10‑period EMA).
– Ea
ch analysis recognizes key levels: immediate support near $19.85–$19.94 and resistance around $20.00–$20.50.
– Most models see positive momentum from favorable news (Truth Social catalyst) and improving short‑term indicators.
– Options-chain details (high OI and volume at the $20 strikes) underline the importance of that level.
• Disagreement:
– Llama/Meta tilts toward a bearish reading (using daily MACD and max pain theory, expecting a move toward $19.00) and suggests puts rather than calls.
– Strike selection differs slightly—with some reports favoring the ATM $20.00 call (Grok/xAI and DeepSeek) and others suggesting a slightly OTM $20.50 call (Gemini/Google).
─────────────────────────────
CONCLUSION AND RECOMMENDATION
Overall Market Direction Consensus:
The majority of analyses (three out of four usable models) lean moderately bullish on DJT in the near term. Positive technical momentum on the daily charts together with supportive news outweigh the bearish hints (like max pain and Llama/Meta’s view).
Recommended Trade:
– Trade Type: Buy single‑leg, naked call
– Chosen Strike: $20.00 call (weekly option)
– Expiration: 2025‑04‑17
– Entry: At open with an entry price near the ask of $0.63 per contract
– Risk/Reward Targets:
• Profit Target: Approximately a 20% premium gain (rising from $0.63 to about $0.76)
• Stop‑Loss: About 50% loss of the premium (around $0.32)
– Confidence Level: About 70% (reflecting the bullish bias driven by news and short‑term technicals, while remaining cautious of the max pain level)
Key Risks & Considerations:
– The max pain at $19.00 may exert downward pressure as expiration nears.
– Short‑term volatility remains high (VIX at 30.12), so the trade will need tight risk management.
– Should DJT fail to break above immediate resistance or show signs of a sharp reversal (e.g. dropping below $19.85), consider exiting early to protect capital.
─────────────────────────────
TRADE_DETAILS (JSON Format)
{
"instrument": "DJT",
"direction": "call",
"strike": 20.00,
"expiry": "2025-04-17",
"confidence": 0.70,
"profit_target": 0.76,
"stop_loss": 0.32,
"size": 1,
"entry_price": 0.63,
"entry_timing": "open"
}

Its CHINA vs TRUMPDont know about the tarrifs, but this has a %500 tarriff and is going to get wrecked again!

TRUMPHello friends
Due to the price drop, we reached a good support area where good buyers supported the price.
Now we can buy in steps and with capital management in the specified support areas and move to the specified targets.
Always buy in fear and sell in greed.
*Trade safely with us*

Will Trump's break resistance or drop 26% to $8?Hello and greetings to all the crypto enthusiasts, ✌
All previous targets were nailed ✅! Now, let’s dive into a full analysis of the upcoming price potential for Trump's official 🔍📈.
Trump's official is currently positioned at the upper boundary of its descending channel. Based on technical analysis, I anticipate a further decline of at least 26%, with a target price of $8. A significant resistance level has been identified and marked on the chart. If the stock fails to break above this resistance, the downward trend is likely to continue. Investors should closely monitor price action for confirmation before making trading decisions.📚🙌
🧨 Our team's main opinion is: 🧨
Trump's stock is hitting key resistance in a downtrend, with a likely 26% drop ahead and an $8 target if it doesn’t break higher.📚🎇
Give me some energy !!
✨We invest hours crafting valuable ideas, and your support means everything—feel free to ask questions in the comments! 😊💬
Cheers, Mad Whale. 🐋

TRUMP & MELANIA Collapse - Sh*tcoin Reality CheckIf you had bought BINANCE:TRUMPUSDT or BINANCE:MELANIAUSDT.P at any point during the last three months, you’d likely be deep in loss within just days. These tokens, despite using the names of major political figures, followed a typical memecoin pattern:
🚀 Launch hype → 💰 Speculation → 📉 Massive dump
But here’s what traders need to remember:
🔁 These types of tokens can pump again. All it takes is a tweet, a trending news event, or a post from an influencer or celebrity—think Elon Musk. A spark like that could fuel a rally.
⚠️ However, the risk is extremely high. These projects often lack fundamentals, and the price action is driven mostly by hype and speculation. If you choose to trade them, know your risk tolerance and never overexpose your portfolio.
💡 This is the reality of memecoins. Recognize the pattern, protect your capital, and stay sober in the market.
📊 Follow for grounded insights and market wisdom—no hype, just facts. 🔔

#TRUMPUSDT — Breakdown or Reversal Confirmation🚀 BYBIT:TRUMPUSDT.P — Breakdown or Reversal Confirmation? Full Breakdown on 1H & 4H!
Let’s start by analyzing the charts on different timeframes:
✅ On the 1H chart , we clearly see a reversal pattern — Inverted Head & Shoulders — and the neckline breakout has already occurred. The volume on the breakout is high, which confirms the strength of the signal.
➡️ The target for this pattern is around $10.75–$10.80, which also aligns with the upper VPOC level from the previous range.
➡️ The POC level for BYBIT:TRUMPUSDT.P is $10.159, which may now act as support — this can be a potential entry zone.
➡️ Nearest resistance is at $10.40. A breakout above this level could trigger an impulse move towards $10.75–$10.80.
✅ On the 4H chart , a bearish flag is forming, which could potentially push the price lower — but this scenario hasn't played out yet.
➡️ There's also a local double bottom, confirmed by a price bounce. A retest of the flag’s lower boundary will be a key moment.
Let’s break down the patterns:
✅ 1. Inverted Head & Shoulders (1H) – A classic bottom reversal formation.
➡️ The neckline breakout occurred on increased volume — a key confirmation for a long setup.
✅ 2. Volume (Volume Profile & Bars) – Strong volume spike during the breakout confirms buyer interest.
✅ 3. Price broke out of consolidation – We’ve seen an impulsive breakout and the price is holding above the neckline.
✅ 4. Local Market Structure Break (MSB) – A shift from local downtrend to an emerging uptrend.
📍 Key Point: If the price holds above $10.40, this confirms a breakout from the descending channel, increasing the chance of reaching $10.75–$11.00.
📍 Price must also stay above $10.15 and not fall back into the previous range. A retest and bounce from this level would serve as further confirmation.
📢 If the price drops back below $10.15 and breaks $9.87, the “Inverted Head & Shoulders” pattern will be invalidated. In that case, a bearish trend will likely resume and a short toward $9.50–$9.00 could be considered.
📢 On the 4H chart, the risk of the bearish flag playing out still remains. We are monitoring the structure closely — a sharp pullback is possible.
📢 The volume zone around $10.15–$10.20 is key. As long as the price stays above it — the long scenario remains dominant.
🚀 As of now, BYBIT:TRUMPUSDT.P has strong technical reasons to support a long bias, especially if it holds above $10.40 — that would open the door to $10.75–$11.00.
Risks remain — particularly around the 4H bearish flag — but for now, bullish momentum prevails.
🚀 BYBIT:TRUMPUSDT.P still holds upside reversal potential — LONG scenario remains the priority!
