Official Trump price analysis$Trump coin will probably only go off when and if Trump wins the Nobel Peace Prize. And for this to happen, his activities and rhetoric must change completely... at the moment, it looks "on the verge of fantasy."
Meanwhile: A major investor lost money on TRUMP again - this time $3.3m, he sold 743,947 TRUMP for $7.92m, but did so at a loss.
The irony is that at the very beginning of trading this token, he earned $11.82 million. However, a series of unsuccessful trades resulted in serious losses - now his total loss on $TRUMP has reached $15.7 million.
1️⃣ If by some miracle OKX:TRUMPUSDT manages to break out above the trend price, then we can dream of $14.26 and $17.36
2️⃣ А if, again, he writes, or says, or does something stupid, which is more likely for this personality.... then #Trump at $7-7.2, why not.
Ten times less than the highs... that's where the success is!)
TRUMPUSDT

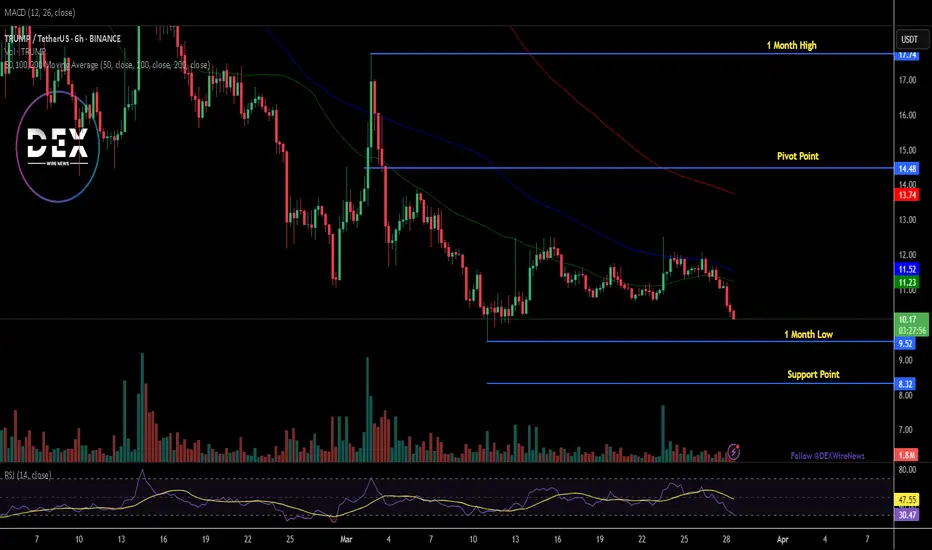
Breaking: $TRUMP Token Dips 10% Reverting to $10 ZoneThe price of OFFICIAL TRUMP coin ($TRUMP) tanked 10% today, falling back to the $10 region. The asset ever since peaking to an all time high of $76, faced insane selling pressure losing about 80% of total value together with its compatriot $MELANIA coin.
For Weeks now, $TRUMP has been circumventing in the $10- $12 zone albeit the crypto market was most of the time in a bloodbath season. For $TRUMP coin, should the bulls push the token above the 38.2% Fibonacci retracement point, that may be the catalyst the token needs to spark a bullish renaissance as hinted by the Relative Strength Index (RSI) at 30- pointing at the disparity $TRUMP has to capitalise and make a bullish move.
Similarly, the 1-month low is serving as support point for $TRUMP should extreme selling pressure push the token lower.
OFFICIAL TRUMP Price Live Data
The live OFFICIAL TRUMP price today is $10.21 USD with a 24-hour trading volume of $517,239,338 USD. OFFICIAL TRUMP is down 8.71% in the last 24 hours. The current CoinMarketCap ranking is #45, with a live market cap of $2,041,294,317 USD. It has a circulating supply of 199,999,430 TRUMP coins and a max. supply of 999,999,993 TRUMP coins.
TRUMP/USDT:BUY LIMITHello friends
Given the price growth, now that the price is correcting, you can buy in steps and be careful to ensure that capital management is followed.
*Trade safely with us*

TRUMP in coming days ...Currently, TRUMP is forming an ascending triangle, indicating a potential price increase. It is anticipated that the price could rise, aligning with the projected price movement (AB=CD).
However, it is crucial to wait for the triangle to break before taking any action.
Give me some energy !!
✨We spend hours finding potential opportunities and writing useful ideas, we would be happy if you support us.
Best regards CobraVanguard.💚
_ _ _ _ __ _ _ _ _ _ _ _ _ _ _ _ _ _ _ _ _ _ _ _ _ _ _ _ _ _ _ _
✅Thank you, and for more ideas, hit ❤️Like❤️ and 🌟Follow🌟!
⚠️Things can change...
The markets are always changing and even with all these signals, the market changes tend to be strong and fast!!

TRUMP(UPDATE)Hello friends
Given the good price growth, now in the pullbacks that the price makes, we can buy in the specified support areas and move with it to the specified targets.
Of course, with capital and risk management...
*Trade safely with us*

TRUP/USDT in the coming hoursHello everyone, let's look at the 4H TRUMP to USDT chart, in this situation we can see how it has come out of the triangle on top and currently we can see a fight with the current resistance at $11.45, in a situation when it comes out of it on top it can go towards the targets at the levels:
T1 = $11.89
T2 = $12.58
Т3 = $13.08
Now let's move on to the stop-loss in case the market continues to fall:
SL1 = $11.06
SL2 = $10.40
SL3 = $9.76
When we look at the RSI indicator we can see how on the 4h interval we have come out of the range on top, which however in the short term may give an attempt to recover the price or a temporary sideways trend.

TRUMPUSDT - Is this your worst investment?I guess so because this was so hyped and its so hyped it fell down to the brim, Falling to the brim and what amazes me is the volume spike is not permanant!

TRUMP buy/long setup (4H)It seems that a diametric has completed on the chart. However, Wave G is suspected not to have fully ended yet, and only a part of Wave G might be complete.
A trigger line has been broken, and a support zone has formed, where short-term trades or scalping opportunities can be considered.
As you know, this is a meme coin and carries risk, so make sure to manage leverage and capital properly.
Targets are marked on the chart—secure profits at each target.
The closure of a 4-hour candle below the invalidation level will invalidate this analysis.
For risk management, please don't forget stop loss and capital management
Comment if you have any questions
Thank You

TrumpHello Traders,
Today we are posting a trade we see that we know you are all eyeing. BINANCE:TRUMPUSDT
This is a trade we saw in our weekly trade hunt. If you are not familiar in TA and have a hard time understanding the chart feel free to reach out to us and we will happily help you understand.
Stay profitable,
Savvy

TRUMPUSDT LongConsolidation between 11 - 14,5 levels on Trump H4 chart, Now price is at support zone. We can buy at catch this small uptrend. Risk reward 1/2

OFFICIAL TRUMP 8X Trade-Numbers (3,656%)Patience is absolutely necessary. This is the same chart setup we have been tracking for months now. Well, weeks actually. And this is a good chart setup.
The fact that the project is heavy, a big market cap., makes it harder to manipulate, but, whales are still whales and they can easily shake the market at all times.
When in doubt, reduce leverage.
We are doing high leverage, high risk. You can use this same chart setup with 3-5X and have very low risk. You can use this same chart setup with 15-20X and have extreme high risk. The numbers are for illustration purposes only. Leveraged trading is for advanced traders. That is, the player needs to be able to adapt to market conditions and adapt the numbers to personal conditions.
Needless to say, if you have a strong track record and capital you can use higher risk. If you have a record of being nervous and anxious and making simple mistakes then you must go with spot or 1-2X. Remember, if you can't make money trading spot, you won't be able to make money trading lev. Spot trading is like chess. Strategic and advanced. Leveraged trading is like 5D chess, the complexity goes off the chart. But we can keep it simple.
Find the right chart, buy and hold.
If you keep the risk small you can have an easy win. You are responsible for your own actions.
If you cannot handle a big win, then do not trade.
If you cannot handle a simple loss, please, go away.
It is unproductive to blame others for your mistakes. You move the mouse, you make the deposits, you choose which pair to buy, by how much and when. If you cannot bear the weight of your actions, do not trade.
If you can... Welcome to TradingView.
Here you have the full trade-numbers for TRUMPUSDT. Great timing. Great chart setup, medium-risk. An extremely high potential for profits.
_____
TRUMPUSDT
Leverage: 8X
Entry levels:
1) $14.0
2) $12.5
3) $11.7
Targets:
1) $16.2
2) $19.4
3) $21.7
4) $24.6
5) $27.8
6) $29.7
7) $33.0
8) $38.1
9) $41.8
10) $46.5
11) $60.1
12) $73.6
Stop-loss:
Close weekly below $11.65
Potential profits: 3656%
Capital allocation: 3%
_____
This is life. I am life. I love this life and this world.
Thanks a lot for your continued support.
As long as you persist and learn from all the actions that you make, good or bad, you will improve and you will succeed in this game.
Nothing can stop you. You are bound to achieve success.
The only way to lose is to give up.
I can never give up.
I will never give up.
I will only take a break to recharge and reload.
When I am refreshed and ready, I am trading once more.
This time around, I am taking the money home.
Namaste.

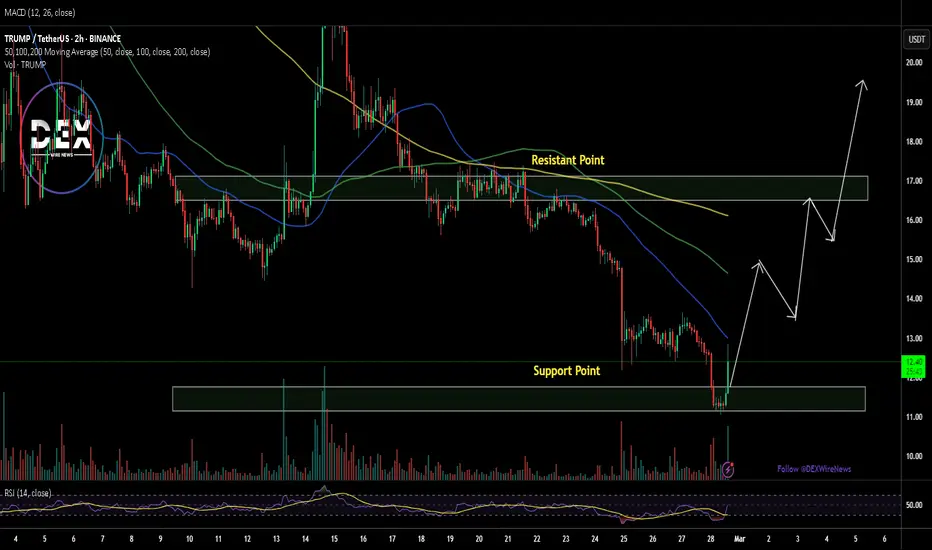
OFFICIAL TRUMP: Bullish Potential Invalidated? Back To 1,000%+As can be seen here, price action moved below our defined support (now resistance). The question naturally arises, is the previous analysis now invalid? Quick answer, no! We are still bullish and I will explain why.
It is true that the break above resistance makes this chart ultra-bullish, so moving back below can be considered an invalidation. The truth is that the low yesterday is still a higher low compared to 28-Feb. when the All-Time Low was hit. We have both a higher low and also a green close, the session yesterday ended green as a hammer which is bullish.
The bullish case is weaker now in the short-term but the bullish bias and potential remains intact. TRUMPUSDT is set to grow; patience is key.
The low is in and this low was followed by a high volume bullish breakout. This breakout is followed by a retrace, which is a classic and this retrace ends as a higher low. This is standard price action. From this higher low TRUMPUSDT can and will grow.
Even if the market decides to shakeout more people out, we are bullish long-term. You know what I love to say; once we hit bottom, the only place left to go is up.
Notice in early 2025 there is a clear downtrend on the chart. Now, instead of a downtrend the action is sideways. This is the transition period. First down, then sideways and then up.
We are going up next. It can take a few months, a few weeks or simple just a few days.
The potential for growth here is as good as with any other pair.
Thanks a lot for your continued support. It is truly appreciated.
Namaste.

TRUMP/USDT(BUY)hello friends
Due to the correction of the price and the breaking of the resistance, we can now buy with risk management and move to the specified goals.
*Trade safely with us*

trumpMy personal take is this: We have a support box that has been identified and if it breaks for any reason, it can go all the way to the blue lines, but whatever high it makes in the short term, we need to see what it does to the red lines.

#TRUMP/USDT#TRUMP
The price is moving in a descending channel on the 1-hour frame and is expected to continue upwards
We have a trend to stabilize above the moving average 100 again
We have a descending trend on the RSI indicator that supports the rise by breaking it upwards
We have a support area at the lower limit of the channel at a price of 12.50
Entry price 13.00
First target 13.53
Second target 14.31
Third target 15.06


OFFICIAL TRUMP: It Is Still Early 4 773% —111% & 333% Short-TermIt is still early. Great news.
In this chart we have a classic, the stop-loss hunt event.
TRUMPUSDT moved below support just to quickly recover. Support here is mapped as the 10-February low. The break above support produced a really strong, full green candle with really high volume.
This is a confirmed bullish breakout.
It is still early.
It is still early because of the stop-loss hunt event. The stop-loss hunt event only happens at bottom prices. Even though there was a strong move, relatively speaking (reading-writing), this move produced a recovery from a true bottom. Now that the action is happening above support, we can expect a bullish wave to develop.
The chances for lower prices are really low. Don't get me wrong, it is still possible to see a shakeout, another one, but this is very unlikely. Notice how high the volume is when prices move up. Now, notice how low the volume is when prices move down. The bears have no force, no momentum, no excuses left. In fact, many people were selling Bitcoin and many Altcoins at the bottom and now they have to buy at higher prices. They will never sell. Those that were already holding strong, won't sell either. We are all ready to hold.
The market is going up which is great news for all those involved.
Here we have a nice 773% target. It is still early.
We have an easy target at $34 for 111%.
Another target around $70 yields 333%.
Patience is key. Our strategy stays the same.
Accumulate as much as you can and then wait.
Each time you get paid, the money goes into Crypto; the market will take care of the rest.
Thank you for reading.
Namaste.

Trump New Update (2H)It seems that the TRUMP symbol is forming a Diametric pattern and is currently aiming to complete wave F.
As long as the green zone holds, the price can move toward the red box.
A 4-hour candle close below the invalidation level would invalidate this analysis.
For risk management, please don't forget stop loss and capital management
Comment if you have any questions
Thank You

TRUMP COIN NEXT POSSIBLE MOVES AND TRADE IDEAS !!$TRUMP Coin Update & Possible Moves!!
• Two Support areas are marked on chart 12.80$-12.30$ where you are able to build trade on it🫡
Warning : That's just my idea if i take trade i will Update.. DYOR Before Taking any action🚨
D

$TRUMP Coin on the Verge of a Major Breakout: Can It Reach $30?The cryptocurrency market is buzzing with excitement as $TRUMP coin approaches a critical resistance level. Currently trading near $17, the token has already broken a significant Break of Structure (BOS), hinting at a potential bullish surge. If $TRUMP successfully breaches this resistance point, technical indicators suggest a remarkable 200% rally, pushing the price toward $30.
Technical Analysis
A closer look at $TRUMP’s daily chart reveals key bullish signals:
The $17 mark has proven to be a significant resistance level. A confirmed breakout could trigger a strong uptrend, with $30 as the next major target. The Relative Strength Index (RSI) is currently at 48, indicating neutral momentum. However, with buying pressure increasing, RSI could soon move into the bullish zone, reinforcing the uptrend.
The token's recent candlestick formations suggest a bullish engulfing pattern, which often precedes a strong rally. The $11 price point has emerged as a crucial support level. If this level holds, bulls could maintain momentum. However, a break below $11 may lead to a strong sell-off.
Trump Organization’s Metaverse & NFT Plans
The Trump Organization has officially filed a trademark application for 'TRUMP' to launch a metaverse and NFT trading platform. This development aligns with the growing trend of Web3 adoption by prominent figures and institutions.
A metaverse and NFT ecosystem tied to the Trump brand could significantly increase interest in $TRUMP coin, driving speculative demand and institutional involvement. If the project gains traction, it could serve as a major long-term growth factor for the token’s valuation.
What’s Next for $TRUMP Coin?
With both technical and fundamental indicators aligning, $TRUMP coin is at a pivotal moment. The key level to watch remains the $17 resistance. A decisive breakout could ignite a major rally toward $30, while failure to hold above support at $11 might trigger a correction.
#TRUMPUSDT – Bearish Scenario, Breakout Down📉 SHORT BYBIT:TRUMPUSDT.P from $12.278
🛡 Stop Loss: $12.599
⏱ 1H Timeframe
⚡ Trade Plan:
✅ The BYBIT:TRUMPUSDT.P price has formed a Bearish Flag and broke its lower boundary, confirming a bearish scenario.
✅ The asset is trading below POC (Point of Control) at $12.978, indicating strong seller dominance.
✅ Increasing volume on the breakdown further confirms the strength of the downward move.
🎯 TP Targets:
💎 TP 1: $12.100
🔥 TP 2: $11.900
⚡ TP 3: $11.785
📢 A close below $12.278 would confirm further downside movement.
📢 POC at $12.978 is a strong resistance level that the price failed to break.
📢 Increasing volume on the drop supports the bearish outlook.
📢 Securing partial profits at TP1 ($12.100) is a smart risk-management strategy.
🚨 BYBIT:TRUMPUSDT.P remains in a downtrend – monitoring for continuation and securing profits at TP levels!

OFFICIAL TRUMP : Urgent Update (Complete Meltdown —Now 700% Pot)Good evening my friends, I have a much needed update for you for the TRUMPUSDT pair and chart.
First, you can buy and continue buying and buy more, because, regardless of the short-term action what follows this situation we are witnessing now is growth. You can be certain about it.
The previous chart setup we looked at had a complete breakdown. This breakdown is a "weak" lower low. This is weak because the previous low happened at $14 and the current one at $12. Which means that this is a market induced shakeout.
Now that support has been broken and TRUMPUSDT is trading lower we need to consider a new entry.
The spot trading strategy is to buy each time prices drop. Each time TRUMPUSDT moves lower we buy and reload. If we are left without ammunition (capital), we simply wait/hold. Nothing changes for waiting a few days.
If you trade with leverage then you need a new entry as the previous position more likely than not has been liquidated, depending on the amount of leverage you use.
The next strong support is $11.83 based on Fib. retracement. This level hasn't been hit. Any trading above this level can be considered a good entry (above support).
Volume is low on the drop. We have a lower low but volume is lower. This means that the bearish move is losing force. Soon, we are going up.
The market gives. The market takes.
Patience is key.
We will soon enter a marketwide bullish phase. (March 2025)
Thank you for reading.
Feel free to message if you have any questions.
Namaste.

#TRUMPUSDT – Bearish Scenario, Expecting a Downward Breakout📉 SHORT BYBIT:TRUMPUSDT.P from $12.492
🛡 Stop Loss: $12.785
⏱️ 1H Timeframe
⚡️ Trade Plan:
✅ The BYBIT:TRUMPUSDT.P price continues to decline after a recent sharp drop.
✅ The chart shows that the asset is consolidating below POC (Point of Control) at $13.105, indicating seller dominance.
✅ The price is testing a support level, and a breakdown could trigger a stronger bearish move.
🎯 TP Targets:
💎 TP 1: $12.305
🔥 TP 2: $12.110
⚡️ TP 3: $11.966
📢 A close below $12.492 would confirm the downward move.
📢 POC at $13.105 is a key volume area that now acts as resistance.
📢 Increasing volume on the decline supports the bearish trend.
📢 Securing partial profits at TP1 ($12.305) is a risk-management strategy.
🚨 BYBIT:TRUMPUSDT.P remains under pressure – monitoring for a confirmed breakdown and securing profits at TP levels!
