TrueFi (TRU)#TRU
The price is moving within a descending channel on the 1-hour frame and is expected to break and continue upward.
We have a trend to stabilize above the 100 moving average once again.
We have a downtrend on the RSI indicator that supports the upward break.
We have a support area at the lower limit of the channel at 0.0270, acting as strong support from which the price can rebound.
We have a major support area in green that pushed the price upward at 0.0260.
Entry price: 0.0275
First target: 0.0281
Second target: 0.0290
Third target: 0.0301
To manage risk, don't forget stop loss and capital management.
When you reach the first target, save some profits and then change the stop order to an entry order.
For inquiries, please comment.
Thank you.
Trustwallet

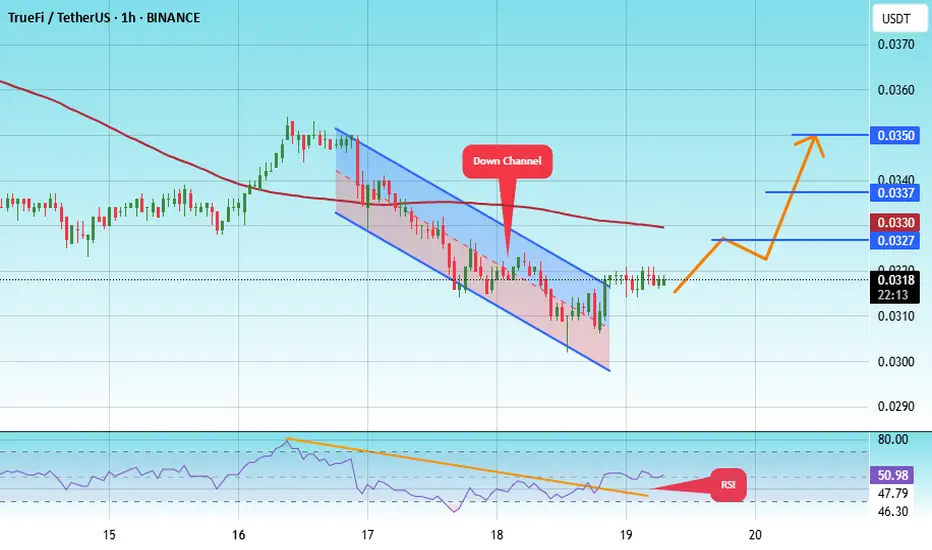
#TRU/USDT#TRU
The price is moving within a descending channel on the 1-hour frame, adhering well to it, and is heading towards a strong breakout and retest.
We are experiencing a rebound from the lower boundary of the descending channel. This support is at 0.0300.
We are experiencing a downtrend on the RSI indicator, which is about to break and retest, supporting the upward trend.
We are in a trend of consolidation above the 100 Moving Average.
Entry price: 0.0315
First target: 0.0327
Second target: 0.0337
Third target: 0.0350
univers Of Signals | TWT: Navigating Trust Wallet's Market Moves👋 Welcome to univers Of Signals !
In this analysis, I'll be reviewing the TWT coin, a part of the Trust Wallet project, which is currently ranked 126th on CoinMarketCap with a market cap of $358 million.
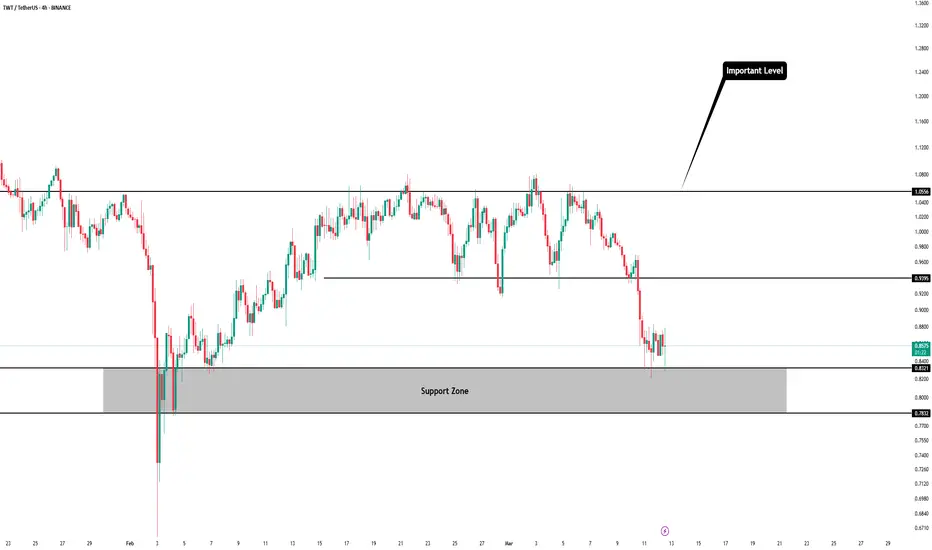
📅 Daily Timeframe
As you can see in the daily timeframe, we're observing a very large range box from 0.7832 to 1.5725, where the price is currently near the bottom of this box.
✅ The floor of this box is a significant support range from 0.7832 to 0.8321 and is acting as a demand zone for the price.
🔽 Currently, the price has reached the 0.8321 area, tested it once with a shadow, and received support from it. If this area breaks, we'll enter the support zone, and we'll need to see how the price reacts to this zone.
📊 The market volume is very low, and for now, it seems there isn't enough strength and momentum in the market to break this area, but if a selling volume enters the market and the RSI goes into oversell, the likelihood of breaking this area increases. In this case, the next support will be at 0.6215.
🛒 For buying this coin, I recommend waiting until it exits the range box it has created, as this would indicate upward momentum entering the market. Currently, there is no momentum in the market. Thus, the best trigger from my perspective is the breakout at 1.5725.
📈 However, for a long position or a risky spot purchase, you could enter upon the breakout of 1.0556. I mainly consider this trigger for futures, and for spot purchases, I would wait until the main resistance is broken.
⏳ 4-Hour Timeframe
In the 4-hour timeframe, as you see, we had a box between 0.9395 to 1.0556, which has been cleanly broken from below, and you could open a short position with price consolidation below this area.
💥 Currently, the price has reached the next support at 0.8321 and has shown some reaction. The RSI is currently in oversell, and if it receives support from this area, it could return to the normal range.
📉 For short positions, the triggers at 0.8321 and 0.7832 are suitable. The 0.8321 trigger is riskier, and I suggest waiting until the 0.7832 support is lost before opening a more secure position.
🔼 For long positions, there's a very suitable ceiling at 1.0556, and breaking this area could lead to opening a long position.
📝 Final Thoughts
This analysis reflects our opinions and is not financial advice.
Share your thoughts in the comments, and don’t forget to share this analysis with your friends! ❤️
TradeCityPro | TWT: Navigating Trust Wallet's Market Moves👋 Welcome to TradeCityPro!
In this analysis, I'll be reviewing the TWT coin, a part of the Trust Wallet project, which is currently ranked 126th on CoinMarketCap with a market cap of $358 million.
📅 Daily Timeframe
As you can see in the daily timeframe, we're observing a very large range box from 0.7832 to 1.5725, where the price is currently near the bottom of this box.
✅ The floor of this box is a significant support range from 0.7832 to 0.8321 and is acting as a demand zone for the price.
🔽 Currently, the price has reached the 0.8321 area, tested it once with a shadow, and received support from it. If this area breaks, we'll enter the support zone, and we'll need to see how the price reacts to this zone.
📊 The market volume is very low, and for now, it seems there isn't enough strength and momentum in the market to break this area, but if a selling volume enters the market and the RSI goes into oversell, the likelihood of breaking this area increases. In this case, the next support will be at 0.6215.
🛒 For buying this coin, I recommend waiting until it exits the range box it has created, as this would indicate upward momentum entering the market. Currently, there is no momentum in the market. Thus, the best trigger from my perspective is the breakout at 1.5725.
📈 However, for a long position or a risky spot purchase, you could enter upon the breakout of 1.0556. I mainly consider this trigger for futures, and for spot purchases, I would wait until the main resistance is broken.
⏳ 4-Hour Timeframe
In the 4-hour timeframe, as you see, we had a box between 0.9395 to 1.0556, which has been cleanly broken from below, and you could open a short position with price consolidation below this area.
💥 Currently, the price has reached the next support at 0.8321 and has shown some reaction. The RSI is currently in oversell, and if it receives support from this area, it could return to the normal range.
📉 For short positions, the triggers at 0.8321 and 0.7832 are suitable. The 0.8321 trigger is riskier, and I suggest waiting until the 0.7832 support is lost before opening a more secure position.
🔼 For long positions, there's a very suitable ceiling at 1.0556, and breaking this area could lead to opening a long position.
📝 Final Thoughts
This analysis reflects our opinions and is not financial advice.
Share your thoughts in the comments, and don’t forget to share this analysis with your friends! ❤️

Long Entry Signal for TWT/USDTBased on the daily chart for TWTUSDT on Bybit, here's a concise analysis:
MLR vs. SMA: The MLR (blue) is above the SMA (pink), indicating a bullish trend.
MLR vs. BB Center: The MLR is above the BB Center Line (orange), suggesting bullish momentum.
PSAR: The PSAR dots (black) are under the price, confirming a bullish trend.
Price vs. SMA 200: The price is above the 200-period SMA (red), supporting a long-term bullish trend.
Current Strategy: Since all entry conditions for a long position are met (MLR above SMA, MLR above BB Center, PSAR under price, price above SMA 200), you might consider entering a long position.
Stop Loss (SL): Set the stop loss at the current level of the PSAR dots to manage risk.
Monitor My Idea: Keep monitoring my idea for any changes in trend or for potential profit-taking opportunities.

TradeCityPro | TWT: Trust Wallet Token's Market Moves👋 Welcome to TradeCityPro!
In this analysis, I want to examine the TWT coin for you. This coin is associated with Trust Wallet, which you are undoubtedly familiar with and have used. It's a very user-friendly wallet that even beginners can use easily. Currently, TWT has a market cap of $382 million and is ranked 142 on CoinMarketCap.
📅 Weekly Time Frame
In the weekly timeframe, after the price reached the area of 2.7081, which was also the ATH, a corrective phase in the market began and continued down to 0.7072.
🔍 During this period, we also had an ascending trendline accompanying the upward trend, which was broken. After a pullback to the trendline area at 1.6072, a price range box between 0.7072 and 1.6072 has formed, with several supports and resistances occurring at the box's floor and ceiling.
📊 The market volume has been decreasing since the pullback and is gradually declining, compressing the price further. A breakout above 1.6072 could potentially initiate an uptrend. If the box's support fails, there are two short-term supports at 0.5774 and 0.4761, though these are not very significant. The main support is at 0.2960.
⚡️ Moreover, the RSI in its chart has a support area at 38.44, which is also significant. A break of this area in conjunction with a break below 0.7072 in the chart could confirm the entry of significant bearish momentum.
🛒 For spot buying, the trigger at 1.6072 is appropriate. If the price consolidates above this area, we can expect it to move towards the ATH and test this area again.
🔽 As I mentioned, the ascending trendline has been broken and has been pulled back to, so if the trendline trigger at 0.270 activates and this support breaks, we can expect the price to move towards the trendline target of 0.2960.
📝 Final Thoughts
This analysis reflects our opinions and is not financial advice.
Share your thoughts in the comments, and don’t forget to share this analysis with your friends! ❤️

#TRU/USDT#TRU
The price is moving in a descending channel on the 1-hour frame and is adhering to it well and is heading to break it strongly upwards and retest it
We have a bounce from the lower limit of the descending channel, this support is at a price of 0.0350
We have a downtrend on the RSI indicator that is about to break and retest, which supports the rise
We have a trend to stabilize above the moving average 100
Entry price 0.0438
First target 0.0511
Second target 0.0553
Third target 00630

TWTHey
My idea is that GLOBAL correction on TWT is developing
Wave C either truncated and already completed or will reach my initial target 2-2.20$
Join me on X

#TRU/USDT Ready to go higher#TRU
The price is moving in a descending channel on the 30-minute frame and sticking to it well
We have a bounce from the lower limit of the descending channel, this support is at 0.0780
We have a downtrend on the RSI indicator that is about to be broken, which supports the rise
We have a trend to stabilize above the moving average 100
Entry price 0.0795
First target 0.0810
Second target 0.0836
Third target 0.0863

#TRU/USDT#TRU
The price is moving in a descending channel on a 30-minute frame and is expected to continue upwards
We have a trend to stabilize above the moving average 100 again
We have a descending trend on the RSI indicator that supports the rise by breaking it upwards
We have a support area at the lower limit of the channel at a price of 0.1200
Entry price 0.1200
First target 0.1250
Second target 0.1300
Third target 0.1370

Twt ( trust wallet token )Twt usdt analysis
Time frame 4 hours
Risk rewards ratio >3 👈👌
First target 1.2$

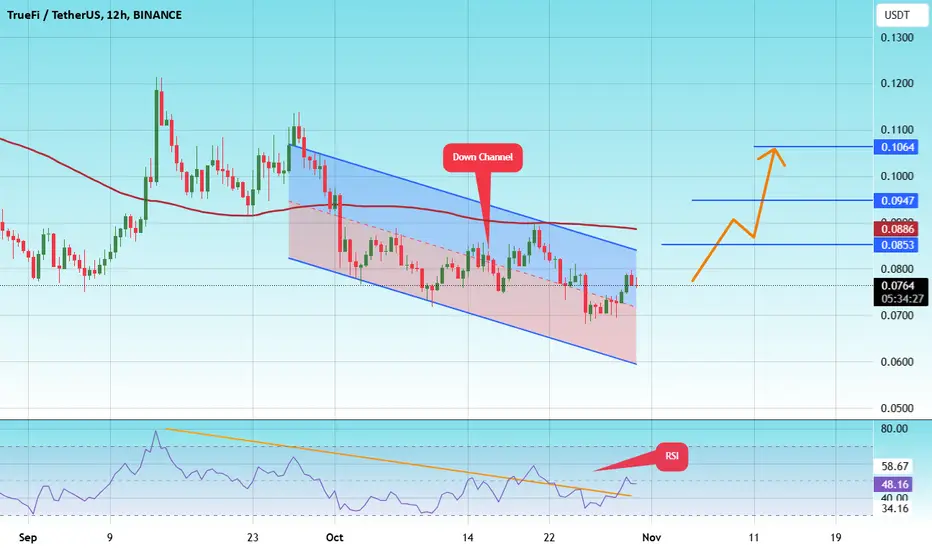
#TRU/USDT#TRU
The price is moving in a downward channel on the 12-hour frame upwards and is expected to continue
We have a trend to stabilize above the moving average 100 again
We have a downward trend on the RSI indicator that supports the rise by breaking it upwards
We have a support area at the lower limit of the channel at a price of 0.0763
Entry price 0.0764
First target 0.0853
Second target 0.0946
Third target 0.1064
Trust Wallet TokenTrust Wallet Token
#TWT is expected to finish wave (2) between $0.4227 : $0.2281
The stop-loss shall be below $0.2281 (yet it's preferable to be taken as a long term investment).
The first target should be a new ATH.

#TRU/USDT#TRU
The price is moving within a bearish channel pattern on the 12-hour frame, which is a strong retracement pattern and was broken to the upside.
We have a bounce from a major support area in green at 0.0900
We have a tendency to stabilize above the Moving Average 100
We have a downtrend on the RSI indicator that supports the rise and gives greater momentum, and the price is based on it to rise after it was broken upward.
Entry price is 0.1250
The first target is 0.1800
The second target is 0.2100
The third goal is 0.2472

Trust Wallet (TWT)TWT has one of the easiest pattern for future traders and like to repeat its pattern over and over again
Trust Wallet price today is $1.08 with a 24-hour trading volume of $11 million and the price is up 4.9% in the last 24 hours. It has a circulating supply of 420 million tokens and a total supply of 1 billion
Trust Wallet token is a utility token that can only be used within the trust wallet app.What are the Incentives of (TWT)? Governance token that will be used by anyone who wants to take part in making decisions for adding new blockchain support, tokens and product features. Discounts on DEX services and purchasing crypto within the app. Collectible Marketplace, anyone interested in trading, selling or buying digital collectibles can utilize the token in a user-friendly environment.
1.2 is a good time to take some profit as well

TWT We're at a local bottom!! +100% easyThis is one of the strongest and most promising projects out there, poised for significant growth in the very near future! We're at a local bottom, backed by a solid support zone. It's a buy zone, folks! Don't sell, buy more! 🚀💪

#TWT #trustwallet looks bearishBearish head and shoulders formed in 1D candle structure. Not financial advice.

TWT Premium SignalYou bet! Alright, let's dive in! The TWT vibes are looking seriously strong! We've been in a long-term accumulation phase, and those weak hands have already sold off. Our first target is gonna be testing that trend line. And then, watch out for the second target at $3, where we'll be cashing out. But hey, remember to always do your own research. Trust but verify, right? Let's keep riding this wave, but keep those eyes peeled and your instincts sharp. It's gonna be a wild ride! 🚀🌊

TWT/USDT Success reclaimed! Potential continue the upward move.💎 TWT has undoubtedly garnered considerable attention within the market. It successfully reclaimed and broke out from a previously challenging resistance zone.
💎 This development increases the likelihood of witnessing significant upward momentum, potentially leading to a move toward our targeted strong resistance area.
💎 However, should TWT retreat for a retest and subsequently fail to maintain the support level, there's a risk of reverting to a scenario reminiscent of a false breakout. This would result in a retracement back to the demand area around 1.24.
💎 If TWT finds itself at the demand zone but fails to elicit a robust response, indicating a lack of bounce, there's a possibility of a breakdown below the demand zone. Such a scenario could trigger further downward movement, potentially reaching the significant support area.

TWT/USDT Indicating upward move and is attempting to break out.💎 TWT has notably made its mark in the cryptocurrency market. Currently, TWT ispoised for an upward move and is attempting to break out of the supply area.
💎 If TWT successfully breaks above the resistance area, it could probability reach our target area in the bearish OB zone.
💎 However, if TWT fails to break out above the resistance area, there is a possibility of a retracement back to the support area around $1.4 - $1.3 to establish new momentum.
💎 In the support area, TWT needs to bounce and resume its upward movement to attempt another breakout above the supply. Failure to hold the support and a breakdown below could signal a shift to a bearish trend, potentially leading to a return to the demand area.

#TRU/USDT#TRU
The price broke the descending triangle upward
Drawing support from the green support area
We have support from the RSI indicator
We have a higher stability of Moving Average 100 that supports the rise
Entry price is 0.05600
The first target is 0.06300
The second target is 0.06853
The third goal is 0.07532

TWT/USDT Rejected and back to retesting. Could Breakout ??💎 TWT has recently encountered notable market dynamics. After a strong rejection upon testing the supply area, there's potential for the price to retreat to the demand area to gather new momentum.
💎 If the breakout from the demand area is valid, the price can reach the probability of our target area. However, if the breakout fails, the price may retreat to the Bullish Order Block (OB) area.
💎 The Bullish OB area has historically shown strength in supporting TWT's price, making it crucial for a bounce when the price reaches this level.
💎 Failure to bounce, leading to a breakdown of this area, could signify bearish sentiment and prompt further downward movement in the price. Traders should monitor price action carefully around these key levels to gauge potential market direction.

TWT good to longDYOR
as shown SEED_DONKEYDAN_MARKET_CAP:TWT now formed double reversal buttom ,if it breaks it ll go up for the next high targets
dyor before entry.
