The Ugly Truth of Technical Analysis...Even though this may be an extremely unpopular opinion on this topic, realizing this simple truth may be what makes or breaks a profitable trader. The truth is this...
Drawing lines on a chart does not predict any price movement, and there are more factors in play than simply price action
It doesn't matter what the gurus on the internet say about some "secret strategy" or a "secret indicator", anyone with common sense should automatically ignore content like that. Firms like NYSE:JPM , NYSE:GS , NYSE:MS , etc. , spend billions upon billions of dollars just to figure out how to trade the market with efficiency, but some random 19 year old on the internet figured out how to beat these mega-firms with a free indicator. Yeah right.
However, I'm not saying that technical analysis doesn't work or that it shouldn't be used; I'm simply saying to reconsider your strategy and use common sense before donating your money to Wall Street banks. Below is an example of technical analysis working perfectly on NYSE:UNH for the 1D timeframe looking back into April of last year.
This would have been a textbook channel breakout trade, in which the trader takes a short when the bottom trendline is broken (or the candle closes below the trendline). It would have resulted in a maximum of 17% gain on naked short shares if the bottom penny is the exit price (which is virtually impossible). So there you have it... technical analysis works perfectly and I have proven myself wrong.... right? No. . Now let me show you what really happened. Here is the same exact chart, but this time with a piece of key information shown.
As it turns out, there was nothing technical in play at all in this price action, but rather a "fundamental" or a "tangible" aspect was the price driver. An example like this should also show you that not providing sufficient information and taking charts out of context can be done by literally anyone. If you think you can predict the future with some geometric shapes, bars, and non financial, fundamental, or tangible analysis, better than the top Wall Street firms, I say good luck to you.
WITH THAT BEING SAID, this does not mean that trendlines, price areas, value gaps, and other technical indicators are completely invalid, but it does mean that there is more to the story than what is on the chart. Always review news, sentiment, financials, analyst ratings, and other key oscillators to gauge every trade.
Disclaimer: The indicators used on the chart are only for illustrative purposes of a cluttered chart. I am neither saying that they are accurate nor inaccurate.
Truth

#TRU/USDT Ready to go higher#TRU
The price is moving in a descending channel on the 30-minute frame and sticking to it well
We have a bounce from the lower limit of the descending channel, this support is at 0.0780
We have a downtrend on the RSI indicator that is about to be broken, which supports the rise
We have a trend to stabilize above the moving average 100
Entry price 0.0795
First target 0.0810
Second target 0.0836
Third target 0.0863

#TRU/USDT#TRU
The price is moving in a descending channel on a 30-minute frame and is expected to continue upwards
We have a trend to stabilize above the moving average 100 again
We have a descending trend on the RSI indicator that supports the rise by breaking it upwards
We have a support area at the lower limit of the channel at a price of 0.1200
Entry price 0.1200
First target 0.1250
Second target 0.1300
Third target 0.1370

Sorry its been a minute, Happy Sunday, Pepe drop on the way..I hope everyone has been well, update on Pepe, 15 min timeframe, all of the lines are my measured moves, I expect Pepe to continue its decent to the downside, I stop counting after 15 layers of confluence and typically my T.A is anywhere from 3 days to a week out, Happy trading, my take profit is 0.000000878888

BTC Down, Call me Mr. BigShort...Bitcoin back to 25,500In case you have not figured it out, Bitcoin is coming back down without a doubt, sure there pump fakes and liquidity traps along the way blah blah blah, but the point is we are going lower, I don't want to scare you with the real number, but your boy here does number's Trust. Next stop 25,500, set your stops outside of anywhere price has previously wicked to. Happy trading folks

selby_exchange - BTCUSD - $36290 Price/Time Forecast (8h)Selby Price/Time Forecast for BTCUSD Bitcoin
Timeframe: 8 Hour interval
June 2023 - July 2023
Exchange: COINBASE USD Pairing
Forecast: $36290 (July 3rd 2023)
Custom ratio extension levels
Lunar Cycles
Fibline Glance Moving Average (squeeze)
Selby finding creative patterns in charts on Tradingview
Not advice for investing, but I am one to watch
Rebellion=Change=Future

selby_exchange - BTCUSD Selby Geometric Extrapolation v18.1 (4D)Selby Geometric Extrapolation Structure for BTCUSD Bitcoin
Version: 18.1
Timeframe: 4DAY interval
March 2020 - October 2025
Exchange: PHEMEX Perpetual Futures Contract
Forecast: $142885 - $166677 (Feb 2024 thru Sept 2025)
With 'standard' fibonacci extension levels for multiple new (ATH's) all time highs
Selby finding creative patterns in charts on Tradingview
Not advice for investing, but I am one to watch
Rebellion=Change=Future

selby_exchange - BTCUSD - Selby Bitcoin CreativeSelby Creative Charting for BTCUSD Bitcoin
BTCPERP - Inverse Perpetual Futures Contract - 1Hour and 4Hour - PHEMEX - Heikin Ashi
"2023 Collection of triangles showing bullish and bearish trends."
Selby finding creative patterns in charts on Tradingview
Not advice for investing, but I am one to watch
Rebellion=Change=Future

selby_exchange - BTCUSD Selby Geometric Extrapolation v18.0 (1W)Selby Geometric Extrapolation Structure for BTCUSD Bitcoin
Version: 18.0
Timeframe: 1WEEK interval
March 2020 - October 2025
Exchange: PHEMEX Perpetual Futures Contract
With 'standard' fibonacci extension levels for multiple new (ATH's) all time highs
Selby finding creative patterns in charts on Tradingview
Not advice for investing, but I am one to watch
Rebellion=Change=Future

Short TrumpF' trump. Dude is the worst business man ever seen. Anyone who does biz with the guy gets rekt. DWAC is also headed for worse. There's a gap at the lows. Let's run it by following the curve

selby_exchange - BTCUSD - Geometric Extrapolation Structure Selby Geometric Extrapolation Structure Chart in Logarithmic for Bitcoin
*this is a potential long entry for Bitcoin, if price falls below blue forecast arc the chart becomes invalidated*
BTCUSD 12hr
July 11, 2022 - March 6, 2023
With standard fibonacci extension levels
Selby finding creative patterns in charts on Tradingview
Not advice for investing, but I am one to watch
Rebellion=Change=Future

DWAC Dead Cat BounceIf Elon Musk doesn`t buy Twitter, that doesn`t mean he`s affiliated with Truth Social.
If you haven bought DWAC they announced the merger:
or short it at $55:
then this rally today seems to me the perfect opportunity to buy $10 puts expiring early 2023.
Not because i don`t believe in the project, but because it`s overvalued at this point.
The market cap should go down.
You can buy most of the SPACs lower than the original price.
I think this will be the case with DWAC too by Jan 2023.
Looking forward to read your opinion about it.

DWAC (Truth Social) Looks Ready To Recover (200% Potential)Truth Social SPAC DWAC looks about ready to recover.
A very strong correction took place since early March this year that resulted in a total 78.40% loss of value.
Now we are getting early signals that things are about to change.
The current price action smells to liquidity hunt.
A break below support just to quickly reverse.
As usual, bottomed out;
Very low risk with high potential rewards.
You can find the targets and stop-loss details on the chart.
Namaste.

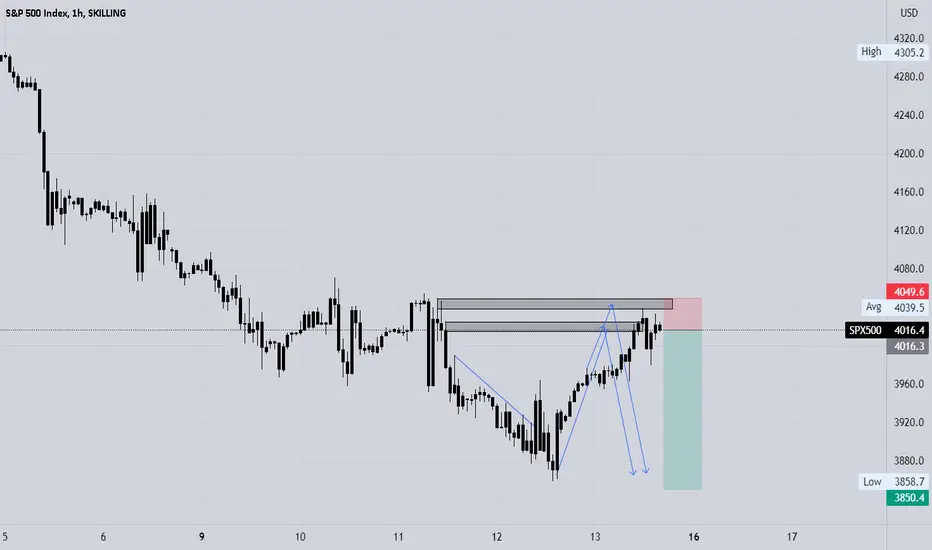
spx500 sell fundementals, technicals, and sentiment.SPX500 is tanking due to the fact that the fed is increasing the interest rate up to 5% which will destroy the consumption economy in America. Consumption is two-thirds of the American economy. Americans will have less money to spend due to increase monthly payments from car, student, mortgage, all types of loans!!!
Liquidity has been taken from sellers and will be targeting buyers' liquidity. It is a sellers' market right now, and the trend is bearish, market tapped into supply, and will see a falling knife occur, if I am lucky I will catch the black swan event which is envable of this oversold economy.
selby_exchange - BTCUSD - Selby Bitcoin Price ForecastSelby Geometric Extrapolation Structure Logarithmic Chart for Bitcoin with Price/Time Forecast
BTCUSD
April 30, 2022 - June 23, 2022
With custom fibonacci extension levels
Price/time forecast:
$76,001.26
07-23-2022
100% in 83 Days.
Selby finding creative patterns in charts on Tradingview
Not advice for investing, but I am one to watch
Rebellion=Change=Future

See you at $40Now that the app has been released, it looses all the gas. Sell the news event.
Already looks bearish on hourly chart. This will burn down to 40s soon. Time to short/sell/puts.

DWAC Truth Social app launching on Presidents Day, Feb. 21If you haven`t bough DWAC at my fist call, before it skyrocketed to $180:
Then you should know that Truth Social's app profile page App Store seemed to point to the service launching on Feb. 21: Presidents Day.
even though i don`t see a necessarily a correlation between the ride of DWAC and the fall of FB and TWTR, this was a mk cap comparison:
I think Donald Trump will keep the stock`s momentum before the launch. Trump made statements suggested that people are leaving other social media platforms in anticipation for Truth Social.
My price target for Presidents Day, Feb. 21 is the $113 resistance.
Looking forward to read your opinion about it.

selby_exchange - BTCUSD - Selby Bitcoin Fibonacci TestSelby Bitcoin Fibonacci Test
BTC
January 16, 2022 - April 09, 2022
"Fib Test"
Custom Fibonacci Retracement Levels
Support of 1.333 or Above is Long Entry
Rejection of 1.111 or Below is Short Entry
Bull Market Continuation is Support of 3.666
Selby finding creative patterns in charts on Tradingview
Not advice for investing, but I am one to watch
Rebellion=Change=Future

DWAC Trump Media & Technology Group to rival Twitter & FacebookBesides the Ideological Investing as a strong push back against the “liberal media consortium” that banned President Trump, Twitter and Facebook retraced from their highs while DWAC was rising.
Trump Media & Technology Group and Digital World Acquisition Corp. DWAC have entered into a definitive merger agreement.
The transaction values TMTG at an initial enterprise value of $875 Million, with a potential valuation of up to $1.7 Billion depending on the performance of the stock price post-business combination.
TRUTH Social will be a competitor to Twitter and Facebook .
TMTG+ will compete with Netflix and Disney+.
TMTG news will compete with CNN and iHeart Radio.
They have also plans for a Tech Stack that includes web hosting (vs Amazon Cloud) and payment processing software (vs PayPal).
Could this be the new Twitter / Facebook platform?
Don`t know if you have seen my comparison here:
or my first call on DWAC:
Looking forward to read your opinion about it!

selby_exchange - SOLUSD - Selby Solana Fibonacci TestSelby Solana Fibonacci Test
SOL
January 16, 2022 - April 09, 2022
"Fib Test"
Custom Fibonacci Retracement Levels
Support of 1.333 or Above is Long Entry
Rejection of 1.111 or Below is Short Entry
Bull Market Continuation is Support of 3.666
Selby finding creative patterns in charts on Tradingview
Not advice for investing, but I am one to watch
Rebellion=Change=Future

selby_exchange - ETHUSD - Selby Ethereum Fibonacci TestSelby Ethereum Fibonacci Test
ETH
January 16, 2022 - April 09, 2022
"Fib Test"
Custom Fibonacci Retracement Levels
Support of 1.333 or Above is Long Entry
Rejection of 1.111 or Below is Short Entry
Bull Market Continuation is Support of 3.666
Selby finding creative patterns in charts on Tradingview
Not advice for investing, but I am one to watch
Rebellion=Change=Future

selby_exchange - ALGOUSD - Selby Algorand Fibonacci TestSelby Algorand Fibonacci Test
ALGO
January 16, 2022 - April 09, 2022
"Fib Test"
Custom Fibonacci Retracement Levels
Support of 1.333 or Above is Long Entry
Rejection of 1.111 or Below is Short Entry
Bull Market Continuation is Support of 3.666
Selby finding creative patterns in charts on Tradingview
Not advice for investing, but I am one to watch
Rebellion=Change=Future

selby_exchange - LINKUSD - Selby Chainlink Fibonacci TestSelby Chainlink Fibonacci Test
LINK
January 16, 2022 - April 09, 2022
"Fib Test"
Custom Fibonacci Retracement Levels
Support of 1.333 or Above is Long Entry
Rejection of 1.111 or Below is Short Entry
Bull Market Continuation is Support of 3.666
Selby finding creative patterns in charts on Tradingview
Not advice for investing, but I am one to watch
Rebellion=Change=Future
