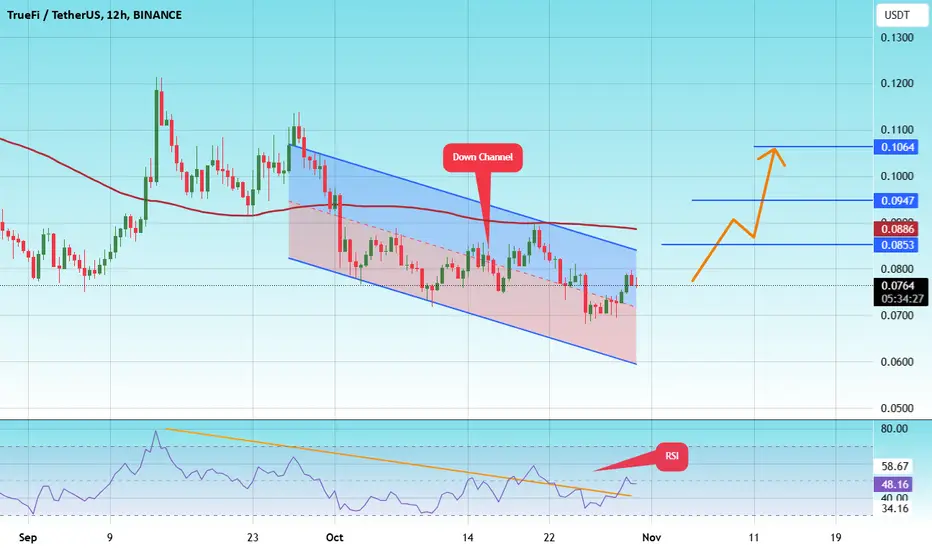
#TRU/USDT#TRU
The price is moving in a downward channel on the 12-hour frame upwards and is expected to continue
We have a trend to stabilize above the moving average 100 again
We have a downward trend on the RSI indicator that supports the rise by breaking it upwards
We have a support area at the lower limit of the channel at a price of 0.0763
Entry price 0.0764
First target 0.0853
Second target 0.0946
Third target 0.1064
TRUUSDT
TRUUSDT Breakout - Strong Momentum Ahead!!BINANCE:TRUUSDT has successfully broken out of resistance after multiple retests of support, signaling a strong bullish trend. Currently trading above the EMA 100, this breakout is backed by impressive volume, indicating solid buying interest. With the technical indicators aligned, we anticipate significant upward movement in the near future.
As always, remember to manage your risk effectively by placing stop-loss orders to protect your position.
BINANCE:TRUUSDT Currently trading at $0.086
Buy level: Above $0.086
Stop loss: Below $0.079
TP1: $0.92
TP2: $0.097
TP3: $0.1
TP4: $0.12
Max Leverage 3x
Follow Our Tradingview Account for More Technical Analysis Updates, | Like, Share and Comment Your thoughts

TRU looks strongHello, we have some new FUD so there are so many nice swing or long term trades. One of them is TRU. PA is bullish, tagets on the chart. If you have any questions, let me know.
MANAGE YOUR RISK AND USE STOPLOSS
NOT A FINANCIAL ADVICE

#TRU/USDT#TRU
The price is moving in an ascending channel on the 4-hour frame and is sticking to it very well
We have a bounce from a major support area in green at 0.0830
We have an uptrend RSI that has been broken upwards which supports the upside
We have a trend to stabilize above the 100 moving average which supports the upside
Entry price 0.0840
First target 0.0953
Second target 0.1022
Third target 0.1103

#TRU/USDT#TRU
The price is moving within a bearish channel pattern on the 12-hour frame, which is a strong retracement pattern and was broken to the upside.
We have a bounce from a major support area in green at 0.0900
We have a tendency to stabilize above the Moving Average 100
We have a downtrend on the RSI indicator that supports the rise and gives greater momentum, and the price is based on it to rise after it was broken upward.
Entry price is 0.1250
The first target is 0.1800
The second target is 0.2100
The third goal is 0.2472

TRU buy setupConsidering the bearish CH and the liquidity pool at the bottom of the chart, it seems that TRU intends to move towards the specified POI.
It can be rejected upwards while maintaining the POI range
Closing a daily candle below the invalidation level will violate this analysis
Note that the financial market is risky, so:
Do not enter any position without confirmation and trigger.
Do not enter a position without setting a stop.
Do not enter a position without capital management.
When we reach the first TP, save some profit and try to move the stop continuously in the direction of your profit.
If you have any comments please post them, comments will help us improve our performance
Thanks

TRU is hotA condition is created for the TRU to be pumped up to the specified tp.
We have a bullish structure on the chart and there are two large liquidity pools on the chart that the candles are trying to sweep.
By keeping the specified demand, it can move towards tp.
Closing a daily candle below the demand range invalidated the analysis
Note that the financial market is risky, so:
Do not enter any position without confirmation and trigger.
Do not enter a position without setting a stop.
Do not enter a position without capital management.
When we reach the first TP, save some profit and try to move the stop continuously in the direction of your profit.
If you have any comments please post them, comments will help us improve our performance
Thanks

TRUUSDT(TrueFi) Daily tf Range Updated till 10-06-24TRUUSDT(TrueFi) Daily timeframe range. another alt doing pretty well while market is down. trying to break out of 0.24465 if volume can keep up its possible. if we get a valid close above 0.24465 than till 0.31015 is open. local support is at 0.18236.


TRU Surprise 200 %A double bottom pattern has formed on the weekly chart.
A pullback towards the $0.101 support zone could confirm the activation of the double bottom.
If the price breaks above the resistance level of $0.227, the next targets could be $0.415 and then the range of $0.678 to $0.817.
200% Growth Potential:
Do you think we will grow by 200%?
This analysis is for informational purposes only and should not be considered investment advice. Please conduct your own research and consult a financial advisor before making any investment decisions.

$TRU 5X TRADE | Truefi +537% Cup and Handle PatternTruefi has had extremely bullish price action recently and is currently forming a multi-month cup and Handle pattern.
The pattern has been confirmed with the price retesting the neckline after forming a downward handle. A complete breakout would send us back to 2022 ATHs, which would be ~$1.14 and would be a 5X gain from current prices (~527%).
Set appropriate stop losses and DYOR, good luck!

#TRU\USDT#TRU
The price is moving in a descending channel on a 4-hour frame.
The price is moving within it and is adhering to it to a large extent.
We have a support area in green and bounced from it at the 0.0800 level.
We have a tendency to hold above moving average 100.
We have a downtrend on the RSI indicator that supports the rise and is about to break higher
Entry price is 0.1000
The first target is 0.1190
The second goal is 0.1377
the third goal is 0.1554

Tru bullishTru breaks triangle meaning its bullish. EMA is good too. Volume is Good.
Below the red trendline, Bullish scenario is invalid

TRU ANALYSIS🚀#TRU Analysis : Breakout and Retest
🔮As we can see in the chart of #TRU that there is a formation symmetrical triangle pattern. Also there is a perfect breakout. This indicates a potential bullish move.📈📈
🔰Current Price: $0.11990
🎯 Target Price: $0.17700
⚡️What to do ?
👀Keep an eye on #TRU price action. We can trade according to the chart and make some profits⚡️⚡️
#TRU #Cryptocurrency #TechnicalAnalysis #DYOR

#TRU/USDT#TRU
The price has been moving in a descending triangle since the beginning of 2022
The price has now reached the downtrend and is about to break it.
We got support in the 0.03400 zone.
Price Now 0.0607
First Goal 0.1012
Second Goal 0.1494
Approximately 200% of the price
We have oversold on MACD
Moving Average 100 was broken, which gave a push for the price

#TRU/USDT#TRU
We have a downtrend on a 4-hour frame, the price is moving within it and adhering to its limits well, and it has just been breached to the upside.
We have a major support area at Saad 0.1200
We have a higher stability moving average of 100
We have a downtrend on the RSI that is about to break higher
Entry price is 0.1490
The first target is 0.1550
The second goal is 0.1700
the third goal is 0.1870

TRU/USDT LOOKING GREAT The TRU/USDT pair appears to be gaining strength in the short term. A breakout has been confirmed on the 1-hour timeframe, indicating a possible bullish momentum. Looking at the 3-day timeframe, TRU's price is breaking through horizontal resistance levels, which could signal a significant upward movement in the coming days.
While the technical indicators suggest a bullish rally, I must emphasize that this is not financial advice. It is essential to conduct your research (DYOR) and consider various factors before making any trading decisions. Keep in mind that the cryptocurrency market can be volatile, and unexpected events may impact price movements.

TRU is a bombThe TRU has formed a large diametric and we are now in a G wave, but it looks like the G wave will end soon.
If the price pullback towards the green box, we will enter a buy/long position.
Targets are marked on the chart
Closing a daily candle below the invalidation level will violate the analysis
For risk management, please don't forget stop loss and capital management
When we reach the first target, save some profit and then change the stop to entry
Comment if you have any questions
Thank You

TRUUSDT.1DHere's a technical analysis of the TRU/USDT chart on a daily timeframe:
Ichimoku Cloud: The price is currently above the Ichimoku Cloud, which is typically a bullish signal. The Cloud may act as support for future price movements.
Resistance Level (R1): The chart indicates a resistance level at R1, which is just above the current price. If the price can break through this level, it may continue to ascend towards higher resistance levels.
RSI (Relative Strength Index): The RSI is at a high level, close to 76, which is typically considered overbought. This suggests that the asset might be due for a pullback or consolidation in the near future.
MACD (Moving Average Convergence Divergence): The MACD line is above the signal line and the histogram is positive, indicating bullish momentum. However, it's important to watch for any potential crossover below the signal line, which could signal a shift to bearish momentum.
SVP (Stop Volume Profile): The SVP indicator on the left side of the chart suggests there are areas of significant trading volume at certain price levels, which can act as potential support or resistance zones.
Conclusion:
The overall sentiment from this chart seems to be bullish in the short term, with the price above the Ichimoku Cloud and indicators like the MACD confirming the momentum. However, the RSI being overbought calls for caution. As a trader, I'd consider the possibility of taking profits at R1 or looking for a breakout above it for further upside. Given the overbought RSI, setting a tight stop loss would be prudent to protect against a potential reversal. As always, this analysis should be combined with other market information and news updates for a comprehensive trading strategy.

TRUUSDTBroke the downtrendline and got in on the retest. Weekly trend is up after a long downtrend. Price might still be moving lower, so only risked 0.5% so far on a total 1%. Undervalued RWA in my view.

TRU can continue tp go up after the PullbackTRU can continue tp go up after the Pullback
🔵Entry Zone 0.07625 - 0.07313
🔴SL 0.06771
🟢TP1 0.08365
🟢TP2 0.09888
🟢TP3 0.12480
Risk Warning
Trading Forex, CFDs, Crypto, Futures, and Stocks involve a risk of loss. Please consider carefully if such trading is appropriate for you. Past performance is not indicative of future results.
If you liked our ideas, please support us with your likes 👍 and comments.

#TRU/USDT#TRU
The price broke the descending triangle upward
Drawing support from the green support area
We have support from the RSI indicator
We have a higher stability of Moving Average 100 that supports the rise
Entry price is 0.05600
The first target is 0.06300
The second target is 0.06853
The third goal is 0.07532

TRU - Break Time for TRU and SHORT time for us#TRU/USDT #Analysis
Description
---------------------------------------------------------------
+ TRU appears poised to break its long-standing trend and move towards its next support level.
+ I'm identifying a favorable opportunity to enter a short trade.
+ It's important to note that executing a short trade in a bullish market carries inherent risks, necessitating the implementation of a stop-loss strategy.
---------------------------------------------------------------
VectorAlgo Trade Details
------------------------------
Entry Price:0.06792 (after breakout)
Stop Loss: 0.07 428
------------------------------
Target 1: 0.06589
Target 2: 0.06325
Target 3: 0.05958
Target 4: 0.05636
------------------------------
Timeframe: 4H
Capital: 1-2% of trading capital
Leverage: 5-10x
---------------------------------------------------------------
Enhance, Trade, Grow
---------------------------------------------------------------
Feel free to share your thoughts and insights.
Don't forget to like and follow us for more trading ideas and discussions.
Best Regards,
VectorAlgo
