TRUUSDT(TrueFi) Bullish Bias UpdateSo based on the chart, the wave count show us that we are still in a wave 1 cycle, currently just completed wave 4 correction cycle, now expecting wave 5 cycle from the current price up to complete wave 5 of wave 1 then a correction from those Highs to create new lows wave 2 will be expected.
this might be a 10X gem..
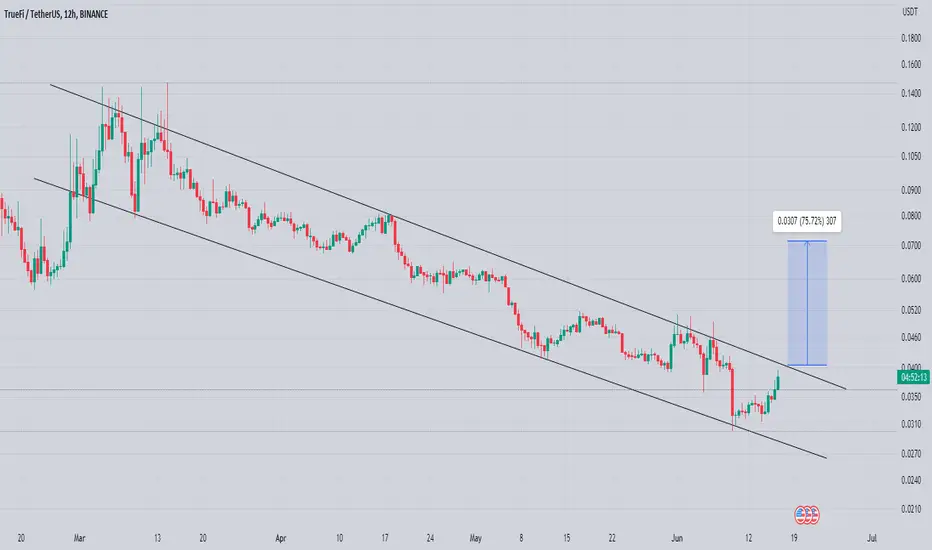
TRUUSDT

TRU ANALYSIS🔮 #TRU Analysis - Breakout 🚀🚀
💲💲 As we can see that there is a formation of Descending Triangle Pattern in #TRU and trying to breakout the descending trendline.If #TRU breakout and sustains the higher price then we will see a bullish trend. 📈📈
💸Current Price -- $0.05822
📈Target Price -- $0.08617
⁉️ What to do?
- We have marked crucial levels in the chart . We can trade according to the chart and make some profits. 🚀💸
🏷Remember, the crypto market is dynamic in nature and changes rapidly, so always use stop loss and take proper knowledge before investments.
#TRU #Cryptocurrency #DYOR

TRU/USDT Ready for an Explosive Journey? 👀🚀TRU Analysis💎Paradisers, let's take a closer look at #TRUUSDT, where the current trends indicate a viable opportunity for a bullish resurgence from its essential support zone.
💎A review of #TrueFi's latest market trajectory reveals a profound 79% reduction from its recent high. Yet, the determination at the support level of $0.04675 suggests a doorway to an upward movement.
💎Despite the hurdles in achieving new highs or surpassing previous records, which has led to a temporary bearish sentiment, the $0.04675 level is pivotal for #TRU. This juncture is on the cusp of initiating a notable bullish wave with a fresh evaluation.
💎As forward-thinking traders, we're perpetually prepared with an alternative plan. If #TRU dips further from this support, we're poised for a bullish comeback starting from the secondary support at $0.034. It's imperative to acknowledge, however, that crossing below this point could indicate a deeper bearish trend.
💎Maintain adaptability in your strategies and keen observation of market trends, Paradisers. Your ParadiseTeam is vigilantly watching, ready to guide you through these evolving market scenarios.

TRU trade setup looks absolutely incredible!The current cup & handle setup that has been forming is absolutely incredible looking! The recent down-thrust looks to have formed the bottom foundation of the formation's handle. I'm waiting patiently for the price to retest the breakout level from the "Bitcoin Approval Rally.'
I will be putting a long position on in that area when my charts give me the signal. This trade setup would work better on a higher dollar/lower leverage entry vs. in my opinion as it will take some time for this pattern to play out to its finality. If you use leverage, make sure that you keep it reasonable (10 - 20x), and keep extra funds in your account to give you a larger spread from your Liquidation Price to assist you in avoiding that dreaded 4 o'clock liquidation candle the Market Maker's love to throw at us in the middle of the night while we're tucked into bed sawing logs.
Good luck!

TRU/USDT bullish horizons from demand? 👀🚀TRU Today Analysis💎 Paradisers, take note of the current dynamics in #TRUUSDT, indicating a setup for a bullish journey from its emerging demand zone.
💎 #TRU has recently undergone a notable pattern, where it swept liquidity above a resistance level before taking a downturn. Currently, having breached the support at $0.04937, we're eyeing a bullish momentum initiating from the lower demand zone at $0.04622. Should the price respect this zone and maintain a strong upward momentum, we anticipate a vigorous bullish move targeting higher resistance levels.
💎 In the constantly evolving landscape of cryptocurrency trading, flexibility and readiness for diverse market scenarios are crucial for #TRU traders. If the asset faces difficulty in sustaining its position at the current demand level, adapting our strategy to anticipate a bullish surge from a deeper support level at $0.04138 might be wise.
💎 Importantly, a descent below this support could signal a need for a strategic pivot, suggesting potential challenges in maintaining a bullish trajectory in the #TRU market.

TruFi just flashed a buy signal!TRU/TruFi has formed a clear cup & handle on the daily chart, and just flashed a clear buy signal on the hourly according to my personal trading perimeters. Although I'm not completely sold on this particular chart I would rate this trade a 7/10.

BINANCE:TRU/USDT - Did you miss this triangle breakout ?------------------------------------------------------------------------------------------
Description
------------------------------------------------------------------------------------------
+ A perfect triangle pattern formed for TRU/USDT
+ Upward breakout of the price confirmed after multiple rejection around the resistance line
+ Overall price is trending bullish and this is a good opportunity to enter a LONG trade.
+ This is a trade with tight stoploss, so be careful.
------------------------------------------------------------------------------------------
Signal
------------------------------
VectorAlgo Trade Details
------------------------------
Entry Price: 0.05847
Stop Loss: 0.05615
------------------------------
Targets 1: 0.05950
Targets 2: 0.06350
Targets 3: 0.06555
Targets 4: 0.06758
------------------------------
Timeframe:
Capital: 1-2% of trading capital
Leverage: 5-10x
------------------------------------------------------------------------------------------
Note: Don't forget to keep the stop-loss.
------------------------------------------------------------------------------------------
Agree or Disagree with the ideas ? lets discuss in the comments.
Like and follow us for more ideas.
Regards

TrueFi TRU long medium-term trade #20Today our attention was drawn to TrueFi TRU. We think we understand the logic of the behavior of buyers and sellers in this asset.
So, let's try to take a position for a medium-term trade on the following conditions:
Entry: in the range of $0.034-0.0358 (the desired average price is $0.0349)
Stop: $0.0318 (-8.88%)
Take profit: $0.0628 (+80%)
P/L ratio - 9/1
We allocate $5,000 for TRUUSDT trade, because the coin is highly volatile
In the event of a mistake, we will lose $450
If the trade will be a success, we will receive a profit of $4000

TRUU READY FOR THE HISTORY WHALE INCREASE TRUU seems on a very interesting level for the next high break.
Showing high incoming volume.
Soon more.
For the day trading manage always risk.
Trading with not SL means not trading.

Trade signal | TrueFi (TRU) is ready for the next pumpHi dear friends, hope you are well and welcome to the new trade signal of TrueFi (TRU) with US Dollar pair.
Recently we caught almost 71% pump of TRU as below:
Now on a 4-hr time frame, TRU has formed a bullish Cypher for the next pump.
Note: Above idea is for educational purpose only. It is advised to diversify and strictly follow the stop loss, and don't get stuck with trade.

TRU/USDT bullish ride? 👀 🚀 TRU Today analysis💎 Paradisers, gear up to delve into TRUUSDT as it showcases a captivating trajectory within the demand zone, hinting at a heightened likelihood of an upward trend.
💎 Following its recent breakout from the descending channel trendline, TRU is poised with the potential to approach the supply level at .03760.
💎 The VRVP's diminished volume at this juncture suggests a probable continuation of the bullish trend from the demand zone at .03460, where a surge in volume indicates a potential pivot in momentum.
💎 On the flip side, should the price descend below the demand zone, the scales tip towards increased chances of a bearish shift. Stay attuned to these evolving dynamics!

TRU/USDT 1D. Secondary trend. Local accumulation range.TrueFi/USDT 1D. Local and secondary trends.
In the main trend - downtrend channel was formed. You can check this if move chart to the left in the main idea.
This channel was broken up in winter 2023, when there was local pump on all crypto market.
At that time, price pumped 360% to 0.13$ zone and from the the pullback has started. It formed quite an aggressive downtrend, which has been broken Jun 2023.
After that falling wedge started to form. The support lvl was formed at 0.0323$, while the decline lasts for 232 days as for now, just an interesting point.
Price formed the range with, as already mentioned, support at 0,0323$ and resistance at 0,0392$(14 - which is "balance").
Price has deviated this ranged locally - reaching the minimums of winter 2022-2023 - then turning back to the range. Now, the price is near the resistance zone locally.
During all that secondary downtrend we've seen 2 volume spikes - 1 on Jun 1 2023, other on Aug 21. As for now the price is consolidating in quite a small range of 25%. It has also broken the resistance of the falling wedge locally.
All the details are on chart. If market allows - locally we can reach the middleterm resistance zone, shown on chart. It's 0.0609$ to 0.0777$ zone. Very logical resistance in terms of numbers.
It may happen only if we break and hold above 0.0392$ lvl zone(current range resistance). Everything is with accordance to the market tendency.
Linear chart is for the clarity(no shadows of candles). Percent to the resistance zones are shown.
There has been also the retest of the broken local falling wedge(on chart).

TRUUSDTTRUUSDT is in strong bullish trend.
As the market is consistently printing new HHs and HLs.
currently the market is retracing a bit after last HH, which is also the 50% fib retracement level and local support as well. if the market successfully sustain this bullish confluence the next leg high could be 0.0440.

TRUUSDT Breakout Confirmed!TRUUSDT Technical Analysis Update
Buy zone: Below $0.0405
Stop loss: $0.0384
Take Profit 1 : $0.0435
Take Profit 2 : $0.0465
Take Profit 3 : $0.0520
Thanks
Hexa

TRU new bull run has startedHello Traders,
As you can see on the chart, We have two bullish patterns: Double bottom and falling wedge.
Let's revisit this idea a few months later ;)
Please hit the boost button and follow me for more ideas.
Thanks

#TRUUSDT's Potential Uptrend with Fibonacci Play💎Today's spotlight is on #TRUUSDT. The token has recently anchored its support at the $0.030 mark, aligning nearly perfectly with the 78.6% Fibonacci retracement level. Before this stabilization, #TRU sketched out a double bottom pattern. This pattern, followed by a surge past the local resistance, hints at a possible trend reversal.
💎 What does this mean for traders? The scales now seem to tip towards an upward correction. As long as the price stays comfortably above the double bottom region, specifically above the $0.026 trough, we can anticipate a robust upward pullback.
💎 On the resistance front, our eyes are set on another 78.6% Fibonacci retracement level at $0.037. This level intriguingly mirrors the downtrend trendline, making it a key point of interest.
💎 However, a word of caution: The MCP team remains vigilant about today's low, marked by the Fibonacci bounce. A descent below this point might cast shadows on the prospective upward correction.

$Tru is still Looks beautiful All the Low cap Coin bounce NYSE:TRU is still Looks beautiful All the Low cap Coin bounce TRU has not pumped strongly.
NYSE:TRU gains good following from this region with a lot of potential than I gave 0.0280 0.0307 contradicts support. It will be like that until we break the resistance .0.0363 with high volatility.

Tru Getting Ready For Massive Bullish Rally Seems Like getting Ready for Massive Recovery Formed Falling Wedge In Daily Tf And Trying To Break It Incase Of Breakout Expecting Massive Bullish Rally Incase Of Successful Breakout Expecting 100 to 110% Bullish Wave

TRU LOOKS VERY BULLISH (1D)It has a good chance to pump. I specified the place of buy/long
Note: This symbol is small in volume, you must not forget capital management and stop setting

Trufi trend breakout looking for a continuationTrufi has experienced a breakout in both the H1 and H4 timeframes, indicating a potential continuation in the retracement towards the highlighted key level. This level is in close proximity to the 61% Fibonacci retracement, which further strengthens its significance. The breakout has been confirmed by a subsequent pullback, adding to the validity of the retracement expectation.

TRUUSDT BEARISH TRENDScript shows bearish trend with no divergence and fib retraced to 0.78. Took a instant sell entry with 2 TP's. Will it go down and hit my all TP's?

TrueFi get ready for Lift off ?!!👀 TRU Today Analysis💎TrueFi is crafting a falling wedge pattern, hinting at a potential bullish reversal on the horizon.
💎 It's trading within a high demand zone, and the strong demand in this area further bolsters the potential for an upward move.
💎 analyze the falling wedge pattern and the high demand zone collectively, it suggests a bullish outlook for TRUUSDT.
💎 A successful breakout, accompanied by increasing volume, would validate the bullish scenario and potentially lead to further upward price movement.
💎 In the ever-changing crypto universe, staying updated and adaptable is essential. Stay tuned for more updates and enjoy your trading journey!

Finally Tru Getting Ready for Decent Recovery Seems Like Getting Ready for Massive Recovery Formed Descending Channel in h12 tf incase of breakout expecting 60 to 65% bullish wave