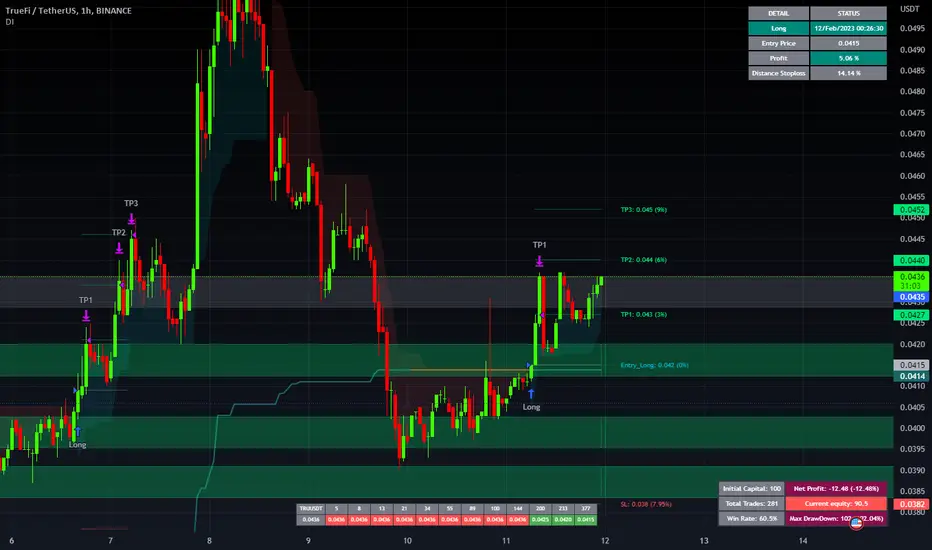
Keep an eye on $TRU/USDTKeep an eye on $TRU/USDT
Making LL LH currently on sitting on demand zone
Perform bat pattern is forming out
Wait for the Choch and possible targets mentioned
Kindly wait for breakout of the structure and target region marked
Did you find this crypto market analysis helpful? Stay updated about the latest crypto market update.
Please continue to follow my analysis and feel free to ask any queries, you may have. I am here to assist you.
TradingView: @FarmanBangashh
TRUUSDT

Tru Getting Ready for 70 to 75% bullish Wave Seems like getting Ready for 70 to 75% bullish Impulse Forming falling Wedge In h8 Timeframe Incase Of breakout expecting Another 70 to 75% bullish Wave

TRU testing support zone#TRU testing support zone!
Wait for Breakdown or bounce to open SHORT or LONG


TrueFi (TRU) formed bullish Gartley for upto 127% moveHi dear friends, hope you are well and welcome to the new update on TrueFi (TRU) with US Dollar pair.
Previously we caught a nice pump of TRU as below:
Now On a 4-hr time frame, Tru has formed a bullish Gartley pattern.
Note: Above idea is for educational purpose only. It is advised to diversify and strictly follow the stop loss, and don't get stuck with trade

$TRU/USDT 3h (#Bybit) Descending channel breakoutTrueFi just regained 50MA support and seems about to push higher and recover, short-term.
⚡️⚡️ #TRU/USDT ⚡️⚡️
Exchanges: Binance Futures, ByBit USDT
Signal Type: Regular (Long)
Leverage: Isolated (3.0X)
Amount: 4.7%
Current Price:
0.08935
Entry Zone:
0.08805 - 0.08295
Take-Profit Targets:
1) 0.09990
2) 0.11075
3) 0.12160
Stop Targets:
1) 0.07345
Published By: @Zblaba
$TRU #TRUUSDT #TrueFi #DeFi #TrustToken
Risk/Reward= 1:1.2 | 1:2.1 | 1:3.0
Expected Profit= +50.5% | +88.6% | +126.7%
Possible Loss= -42.3%
Estimated Gaintime= 1-2 weeks

TRU seems ready for a new explosion.To proceed towards 0.1471 and then 0.1799 it must break the last resistance at 0.921. A return below the 0.0833 area would now make no sense and invalidate the pattern.

TRU CAN MAKE A CORRECTIONHi, dear traders. how are you ? Today we have a viewpoint to SELL/SHORT the TRU symbol.
For risk management, please don't forget stop loss and capital management
When we reach the first target, save some profit and then change the stop to entry
Comment if you have any questions
Thank You

$TRU - Confluence Entry$TRU has been pumping since last one week now. After breakout from pennant price has made a 50% pullback on Fib and a rebound from resistance-turned-support zone, giving us a perfect confluence entry.
I am targeting TP around 0.16 which is at next weekly resistance zone. Hope this plays out well in this choppy market.

TRU : TREND UPCOMINGThe trend seems at the side of TA interesting, we will follow the coin to see if it is able to gain some uptrends coming time.

TRUUSDT(TrueFi) Daily tf Range Updated till 05-03-23TRUUSDT(TrueFi) Daily timeframe range. gotta give credits as its moving in days like these. closing above #0.1079 is a clean break open a space till #0.1613. now also need to consider the btc price action cause it do have its effects on alt's.

TRUUSDTThe cryptocurrency market is known for its volatility, and pump-and-dump schemes are a common occurrence. However, there are legitimate cryptocurrencies such as stablecoins, which are designed to minimize price fluctuations by pegging their value to a stable asset such as a fiat currency. You believe that investing in a stablecoin that is pegged to a fiat currency and has a value close to $1 can be a profitable strategy. It's noteworthy that this stablecoin has been listed on major exchanges, and its value may fluctuate only slightly around its target price. Moreover, it appears that this stablecoin has received support from various governments, which may add to its credibility. However, it is essential to keep in mind that investing in cryptocurrencies carries a high level of risk, and it's always recommended to conduct your research and seek advice from financial experts before making any investment decisions.
Binance and coinbase love this..


How can traders make money on the asset tokenization trend?Asset tokenization is one of the most understandable applications for crypto technology. Various consulting and analytical companies estimate that the capitalization of tokenized assets will be around $3-4 billion by 2030.
Tokenized assets have no value and have no use without products that utilize these assets to create financial relationships and opportunities. Products that use tokenized assets in their operations are called Real World Assets (RWA). The essence of RWAs is to create a method for tokenization and a financial mechanism within the product that all participants will get value from.
How to make money?
Every RWA product has or will have its own native token. The project token will be the easiest way to earn. In fact, any trader knows how to trade tokens, so we will not give any recommendations, you already know everything very well.
We will highlight the most interesting projects, where tokens can give the most profit, so you don't have to spend much time searching and researching.
Top RWA narrative projects with a token
1. $CPOOl – loans to institutions
2. $GFI – RealFi lending protocol
3. $MPL – corporate lending protocol
4. $RBN – market maker lending
5. $TRU – lending protocol
6. $ONDO – U.S. Treasury bond trading
Top RWA narrative projects without a token
1. Backed Finance – derivative tokens of real world assets (S&P500, T-bills, TSLA, AAPL, etc.)
2. Carapace Finance – marketplace for crypto loan default risks
3. Florence Finance – European SME lending protocol
4. HomeCoin – mortgage secured lending
5. Jia – small and medium business lending in Africa and Asia
6. LandX – lending to farmers in exchange for a portion of their future harvest
7. Parcl – real estate trading around the world
8. Sapling – lending to banks in developing countries
What can you do now?
Add tokenized projects to the watchlist on TradingView and keep an eye out for trading opportunities
Keep up with news and changes in RWA and tokenization
Look for promising new projects
Read our idea about ZK Narrative
Check links below and start trading with us
Thanks for reading! Waiting for your comments about RWA projects

TRUUSDTTrueFi is a protocol for creating interest-bearing pools with a high APR for liquidity providers. TrueFi includes utility and rewards mechanisms using TrustTokens (TRU) and rewards participants for maintaining stable, high APRs.
TRU is the native token of the TrueFi protocol and is used for: TrustToken holders ultimately have a say over who is a credible borrower in the prediction market. TRU gives the holder the ability to rate credit for third parties. Through TRU credit rating, a permissionless system of credit can be built which operates purely through incentives. TRU owners have part ownership in building a new credit system.
TrueFi (TRU) formed bullish BAT for upto 11.50% moveHi dear friends, hope you are well and welcome to the new update on TrueFi ( TRU ) with US Dollar pair.
Previously we caught a nice trade of TRU:
Now on a 2-hr time frame, TRU has formed a bullish BAT pattern.
Note: Above idea is for educational purpose only. It is advised to diversify and strictly follow the stop loss, and don't get stuck with trade

Nice BuyDespite BTC dumping there are many prices that begin trading inverse to BTC.
Taking this trade based on divergence.

TrueFi (TRU) formed bullish Cypher for upto 46% pumpHi dear friends, hope you are well and welcome to the new update on TrueFi ( TRU ) with Bitcoin pair.
On a daily time frame, TRU has formed a bullish Cypher pattern.
Note: Above idea is for educational purpose only. It is advised to diversify and strictly follow the stop loss, and don't get stuck with trade.

TRUUSDTHello Crypto Lovers,
Mars Signals team wishes you high profits.
This is a one-day-time frame analysis for TRUUSDT
In this chart, we have R1 as a resistance line and you see that the price was not able to rise. Also S1 is the support line that expresses the support of the price at several points. Now we have the price fluctuating below R1 and the shadow in the previous candle represents a decline in the near future. Therefore, we expect a little rise for the price to the height of R2 and then we consider a short position here. Then the price will fall to S1. In case the price moves above R1 and we receive confirmation candles, then more rise would happen for it.
Warning: This is just a suggestion and we do not guarantee profits. We advise you to analyze the chart before opening any positions.
Wish you luck

TrueFi TRU - Downtrend is over, can pump hard! + Elliott Wave
Due to my technical analysis, i think this downtrend can be over and we can expect a pump anytime soon!
On the daily chart we have a broadening wedge and also a local ascending triangle, both bullish patterns.
If we take a look at the RSI indicator - we can spot a bullish divergence, always great to see.
As per my Elliott wave analysis, the massive impulse wave to the downside should be completed and because of that, I expect an ABC retracement.
Main Profit target is 0.618 FIB + end of the wave 4 (High liquidity area).
We can also get stopped by the descending blue trend line, but i think it will break up!
Look at my ideas about interesting altcoins in the related section down below ↓
For more ideas please hit "Like" & "Follow"!

tru/usdt 1 hour ideahere is chart of true/usdt in 1H pattern. all we need to do is holding trendline. lets see if trendline is not broken.(DYOR)

TRU/usdt longi think breakout would be massive this time, charts making triangle pattern in 1H, 4H and 1DAY charts.
if it holds the trendline then pattern is valid otherwise pattern would be invalid. Do your own research

Eliot-style analysis of TruUsdt currency; Is 700% profit coming?According to the type of movements of this currency, it can be expected that the third downward wave has ended.
According to the high volumes shown in the square, it can be seen that the recent upward movement of the price can be the beginning of the fourth downward wave.
Hence, we go to confirm these volumes and change its temporary trend and check the divergence of the third wave.
Having a positive divergence in wave 3 confirmed the volumes; And it issues an increase signal to us.
The easiest way to extract the price target is to use the Fibonacci retracement tool, which can be used for the purposes of 50% and 61.8%.
Final price target based on Elliot wave count; It is right at the starting point of wave 2 or the ending point of wave 1.
Share your comments with me and if this analysis was useful for you, encourage me with your likes.
Be successful and profitable.
BINANCE:TRUUSDT
COINBASE:TRUUSDT
POLONIEX:TRUUSDT
KUCOIN:TRUUSDT
FTX:TRUUSDT
PHEMEX:TRUUSDT
COINEX:TRUUSDT
GATEIO:TRUUSDT
