TRXUSDTLet's see if we backtest the 0.04950 area down to the 0.04790 area.
TRXUSDT Futures Setup:
Entry: 0.05190-0.05170 ✅
TP1: 0.04970-0.04920
TP2: 0.04790-0.04740
TP3: Open TP
Note: Always use SL to avoid Liquidation.
Disclaimer: Trade at your own risk.
TRX

TRX Tron prediction for the end of the yearUSDD, the Tron DAO reserve is depegging from the dollar.
USDD is secured by the over-collateralization of multiple mainstream digital assets (e.g. TRX, BTC, and USDT).
TRX is used as collateral. Could lose value sharply.
TRX/USDT short:
Entry Range: $0.052 - 0.055
Price Target 1: $0.049
Price Target 2: $0.045
Price Target 3: $0.040
Stop Loss: $0.061

Sun (New) SUN price prediction for the end of the yearSun (New) SUN is in the Tron ecosystem that could see a big sell-off because of USDD depegging.
Price targets:
SUN/USDT short:
Entry Range: $0.0052 - 0.0058
Price Target 1: $0.048
Price Target 2: $0.044
Price Target 3: $0.039
Stop Loss: $0.072

TRXTron Technical analysis basically on elliott waves Principles and Price action Strategy
Tron can be 0.03
Wait and watch

TRX Tron the Next LUNA ? Justin Sun is the CEO of TRX, Tron, the 15th biggest cryptocurrency, with a market cap of $4.74 Billion.
Justin Sun`s TRX also controls a stablecoin, USDD, that keeps on depegging from the dollar recently.
He has also a controlling stake in Singapore-based Huobi, the fourth largest digital asset exchange.
Yesterday the amount of withdrawals from Huobi were significant, $60 Million.
There are Insolvency Rumors for Huobi.
I think TRX will ultimately reach its pandemic low of $0.0072.
Looking forward to read your opinion about it.

TRX: Showing strange trendTRX is showing since short term a strange pattern, for this reason, we will follow this coin to see if it can confirm the breakdown trend.
There is a cash-out trend on TRX, the question is to see if there is a whale trend following the same pattern.
Until now it's interesting to follow to see last trends on TRX.
A long at this moment on TRX can be risky since it's important to confirm the trend first.

TRXUSD- Short Position- DYORHere is a technical analysis considering all the drama going on with Justin Sun and Huobi Crypto Exchange. Tron plunged more than 8% today, USDD Depegs and also, Huobi Crypto Exchange has said it will lay off hundreds of staff in coming weeks. Justin Sun is one of their advisors.
DYOR before trading based on this chart. Not liable for any of your personal loses due to this analysis.

TRXUSD is ready. Are you ready for this? 50 % dump (NEW)TRXUSD looks ready. The price has been in the descending triangle for a long time. Now it looks like it's ready for a breakout.
Taking into an account very bearish sentiment in the whole crypto market, we expect that it will break down.
Targets are shown on the chart.
We don't expect it to go to zero therefore targets are defined based on the historial key supports instead of traditional methodology applicable to trading descending triangle pattern.
Expect more FUD in crypto market which could be a trigger for a triangle to breakdown.
good luck

TRXUSDT |DECRYPTERS| TRON| TRXHi people welcome to Team decrypters
We taking TRX short like we did FTT AND LUNA FROM TOP
Reason is simple
Short the Justin Sun

TRON $TRX Takes an 8% nose-dive!His excellency Justin sun better not lose that $0.045 $TRX line of defense! TRON is generally not an asset to short due to its historical stability, but who knows what's on the plate this time around?
I believe it's still a great opportunity for longs but once you lose that red line, then it will get ugly ahead!

✳️ TRON On A Long-Term Path Towards 700 SatoshisTRON is aiming at 700 satoshis (0.00000700) and since January 2021 we have higher highs and higher lows.
Recently, after a new resistance level was conquered in June 2022, we are seeing bullish consolidation for the past six months.
Trading within a bull-flag, we can expect higher prices in the months to come.
This is a long-term analysis.
Namaste.

Tron to start breaking upwards exactly February 6th it appears!Analysis of the the majority of charts in crypto at the moment, the sentiments have come down lower than expected in the market. Most crypto are undervalued. Not only that but it appears we have hit rock bottom of the trendline upwards. This is showing on multiples of cryptocurrencies so expect Tron to begin it's ascent February 6th until finally breaking out up mid February.
It's coming!! 📈

TRXUSDTTRXUSDT Futures Setup:
Entry: 0.05419-0.05409 ✅
TP1: 0.05320
TP2: 0.05220
Note: Always use SL to avoid Liquidation.
Disclaimer: Trade at your own risk.


TRX - Range trend but positive momentumDuring the past weeks, TRX had a range trend but positive momentum. The price of Tron entered a correction after the bearish wave, which was able to stay at the support level of $0.053-$0.054 by breaking the downtrend line drawn in the previous analysis. Again, a positive reaction has been observed at this level, which indicates the attempt of buyers to grow the price to the resistance of $0.057 to $0.059. In general, the major resistance in daily time is considered in the range of $0.070. But in the 4-hour period, if the $0.059 resistance is broken, we can expect further growth and an upward trend. So, in general, for this week, the resistances of $0.059 and $0.062 can be short-term targets for buyers. You can also consider a narrow ascending channel for the price in the 4-hour timeframe. As long as the bottom of the channel is maintained in the orange range, we expect the price to grow.

TRXUSDT TECHNICAL ANALYSIS$TRX launched in June 2018 and TRON value was $0,052, last ATH was $0,178. Tron has been lost value lower than when first launched. We haven't got any BUY signals from our robo advisor/ indicator @EngineeringRobo yet in daily chart. But we have got our first buy signal with MA20&50 then MA50. Also, the candles are already breakout down trend-line plus one candle opened-closed completely above down trend-line. It may an opportunities for buy then we may earn first of all 5% then 10%.
Let's follow our chart closely and do not forgot the follow me.
"NFA""

💲Tron Ready To Strike Out💲💲Tron Ready To Strike Out.
💲After a perfect defense of the support zone set by the 0.382 level, we begin another attempt to attack northward.
💲Tron, in my opinion, has really great potential for growth.
💲It stands out very positively against the rest of the cryptocurrencies.
💲Looking at the technical environment, I do not have any doubts about the probability of the continuation of the increases.
💲In my opinion, it is more likely that the next few weeks will bring increases.
💲The scenario I am playing out is a continuation of the increases on TRX over the next few weeks. I don't exclude the possibility of changing the scenario if the market situation changes abruptly. I'm aware of the possibility of a correction at any time, this should be taken into account, If the outlook changes I will publish a post with an update, so I encourage you to actively follow the profile and read the description carefully.
🚀If you appreciate my work and effort put into this post then I encourage you to leave a like and give a follow on my profile.🚀

TRX potential big drop (mid-term analysis)Hi all,
As previously mentionned in the short-term analysis for TRX (cf link below), I would like to share my mid-term view on this crypto.
In 2D TF, we can see that selling pressure is increasing:
MFI values broke and were rejected by its long-term trendline
The same phenomena are confirmed with OBV
In lower TF (1H), the selling signal is triggered as shown in my previous post (link below).
This crypto is highly volatile, consider your risk management.

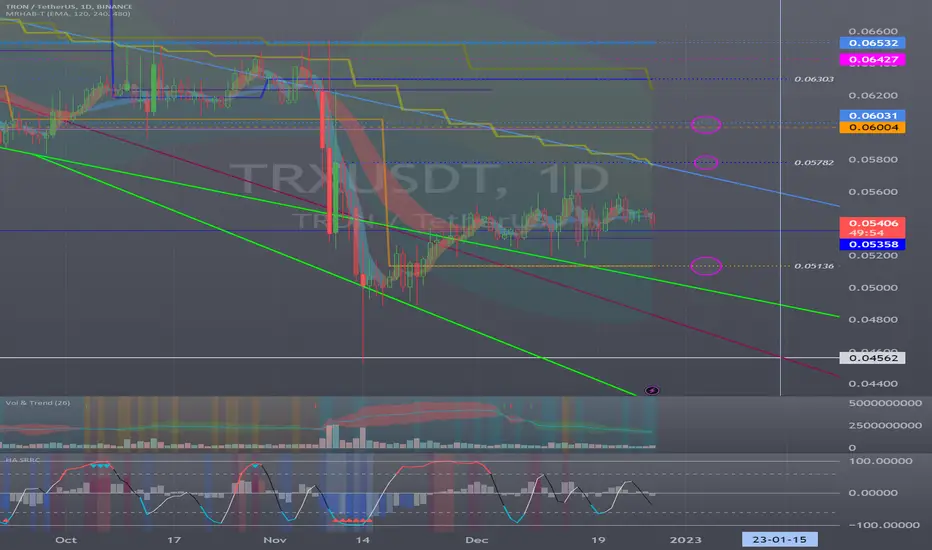
The 0.05358 point is stronger than any pointHello?
Traders, welcome.
If you "Follow", you can always get new information quickly.
Please also click "Boost".
Have a good day.
-------------------------------------
(TRXBTC 1W Chart)
It has risen in the section where the power of the rise is gained.
In order to release this force, we need to see if the price can sustain above 0.0000 0318.
-----------------------------------------
(TRXUSDT 1W chart)
The key is whether it can get support around 0.05358 and rise above 0.06004.
If not, a fall below 0.04562 is highly likely and you should think about how to counteract that.
(1D chart)
TRX is linked to USDD, a stablecoin.
Therefore, a drop in the price of TRX is likely to have a profound impact on the shape of TRX.
So, I think keeping the price above 0.05358 is of utmost importance.
Therefore, you have to work hard to ensure that USDD is pegged to $1.
Those who believe in TRX and continue their mid- to long-term investments should take advantage of this and take a trading method that increases the number of coins corresponding to profits while recovering the principal amount purchased.
The next volatility period is around January 15th.
-------------------------------------------------- -------------------------------------------
** All descriptions are for reference only and do not guarantee profit or loss in investment.
** If you share this chart, you can use the indicators normally.
** The MRHAB-T indicator includes indicators that indicate points of support and resistance.
** SR_R_C indicators are displayed as StochRSI (line), RSI (columns), and CCI (bgcolor).
** The CCI indicator is displayed in the overbought section (CCI > +100) and oversold section (CCI < -100).
(Short-term Stop Loss can be said to be a point where profit or loss can be preserved or additional entry can be made by split trading. This is a short-term investment perspective.)
---------------------------------
TRXUSDT TECHNICAL ANALYSISTron $TRX has lost approximately 66% value since May 2021 till now. So many coin has lost over 90% and the TRON was trying to keep value stronger. We haven't got any buy signal from our robo advisor @EngineeringRobo yet but MA 20 & 50 has changed direction at the moment and it give us first buy signal. If the candle keep going stay green, first of all we may earn approximately 6% and our target might be our down trend-line. We are still on the bear market and if we use leverage, we may double our money.
Let's follow up our chart closely and do not forget to follow me.
"NFA"

trx viewpoin shortHi, dear traders. how are you ? Today we have a viewpoint to SELL/SHORT the trx symbol.
For risk management, please don't forget stop loss and capital management
When we reach the first target, save some profit and then change the stop to entry
Comment if you have any questions
Thank You

✴️ How To Trade Cryptocurrencies | It Is Very Hard... Is It Not?It is hard... We know it isn't easy.
To look at this chart and call for a reversal.
To look at any chart and say anything...
It is hard because it can always change and whatever you see might not be true.
So one needs balls to be able to jump in and say, this is my view.
Or it can be easy... It can be very easy with a plan/strategy on how to trade.
Here we have this beautiful chart.
I don't know, it looks beautiful to me somehow.
The fact that price actions drawn as candles forms patterns...
The fact that a bounce happens each time at support.
It can be easy too, stay with me.
Some have the wrong focus think/say you got it right, you got it wrong... But this is not about being right or wrong it is about sharing my view so that you can do your own thing.
You do not decide based on what we say.
You make your own decision based on your own trading strategy and our charts can help you to adapt and change.
Maybe you can improve on a target...
Maybe you can decide to close a trade...
But that is a decision you make after your own research not because of a single trade idea you read.
Anyways... It can be easy because support is found 17% below the current price. That's the risk.
If you buy this pair and TRXUSDT drops by 18%, you close the trade at a loss. This is a calculated risk, you know exactly how much you are risking.
If it breaks bullish, you can sell for profits on the way up.
20%, 40%, 80% up to 100% and more.
Actually... This is so easy.
You simply buy and hold.
If the pattern breaks down, if the trade goes wrong;
Close at a loss.
If we have a bullish breakout, we start green and the rest is to collect your profits on the way up.
Only 2 possible actions: Buy and sell.
With the first one, BUY, you hold.
With the second one, SELL, you are done and can start looking for a new trade.
Alan Santana writing for you!
Remember to boost 🚀😄🤗
Namaste.
