TRXUSDTThe falling wedge has formed. It is better to work from breaking through. Good targets. After the take, I expect further movement to 1.618
TRX


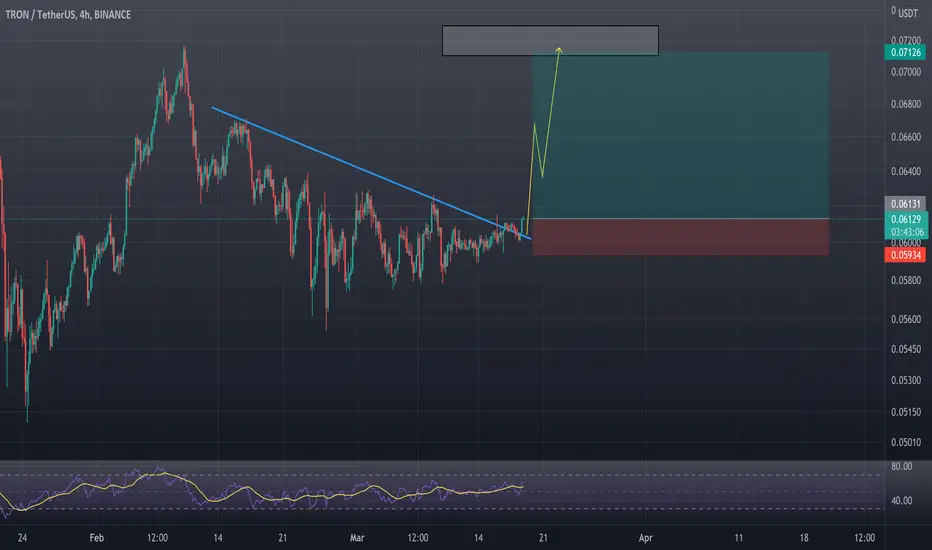
We will see the tron at $ 0.072With the huge drop in the price of tron, its price is also expected to increase. With this technical analysis, I see a price cap of $ 0.072.

TRX final 4hr candle to confirm breakout & a good longTRX been in a downtrend for 48 hours however, it is now trying to breakout on the RSI posssible move upside if we close this 4hr candle and hold the RSI breakout.
TPs, SL & Entry is mentioned in the charts.

TRX is in the BIG channel! Wait for a pullback!Tron (TRX) is in the BIG channel! After falling by 22% like last time, the price began to rise. Now we are touching the lower boundary of the channel! This could be a trigger for growth or at least a local pullback.
Pay attention to the volumes - this is an indicator of a BIG player!
Friends, press the "like" button, write comments and share with your friends - it will be the best THANK YOU.
P.S. Personally, I open an entry if the price shows it according to my strategy.
Always do your analysis before making a trade.

TRON longTRON bounced off the ascending trendline. Asset bounced off the support level. Bullish movement to resistance level at 0.072 is expected to happen.


TRX is making falling wedge | LONGIt seems like TRXUSDT is making a falling wedge. Also the volume is decreasing. So in my opinion TRXUSDT has a bullish signal.


TRON TRX Swing Trade 4 HR Long Apparently my B ( From XABCD pattern) invalidates this as a Harmonic pattern . However there is still an 886 retracement . Looks like the low is in , So im going to wait until there is a type 2 return (confirmation low ) ,
and see if we can break B and go up . Long.

TRX 1h ShortSetup: On the 1h TF, TRX is on a downtrend and just break below the 200 EMA. It is also below the control point. Comparing with the higher TF, there is also low volume between the entry and our take profit level This means that there is more chance for our trade to run
Entry: 0.06986
SL: Trailing Sl of 3.1 ATR, currently at 0.072
TP: 0.06

Tron shortTron broke trough the support level. Asset broke trough the ascending trendline. Bearish movement to support level at 0.064 is possible.


Decrease and increase the price of theron againTheron goes to the red line and then to the bottom of the canal, where it grows suddenly.

TRX usdt h1 , short ideaNice opportunity for short TRX usdt,
Entry,stop loss ,and target mentioned in chart,
Note, That is my opinion , please make sure do own analysis before entry ,

TRX/USDT BUYING SET UPTRX Breakout from bearish trend or major descending channel, Any pattern EVE ADAM and valid breakout, and Now TRX on retest resistance become support after break from EVE ADAM pattern
RSI on Daily or lower timeframe showing overbought , Maybe need sideways in few days before continue make new higher high
Entry : 0,0725 , 0.071 , 0.0695
Target : 0.08 , 0.086 , 0.092 , 0.101 , 0.109
Stoploss : $0.065
Risk : 10%

TRON at a crucial stage /DAILY ANALYShello guys,
as we see in the chart,
Tron is at a crucial stage,
the break up of the curve, mean that we go to 0.093
If the break up fails, the price will be returned to 0.056
tnx


WIN for 2022. Retest and moonWIN/USDT now in a doble bottom in a weekly frame, as its brother BTT, now testing broked two years ATH area, a great oportunity for big gains this year.

TRX/USDTesting/tracking elliot wave theory. Please do not trade off idea without S/L. Not financial advice.

TRON - Update ✅Let's see how TRX is behaving.
This is a 1D chart. (Mid Term)
TRX is now the first trend on Twitter.
It looks like it has safely passed the support/resistance level on the chart and, after confirmation, will turn it into a local support level. This can start a new uptrend for TRON.
Support levels: 0.06342
Resistance Area: 0.08169
Bollinger Bands can work as support and resistance too. Here is an example:
The market is showing BUY volumes for TRX.
Two resistance levels push down on value, and one support level holds the price high and shows strength. The higher band can work as resistance.
The Middle Bollinger Band can push down the value, and the Lower band pushes the price up.
If the price crosses the local resistance and stays above it for confirmation, we can open our long positions, aim for the next resistance, and use it as a TP point.
The RSI shows that TRX is above the 50 levels, the center.
If you want to know how the RSI indicator works, take a look at this Educational Idea. It'll help you have better readings:
Current Market Price: $0.07171
Let me know your ideas.
Good luck.