Tron longTron bounced off the ascending trendline. Asset broke through the resistance area. Bullish movement to resistance level at 0.0719 is possible.
TRX


TRXBTCHello Crypto Lovers,
Mars Signals team wishes you high profits.
We are in the daily time frame. There is the support area S1 which has supported the price several times. We have 3 areas: R1, R2, and R3. The price can move up to R1 and you can save profit there. If R1 and R2 are broken, the price can move up to R3 and you can sell your profit there too. You had better sell it at the R1 line because it is likely for the price to hit the R1 line and then fall. If S1 is broken, it will see lower prices.
Warning: This is just a suggestion and we do not guarantee profits. We advise you to analyze the chart before opening any positions.
Wish you luck


nice chartnice chart for long time
In terms of wave count, we are at the beginning of the fifth wave and it can give you a good profit in the fifth wave, so be patient and enjoy ... Thron is a man of hard days.

$TRXUSD entry PTs .001804-.0068-.051865 Next Target PT 2.40-17TRON Coin Price & Market Data
TRON price today is $0.059529663343 with a 24-hour trading volume of $658,735,152. TRX price is up 3.9% in the last 24 hours. It has a circulating supply of 100 Billion TRX coins and a total supply of 102 Billion. If you are looking to buy or sell TRON, HitBTC is currently the most active exchange.
What is Tron?
Tron is a blockchain-based decentralized operating system much like Ethereum that aims to advance the decentralization of the Internet and its infrastructure. At its core, Tron is a smart contract platform that offers high throughput, high scalability, and high availability for all Decentralized Applications (DApps) in the TRON ecosystem. The Tron blockchain is built around the usability of its native token, Tronix (TRX).
Who created Tron?
The Tron blockchain was created by Tron Foundation, a Singapore based organization that is currently headed by Justin Sun. Prior to creating the Tron Foundation, Sun founded Peiwo, an app that aspires to be the Asian Snapchat. This app got Sun into the 2017 Forbes 30 under 30 list.
Sun was also the former Chief Representative of Ripple in China and a graduate of Hupan University.
Tron came about after a successful ICO which raised over $70 million in September 2017.
What is the Value of Tron?
Using the blockchain and its decentralized smart contract capability, the idea of Tron is that users will experience a decentralized internet where “middlemen” such as Google and Facebook are not needed for users to access content.
To draw an example, currently the most ubiquitous video sharing platform is Youtube, which is a privately owned company with privately owned servers that stores and serves video to its viewers. However, using Youtube’s services means that creators and users have to comply with Youtube's terms of service and may have to pay for its content in one way or another. Creators on the Youtube platform may earn a share of Youtube’s revenue, but the pay structure is entirely up to Youtube’s discretion.
Tron aims to replace services such as Youtube and others by becoming the decentralized infrastructure in which users can connect directly with creators and pay the creators directly for the content they wish to consume.
How does the Tron Blockchain work?
The TRON protocol runs on a Delegated Proof of Stake (DPoS) Governance Model. This allows users to perform transactions with close to zero-fee whilst still being resistant towards transaction spam.
Transactions on the Tron Blockchain are maintained by a consortium of Super Representatives (SR) that are voted in by TRX holders who have locked their stake in the form of Tron Power. There are 27 top-voted Super Representatives and 100 Super Representative Candidates. The hierarchy of SR and SR Candidates are readjusted every 6 hours based on the number of votes they receive from Tron Power holders.
Can I mine Tron?
No, you can’t mine Tron because Tron runs on a Delegated Proof of Stake consensus algorithm. This is different from Bitcoin which uses the Proof of Work algorithm. New Tron tokens are created as block rewards for elected Super Representatives. This serves as an incentive to the Super Representatives in maintaining the integrity of the Tron network. You can participate by staking your TRX and voting for your desired Super Representative.
What can I do on Tron?
At its core, Tron is a smart contract platform. Specifically, it is built to be Ethereum Virtual Machine (EVM) compatible, meaning it has a Turing complete virtual machine capability. Executing smart contracts on Tron is similar to Ethereum.
On the other hand, whilst Ethereum operates on the gas fee transaction model, Tron operates on the Bandwidth model, which is similar to that of EOS. This is how transactions on Tron can be much cheaper and more seamless than Ethereum.
Just as one can issue smart contract tokens such as ERC-20, ERC-1155 and others on Ethereum, it is also possible to issue smart contract tokens on the Tron too. There are currently 2 token standards possible on Tron, namely TRC10 and TRC20.
Various TRC10 and TRC20 tokens have been issued on Tron with various use cases.
Where can I use my TRX?
There are numerous Decentralized Appliactions (Dapps) built on the Tron Blockchain, many of which require the use of the native Tronix (TRX) token. You can easily swap your TRX for TRC10 tokens which are used by many Dapps on the Tron Blockchain such as BitTorrent, 888Tron and others.
How to store my TRX?
The Tron Foundation has made it very easy for users to store and utilize TRX in their day-to-day online activities. The Foundation recommends TronLink and TronWallet as their official community developed wallet. You can also store and use your TRX in most other widely recognized wallet brands such as Trust Wallet, Ledger, Cobo Wallet and others.
Where can I trade TRX?
You can see the full list of exchanges trading TRX right here on this page. CoinGecko continually tracks the latest market movement of TRX and provides this data for you.

TRXUSDT-SHORTBased on technical factors there is a short position in :
TRXUSDT TRON
Score 2️⃣
🔴Short Now or set on Key Level 0.05900
🟢Target 1 0.05610
🟢Target 2 0.05270
❌Stop loss 0.06000
#K_Level
Every signal has a score from 1 to 5, so accordingly adjust your risk for each signal. The signals with the score of 5 are the most probable ones.
Please support our activity with your likes and comments.

TRX/USDT 1DAY UPDATE BY CRYPTOSANDERSWelcome to this quick
TRX/USDT analysis update
I have tried my best to bring the best possible outcome in this chart.
Reason of trade:-TRX/USDT is triangle pattern create and buy the dip green zone and long term hold
Entry:- CMP And buy the dip in the green zone
Target:- 275%
Stop loss:- 0.035
Remember:-This is not a piece of financial advice. All investment made by me is under my own risk and I am held responsible for my own profit and losses. So, do your own research before investing in this trade.
Happy trading.
Sorry for my English it is not my native language.
Do hit the like button if you like it and share your charts in the comments section.
Thank you...

TRXUSDT - Long Idea 4h💡💡#IDEA 💡💡
TRX / USDT
Buy at the close of the 4h candle above the blue line. Stop trigger by 4h
TRX draws two setups at once. But we must wait for the trigger candle to go up, because the market is not predictable now and it is dangerous to buy from the current ones.
#TRXUSDT_4h_280122

$TRXUSDTTRON Coin Price & Market Data
TRON price today is $0.060143544665 with a 24-hour trading volume of $579,481,858. TRX price is up 3.6% in the last 24 hours. It has a circulating supply of 100 Billion TRX coins and a total supply of 102 Billion. If you are looking to buy or sell TRON, HitBTC is currently the most active exchange.
What is Tron?
Tron is a blockchain-based decentralized operating system much like Ethereum that aims to advance the decentralization of the Internet and its infrastructure. At its core, Tron is a smart contract platform that offers high throughput, high scalability, and high availability for all Decentralized Applications (DApps) in the TRON ecosystem. The Tron blockchain is built around the usability of its native token, Tronix (TRX).


TRX to touch the support lineEven though TRX is bullish on the short term due to the bounce from the oversold area and the bullish divergence, i see this just as a support and resistance play from which it will end up at $0.050.
Looking forward to read your opinion about it.

Tron SHORT TO $0.03 - $0.02Tron is one of my favorite Altcoins, and I believe it's going through an A-B-C correction. This looks like a zig-zag correction so the zig-zag correction is a 5-3-5 wave correction and I believe it might do the following next:
We are now in the 5 wave series of Wave(C) - it's at sub-wave(4). I believe SW(4) will be played in the Sub-wave 4 zone in the diagram 0.045 TO 0.065 and it's going to be a complex wave that's going to be for a few days if not weeks. The interesting fact about this zone is it's the confluence of 78.6% retracement of the BIG wave from 0 to 0.18 and also a 61.8% fib-extension of corrective wave A & B
Now coming to it's at sub-wave(5) and to see where it ends. I believe SW(5) will end in the REVERSAL zone 0.025 TO 0.03. The interesting fact about this zone is it's the confluence of 88.6% retracement of the BIG wave from 0 to 0.18 and also a 78.6% fib-extension of corrective wave A & B
Please provide your feedback, like and share is appreciated

Tron (TRX) formed a big bullish Shark for upto 144.5% huge moveHi dear friends, hope you are well and welcome to the new trade setup of Tron ( TRX ).
Previously we had a nice short term trade of TRX:
Now during the current crash, on the weekly time frame chart, TRX has bullish harmonic Shark pattern for a big bullish reversal move. Right now after completing the final leg it is moved slightly up, therefore, we can wait for the candlesticks to re-enter the buying zone.

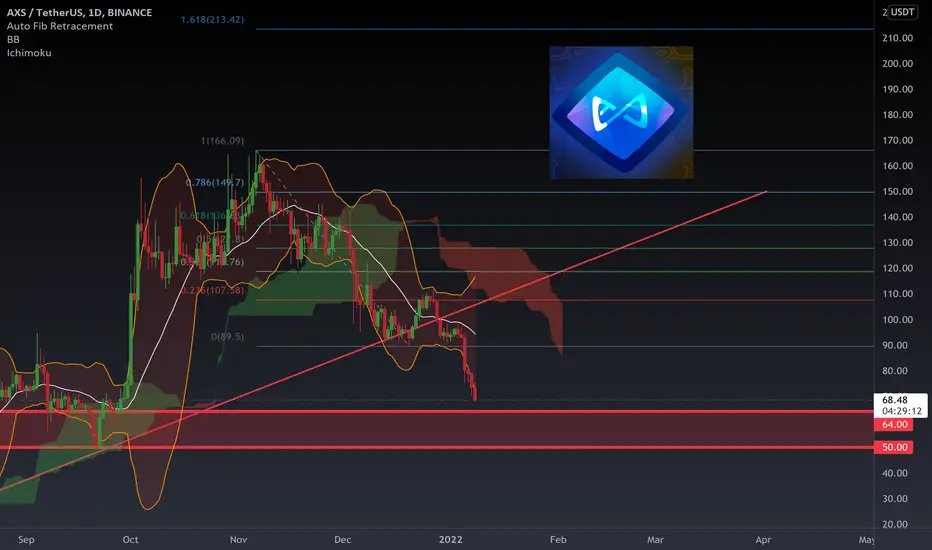
Add some AXS in the $ 50 to $ 64 rangeAXIE INFINITY By breaking its long-term positive trend line has entered further correction and has reached beautiful levels to buy. Add some AXS in the $ 50 to $ 64 range, which are good places to buy for holding. After price flooring, it will start its positive movement compared to other cryptocurrencies.

TRX shortTron is completely bearish. After the bounce off the major resistance level, $TRX broke through the ascending trendline and now is breaking though its minor support level. Bearish movement to local low at 0,06$ is expected to happen.

Very bulliah chartAPENFT has been trap in an accumulation box with %60 chance of breaking to the upside.
you can take the trade with the stoploss below the yellow line

TRXUSD Exit At Price 0.0735TRON (TRXUSD) Long Trade Idea. Recommendation is to trail stop loss to target price.

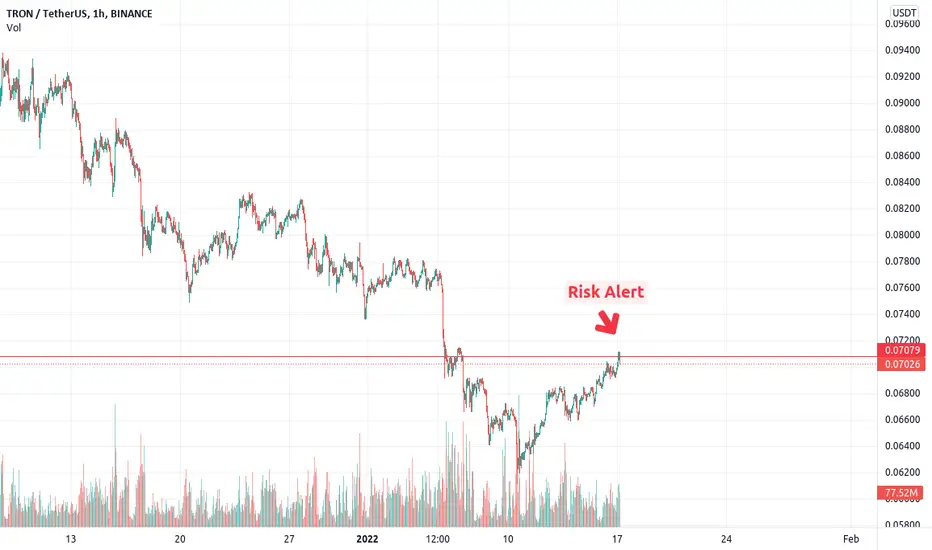
Tron Risk AlertRisk Alert for TRXUSDT traders in 1H timeframe at 0.7060 USDT.
This is just a risk alert and does not necessary mean that the price will dump.
TRX (TRON) WILL BREAK RECENT LOWTRX (TRON) will break recent low and after that where it can go this is confusing for now because i can see 2 alt count.
DISCLOSURE - Please be informed that the information I provide is not a trading recommendation or investment advice. All of my work is for educational purposes only. All labeling and wave count have been done by me manually and I will keep changing according to the LIVE MARKET PRICE ACTION. So don't bias, hope on my trade plans. Try to learn Elliott Wave or other strategies and make your own strategy. Following is not that much easy. I am not responsible for any losses if u took the trade according to my trade plans.
#TRX #TRON

Tron TRXUSDT - 2020 Wedge + Breaking down on the weekly chart- The current situation for TRX on the weekly timeframe is not looking good right now.
- The price is now below the main trendline established in March 2020.
- Also we are breaking down from the ascending broadening wedge.

trx dailycorrection target in 4 hours time frame is going to happen . after receiving the target short trend is a possible scenario if price action confirm it.
