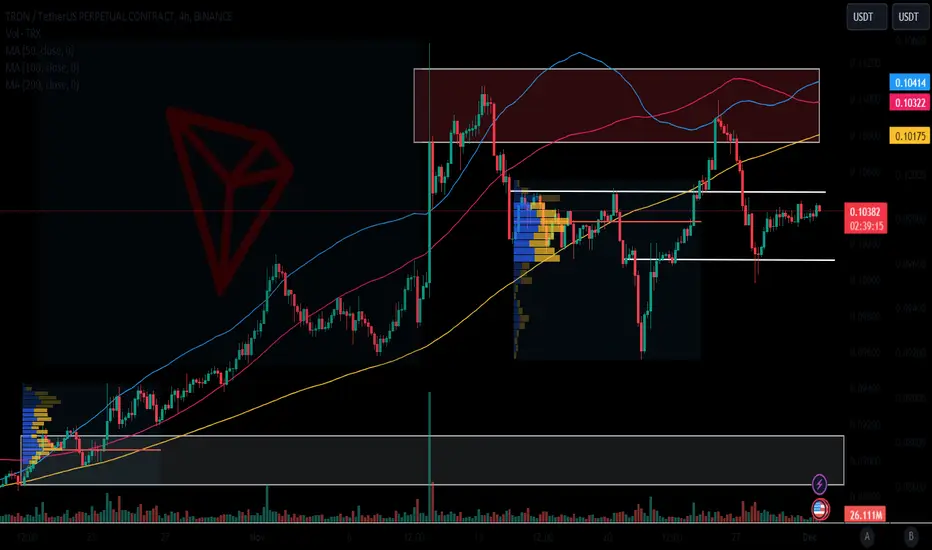
TRXUSDTBINANCE:TRXUSDT analysis
I'm not interested right now but I'm looking for a short opportunity.
⛔"Daily crypto market analyses I provide are personal opinions & not financial advice. Trading carries risks, so do your own research & seek advisor's help. #DYOR
Don't forget to 🚀 and comment.
TRX

Signal again in high & low(TRX)❤️❤️Thanks for boosting 🚀 and supporting us!
📊 (Entry) : 0.10233(buy)- 0.10832(sell)
🔴 Stop Loss : 0.1(buy)- 0.11035(sell)
🎯 Take Profit : TP-1 = 0.10357 (TP-2 in entry reverse position)
🔗 For more communication with us, In the footnote and send a message in TradingView.
👨🎓 Experience and Education: Our trading team has five years of experience in financial markets, especially cryptocurrencies.

TRXUSD - Global Idea dump on 37% in autumnWhat will happen to the coin in the near future with a high probability. Buy exclusively from these zones and the red zone is a squiz zone if bitcoin is very bad and it falls badly in autumn. The expected start of the bull race on TRON TRX is waiting for a week-long candle on November 14

Tron TRX aiming for 0.13 short termBullish pennant, break out, retest, go! I just put it out here to see how this turns out.

Tron(TRX) is ready to fallTron has reached and reacted to the extreme orderblock of the minor structure in the daily time frame.
We expect it to start downtrend and fall from this point.
The only way to faild this analysis is a candle closes above the extreme order block, which is also very unlikely.
This is my personal analysis and its not a financial advice.

TRX Gold Corp: A Golden Future Unveiled in Q1 2024
TRX Gold Corp ( AMEX:TRX ) has recently unveiled its first-quarter results for 2024, today painting a picture of triumph in the competitive world of gold mining. The company's robust performance in terms of operating cash flow, gross profit margins, and expansion plans for the year has positioned it as a shining star in the industry.
Impressive Financial Performance:
TRX Gold's ( AMEX:TRX ) first-quarter results reveal a stellar performance, with the company successfully pouring 4,927 ounces of gold and selling 4,895 ounces. The positive operating cash flow of $5.1 million, coupled with a gross profit of $3.7 million and an impressive margin of 40%, underscores the efficiency and financial acumen of the company's operations. Notably, the Adjusted EBITDA of $2.6 million further adds to the glowing financial picture, showcasing TRX Gold's ability to navigate the complexities of the market with finesse.
Strategic Expansion Plans:
Looking ahead, TRX Gold's optimism for 2024 is palpable, with estimated gold production ranging between 25,000 to 30,000 ounces. The company's commitment to maintaining an average cash cost per ounce between $800 and $900 reflects a dedication to operational efficiency and cost management. The ongoing expansion plans, including the increase in processing capacity to 2,000+ tonnes per day, signify TRX Gold's forward-thinking approach to meeting rising demand and securing long-term growth.
Milestones Achieved:
TRX Gold's expansion project is well underway, with the recent arrival of a new 1,000 tpd ball mill on-site in October 2023. The commencement of earthworks for crucial components such as the ball mill plinth, tank line foundation, and bund wall for additional leach tanks emphasizes the tangible progress the company is making in enhancing its infrastructure. The Buckreef Project, where TRX Gold operates, benefits from full licenses for mining and gold extraction, providing a solid foundation for the company's ambitious plans.
Commitment to Sustainability:
TRX Gold's commitment to sustainable growth in the gold mining industry is evident in its reinvestment in the Buckreef Project. The company's dedication to advancing the mill expansion and constructing an expanded tailings storage facility highlights a responsible and forward-looking approach to environmental stewardship.
Conclusion:
TRX Gold Corp's first-quarter 2024 results showcase not only a successful past but also a promising future. The company's commitment to excellence, coupled with its impressive financial performance and strategic expansion plans, positions it as a frontrunner in the gold mining industry. As TRX Gold continues to shine in the market, investors and industry observers alike can look forward to a golden era of growth and success.

TRX (Y24.P1.E1) Macro overviewHi traders,
We spoke about this recent level in our forum and the trading opportunity given,
Details below.
Here is my macro overview with Elliot wave count aligned with fibonacci.
The daily 200 moving averages are the key for the macro trend and its possible that we range here or keep going to the fib extension of 618 in the short period.
Enjoy.
Regards,
S.SAri
The setup
The results

#TRX/USDT LONG#TRX
The price is moving in a cross channel on a 1-day frame
Supported by price stability above moving average 100
It is expected that this descending channel will be broken upward
Current price is 0.10750
First goal 0.11078
Second goal 0.11466

$TRX/BTC 1W (#Binance) Falling broadening wedge retestTron printed a bullish hammer on 200MA weekly support, looks like a golden opportunity!
⚡️⚡️ #TRX/BTC ⚡️⚡️
Exchanges: KuCoin, Binance
Signal Type: Regular (Long)
Amount: 4.5%
Current Price:
0.00000233
Entry Targets:
1) 0.00000223
Take-Profit Targets:
1) 0.00000348
Stop Targets:
1) 0.00000173
Published By: @Zblaba
$TRX #TRXBTC #Tron #DPos #SmartContract
Risk/Reward= 1:2.5
Expected Profit= +56.1%
Possible Loss= -22.4%
Estimated Gaintime= 9-10 months
tron.network

Tron(TRX): Waiting For Resistance To Be Reached! We noticed rather strong resistance, which has been in decline here. The vision is clear here: we want to see another touch in the upper zones and a potential drop from there!
EMAs are currently holding the price, which seems like a good spot to bounce toward resistance.
Swallow Team

TRX | USDT - Tron is part of my Top picks for 2024The recent one-day Tron price analysis confirms a noticeable recovery in the cryptocurrency value today. The price has been covering an ascending path since the past 24-hours, as the buying activity is on the rise. Because of the latest upward spike, TRX/USD value has leveled up to $0.1028 high. On the opposite hand, the Moving Average (MA) value dropped down to $0.1028 because of the previous bearish activity.

TRX/USDT Bullish Potential from Support Zone? 👀🚀TRON Analysis💎 Paradisers, let's focus on #TRXUSDT as it’s currently displaying a compelling pattern. The asset is exhibiting signs that suggest a bullish continuation from its support zone.
💎 Reflecting on #TRON recent market behavior, it has adeptly maneuvered through a descending channel, breaking upwards to signal a positive trend. At present, if TRX successfully retests the key support at $0.10358 and maintains its momentum above this level, there’s a high probability of witnessing a bullish move.
💎 This bullish sentiment is further bolstered by TRX’s strong momentum above the EMA. With sustained upward momentum, AMEX:TRX is likely to aim for the significant resistance at $0.10857.
💎 Additionally, keep an eye out for a possible bullish recovery from a slightly lower support level at $0.10244. However, a break below this level could signal potential difficulties in continuing the bullish trend.
💎 Equally important is being prepared for a shift in market dynamics. If #TRX dips below the $0.10244 support level, it could indicate a notable downward movement in the market. 🌴💰

SasanSeifi 💁♂TRX /USDT 4HHi there,
As you can see in the 4-hour timeframe, the price has had a nice run-up from the demand zone at 0.096, growing 17%. However, it has since been corrected back to the support zone. It's still in a range-bound pattern, but there are a couple of possible scenarios that we can consider.
One possibility is that the price will continue to be range-bound for a while longer. If it can maintain the support and resistance levels at 0.10300/0.10, it could then break out to the upside and reach the next resistance level at 0.10700. If it breaks through this level, it could then reach the next resistance level at 0.11000.
Another possibility is that the price will break down from the support level at 0.096. If this happens, it could then reach the next support level at 0.097.
🔵Remember, always conduct your own analysis and consider other factors before making any trading decisions. Good luck!"✌️
❎ (DYOR)...⚠️⚜️
Sure, if you have any more questions or need further clarification, feel free to ask. I'm here to help!
if you found my analysis helpful, I would appreciate it if you could show your support by liking and commenting. Thank you!🙌

Tron (TRX) completed setup for upto 16% pumpHi dear friends, hope you are well and welcome to the new trade setup of Tron (TRX) with BTC pair.
Previously we caught more than 10% pump of TRX as below:
Now on a daily time frame, TRX formed a bullish AB=CD move for the next pump.
Note: Above idea is for educational purpose only. It is advised to diversify and strictly follow the stop loss, and don't get stuck with trade.

Tron, 5 days consolidationAMEX:TRX inside ascending triangle and already touch fibonacci support 0.10212
this coin already enter accumuation with 5 days and 12 hours consolidation,
you can see I also draw bullish trendline,
in the next hours (not more than 12 hour), this coin will rally to reach triangle resistance,
maybe with little a pump, that indicate the consolidation time already over.
The worst case is fibonacci support at 0.10212 break down, if this happen, I still have ascending triangle support trendline.
My entry :
.10310 current price
.10212 fibonacci support
.10018 Higher low
Target : .11017 Ascending triangle resistance
Risk every entry : .00100
Risk reward ratio : 6.54
Actual profit percentage : 654%
Good luck, happy trading.

SUN/USDT 1D. Main trend. Secondary. Local. All main details.Coin Sun. This is an altcoin from the TRX ecosystem. Other coins in this ecosystem are: NFT, JST, BTTC(BTT), TRX.
On the backstage of XRP rise(China money partly) TRX class of assets also look very interesting.
In this idea i'll share my view on SUN from TRX group of assets.
From the beginning of the trading history coin has been dumping, which is basic for almost every altcoin.
After reaching certain prices trend reversed and broke the main downtrend.
After that the retest followed and that was also the moment of the beginning of big diamond forming.
I remind you that diamond is a reversal of the trend pattern, also consider the timeframe it's forming on(the bigger the TF the stronger the formation).
This diamond is forming already for something about 400 days.
Local and midterm trends are shown on the chart. Also consider the volume spring shown, which means that there's a potential for big impulse soon.
Local targets and zones are shown on the chart.
Capitalization of this coin is 55m$ as for the moment of writing. So there's quite a potential of 10x on the high of the trend. This will be 666 zone...

Tron ($TRX) Exhibiting Strong Growth Potential
TRX buyers have been quite active, causing the cryptocurrency to test the resistance zone of $0.110-$0.113 on three occasions since November 8, as it tries to break through this range and set a new yearly high.
Currently, there's a noticeable reduction in TRX's volatility, making it likely to see short-term trading within a flat range, specifically between support levels of $0.100 and $0.106. The potential for the TRX growth still exists as long as BTC remains trading above the $31,000 threshold.
A correction in TRX's trajectory is not expected to lead to significantly negative outcomes. If there is a decline, Tron might retest the support levels at $0.095-$0.097, $0.0935, and $0.0885-$0.0905. Given its robust upward trend, TRX is viewed as a viable addition to portfolios, particularly during periods of BTC correction.
TRX is coming to unload!!!The redistribution of the coin occurred in the Control ZONE 0.0458-0.0870
The average volume price is 0.656
We are going to unload in the ZONE 0.293-0.989
To the level of 0.489

TRX/USDT Ready for an Explosive Journey? 👀🚀TRX Analysis💎Yello, Paradisers! brace yourselves for an exciting trading prospect with TRXUSDT. Currently, the asset is displaying substantial activity in the demand zone, hinting at a likely upward trend shift.
💎Tron has been consistently adhering to a trading channel pattern. Its breakout above this channel recently indicates a potential ascent towards a resistance level, followed by an expected quick retraction, consistent with its typical trading behavior.
💎There's a notable probability of a bullish movement commencing from the support level around $0.098. With TRX having successfully emerged from the trading channel upwards, it's now eyeing resistance levels near $0.12.
💎Effective timing is crucial for savvy Paradisers. It's important to identify the optimal entry points during this upward movement, and it's advisable to be cautious about entering at the peak of the trend.
💎Exercise caution, as there's a possibility of TRX dropping below the support level of $0.094. A fall beneath this crucial mark could lead to questions regarding the continuation of the upward trend.

Tron Bullish signalWe have identified a strong bullish setup on the TRXUSDT H4 chart. The bullish order block appears robust enough to sustain its uptrend, with a risk-reward ratio of 1/5

TRXUSDTBINANCE:TRXUSDT Long idea
⛔"Daily crypto market analyses I provide are personal opinions & not financial advice. Trading carries risks, so do your own research & seek advisor's help.#DYOR"
Don't forget to like and comment

TRX Ready for Parabolic Bullish Cycle ⬆BINANCE:TRXUSDT
Hi Traders, Investors and Speculators of the Charts 📈📉
Ev here. Been trading crypto since 2017 and later got into stocks. I have 3 board exams on financial markets and studied economics from a top tier university for a year.
After finally breaking out of triangular consolidation, TRON has confirmed a reversal after the bearish market and is starting a new bullish cycle. From the left we analyze the trend lines to get targets for the next bullrun and on the right we take a quick look at technical indicator CryptoCheck START V3.5 to confirm the bullish bias.
INCASE YOU MISSED IT : 👉 Another altcoin recently formed a bullish pattern:
_______________________
📢 Show us some LOVE 🧡 Follow for daily updates and trade ideas on Crypto , Stocks , Forex and Commodities 💎
We thank you for your support !
CryptoCheck

TRX/USDT: TRON Confirmed breakout for LONG tradeAs we can see from the chart, TRON has a clear breakout from its resistance. This is a good time to enter a LONG trade.
Entry Price: 0.104
StopLoss: 0.100
TP1: 0.1068
TP2: 0.1105
TP3: 0.1128
Like and follow us and share your thoughts in the comments.
Cheers
GreenCrypto
