TRX is in a dangerous placeThis analysis is an update of the analysis you see below in the "Related Ideas" section.
The triangle of the previous analysis is still standing and only the D wave has become more time-consuming.
We expect the formation of wave E from TRX.
It can be rejected from the supply range to the green box.
The targets are marked on the picture.
Closing a daily candle above the invalidation level will violate the analysis.
For risk management, please don't forget stop loss and capital management
When we reach the first target, save some profit and then change the stop to entry
Comment if you have any questions
Thank You
TRXBTC

Tron (TRX) completed a setup for upto 20.50% pumpHi dear friends, hope you are well and welcome to the new trade setup of Tron (TRX).
Previously we caught 10% pump of TRX as below:
Now on a daily time frame, TRX with Bitcoin pair has formed a bullish Cypher move for the next pump.
Note: Above idea is for educational purpose only. It is advised to diversify and strictly follow the stop loss, and don't get stuck with trade.

Need to check if the rise can continueHello, traders.
If you "Follow", you can always get new information quickly.
Please click "Boost" as well.
Have a nice day today.
-------------------------------------
(1M chart)
It fell near the Fibonacci ratio 1 (0.13571) and touched near 0.10447 and is currently maintaining the price.
-
(1W chart)
The key is which section it deviates from among the support or resistance sections shown on the chart.
The current medium- to long-term trend is maintaining an uptrend, but if it falls below 0.10447, it is judged that it is likely to turn into a downtrend.
-
(1D chart)
Therefore, the key is whether the price can be maintained by rising above the sell line of the superTrend indicator.
If not, you should check for support near the box section of the HA-Low indicator on the 1D chart.
You should check whether the price can be maintained by rising above the Fibonacci ratio of 0.786 (0.11732).
The key is whether the price can be formed by maintaining the bottom section near the HA-Low indicator on the 1D chart.
-
Have a good time.
Thank you.
--------------------------------------------------
- Big picture
It is expected that a full-scale uptrend will begin when it rises above 29K.
The section that is expected to be touched in the next bull market is 81K-95K.
#BTCUSD 12M
1st: 44234.54
2nd: 61383.23
3rd: 89126.41
101875.70-106275.10 (overshooting)
4th: 13401.28
151166.97-157451.83 (overshooting)
5th: 178910.15
These are points where resistance is likely to occur in the future.
We need to check if these points can be broken upward.
We need to check the movement when this section is touched because I think a new trend can be created in the overshooting section.
#BTCUSD 1M
If the major uptrend continues until 2025, it is expected to start forming a pull back pattern after rising to around 57014.33.
1st: 43833.05
2nd: 32992.55
-----------------

TRX ( TRON ) tm:1hHello traders.
I hope you doing well.
These areas are based on my personal strategy and I will share it with you.
Open a sell position on the supply area or open a buy position on the demand area.
Your entry point, stop loss, and target point are based on money management and the amount of money in your trading account.
But I promise you that by trading in the areas of my trading strategy, you will definitely make a profit, because these areas, although they seem simple, are my experience of 8 years of learning and trading.
I hope you will achieve maximum continuous profit with me by using supply and demand areas.
Good luck traders.
Mohammad Goodarzi

TRX is pumping. Time to buy? Here is whyTRX is going higher on the weekly chart. We have a reliable uptrend without any issues, and the trend should continue in the next few weeks. On the chart, you can see a descending triangle that broke bullishly. What does it mean? Usually, when a descending triangle breaks bullishly, we want to buy it with a profit target at the top of the triangle, which is at 0.18 USDT. This is where you want to take a profit before a huge bearish correction. Let me know what you think about my analysis, and please hit boost and follow for more ideas. Thank you, and I wish you successful trades! Trading is not hard if you have a good coach!
TRON has positioned itself as an environment where content creators can connect with their audiences directly. By eliminating centralized platforms — whether they are streaming services, app stores or music sites — it is hoped that creators won’t end up losing as much commission to middlemen. In turn, this could also make content less expensive for consumers. Given how the entertainment sector is increasingly becoming digitized, TRON could have a headstart in applying blockchain technology to this industry.
The company also says that it has a talented and experienced developer team, based around the world, that has been drawn from major companies such as Ripple Labs.
Last but not least, whereas some other blockchain projects can be opaque about their plans for development, TRON offers a point of difference by delivering a roadmap that shows its intentions for the coming years. Let me know what you think about my analysis, and please hit boost and follow for more ideas. Thank you, and I wish you successful trades!

TRX's Next Bull Run Will Melt FacesTRX has never held this strong compared to other bull runs. It's printed an interesting 3-year old bull flag. And if the price holds well above and retests with conviction, we could see the start of an impulsive wave next.
TRX has historically been the punching bag of negative sentiment in crypto and that is changing. Justin Sun has recently embraced his bias and has gone fully decisive with the introduction of the offshore Chinese Yuan (CNH) support and going as far as touting its strength vs $USD.
I put my TP for the next bull run. The price puts TRX at a MC of $128B or 10x its MC from the previous ATH. 10x is in my opinion a conservative figure in crypto.
If there will be a blow off top then TP2 is it IMO.
Not Financial Advice

#TRX/USDT#TRX
The price is moving in an upward trend in blue on a 2-day frame, and the price adheres to it
We have a higher stability moving average of 100
The RSI indicator has a long-term uptrend
The stop is below the uptrend if it is broken
Entry price is 0.1243
The first target is 0.1312
The second target is 0.1378
The third goal is 0.1456

Touching the HA-Low indicator means...Hello traders!
If you "Follow" us, you can always get new information quickly.
Please also click “Boost”.
Have a good day.
-------------------------------------
(TRXUSDT 1M chart)
It appears that a new HA-High indicator is about to be created.
Accordingly, we need to check whether the HA-High indicator is generated at the 0.10447 point.
If the HA-High indicator is created at the 0.10447 point, the key is whether it can be supported and rise around that area.
(1W chart)
The key is whether the price can be maintained by receiving support in the current section and rising above 0.13052.
If not, and it falls below 0.786 (0.11732), it is likely to fall to around 0.618 (0.10288).
If it falls like that, there is a high possibility that it will turn into a downward trend, so you need to think about ways to respond to the decline.
(1D chart)
The HA-Low indicator was first touched on August 20, 2023, and then again on March 21, 2024.
Accordingly, the key is whether it can be supported and rise around 0.12002, which is the point where the HA-Low indicator is currently formed.
The HA-Low indicator is an indicator that indicates the boundary of the low point section.
Accordingly, support from the HA-Low indicator can be said to mean that a bottom section is forming.
If it falls below the HA-Low indicator, it means that the low point is renewed, and a cascading decline is likely to continue.
Therefore, a trading strategy should be created depending on whether support or resistance is found around 0.12002, which is the currently formed HA-Low indicator point.
Since the MS-Signal indicator is formed around 0.12296, the key is whether it can rise above 0.12296.
If that happens, there is a high possibility that it will rise near the HA-High indicator, so there is a possibility that it will rise to around 0.13997, which is the point where the HA-High indicator is currently formed.
However, as the price rises, there is a possibility that a new HA-High indicator will be created, so if a new HA-High indicator is created, support must be received near it to continue the upward trend.
TRX is one of the coins that is expanding the coin ecosystem.
I think it will be a good textbook for expanding the coin ecosystem I selected and understanding the trend as the first coin to touch the HA-Low indicator.
Have a good time.
thank you
--------------------------------------------------
- The big picture
The full-fledged upward trend is expected to begin when the price rises above 29K.
This is the section expected to be touched in the next bull market, 81K-95K.
#BTCUSD 12M
1st: 44234.54
2nd: 61383.23
3rd: 89126.41
101875.70-106275.10 (when overshooting)
4th: 13401.28
151166.97-157451.83 (when overshooting)
5th: 178910.15
These are points that are likely to encounter resistance in the future.
We need to see if we can break through these points upward.
Since it is thought that a new trend can be created in the overshooting area, you should check the movement when this area is touched.
#BTCUSD 1M
If the general upward trend continues until 2025, it is expected to rise to around 57014.33 and then create a pull back pattern.
1st: 43833.05
2nd: 32992.55
-----------------

TRX ANALYSIS (1D)TRX seems to be completing a large bullish triangle, which has now ended wave D and we have entered wave E of this large triangle.
The green range is a good place to rebuy.
Closing a daily candle below the invalidation level will violate the analysis
For risk management, please don't forget stop loss and capital management
Comment if you have any questions
Thank You

TRX Achieves Third Target with a 74% Surge! 🚀🚀
Exciting news for TRX enthusiasts! The TRX cryptocurrency has successfully hit its third target, experiencing a remarkable 74% surge. The current price stands at an impressive $0.011349, marking a significant milestone in TRX's upward trajectory. Traders and investors are buzzing with anticipation as TRX continues to showcase its resilience and potential for substantial gains. Stay tuned for further market insights and potential opportunities in this dynamic digital currency landscape. #TRX #CryptoSuccess

Why +208% on TRX is an underestimation ?#TRX/USDT Analysis
Description
---------------------------------------------------------------
+ TRX has been moving upwards slowly while forming the cup pattern.
+ This slow move of the TRX has given it enough time for the accumulation
+ Once the price breaks this resistance line i'm expecting back to back God Candles.
+ This is a good opportunity to enter a LONG position with TRX.
---------------------------------------------------------------
VectorAlgo Trade Details
------------------------------
Entry Price: 0.13866
Stop Loss: Below 0.09780
------------------------------
Target 1: 0.17930
Target 2: 0.22480
Target 3: 0.30028
Target 4: 0.43250
------------------------------
Timeframe: 1W
Capital: 1-2% of trading capital
Leverage: 5-10x
---------------------------------------------------------------
Enhance, Trade, Grow
---------------------------------------------------------------
Feel free to share your thoughts and insights. Don't forget to like and follow us for more trading ideas and discussions.
Best Regards,
VectorAlgo

Could TRON #TRX 6X v #BITCOIN TRXBTC
has very good market structure
(higher high's , higher lows's)
for the past 3 years.
Overlooked , & under-appreciated it seems like, in my view on it's sentiment on Justin's success of network adoption.
We can see a clear Inverse head and shoulders
with a very key neckline level
that if broken with strength
could a indicate a run at the LOG target.
A disappointing TRX may only reach the linear target and not much beyond.
My TRXUSD chart which I am watching also does point to a stellar Bull market for TRX

TRON looks like it wants to make a run northward!If Tron can breakout of the .1106 level, it might be able to run hard for a bit. It's above the 50 DMA and the 200 DMA on the 15 min chart as we speak.

Signal again in high & low(TRX)❤️❤️Thanks for boosting 🚀 and supporting us!
📊 (Entry) : 0.10233(buy)- 0.10832(sell)
🔴 Stop Loss : 0.1(buy)- 0.11035(sell)
🎯 Take Profit : TP-1 = 0.10357 (TP-2 in entry reverse position)
🔗 For more communication with us, In the footnote and send a message in TradingView.
👨🎓 Experience and Education: Our trading team has five years of experience in financial markets, especially cryptocurrencies.

TRXUSD - Global Idea dump on 37% in autumnWhat will happen to the coin in the near future with a high probability. Buy exclusively from these zones and the red zone is a squiz zone if bitcoin is very bad and it falls badly in autumn. The expected start of the bull race on TRON TRX is waiting for a week-long candle on November 14

#TRX/USDT LONG#TRX
The price is moving in a cross channel on a 1-day frame
Supported by price stability above moving average 100
It is expected that this descending channel will be broken upward
Current price is 0.10750
First goal 0.11078
Second goal 0.11466

$TRX/BTC 1W (#Binance) Falling broadening wedge retestTron printed a bullish hammer on 200MA weekly support, looks like a golden opportunity!
⚡️⚡️ #TRX/BTC ⚡️⚡️
Exchanges: KuCoin, Binance
Signal Type: Regular (Long)
Amount: 4.5%
Current Price:
0.00000233
Entry Targets:
1) 0.00000223
Take-Profit Targets:
1) 0.00000348
Stop Targets:
1) 0.00000173
Published By: @Zblaba
$TRX #TRXBTC #Tron #DPos #SmartContract
Risk/Reward= 1:2.5
Expected Profit= +56.1%
Possible Loss= -22.4%
Estimated Gaintime= 9-10 months
tron.network

Tron (TRX) completed setup for upto 16% pumpHi dear friends, hope you are well and welcome to the new trade setup of Tron (TRX) with BTC pair.
Previously we caught more than 10% pump of TRX as below:
Now on a daily time frame, TRX formed a bullish AB=CD move for the next pump.
Note: Above idea is for educational purpose only. It is advised to diversify and strictly follow the stop loss, and don't get stuck with trade.

TRX/USDT: TRON Confirmed breakout for LONG tradeAs we can see from the chart, TRON has a clear breakout from its resistance. This is a good time to enter a LONG trade.
Entry Price: 0.104
StopLoss: 0.100
TP1: 0.1068
TP2: 0.1105
TP3: 0.1128
Like and follow us and share your thoughts in the comments.
Cheers
GreenCrypto

TRX/USDT , Technical analysis , CyclicityInteresting active , TRX/USDT , Timeframe 1 week.
Cyclicality in the market, please pay attention to my idea TRX/BTC

TRON/BTC , Ascending triangle , timeframe 1 weekFormation of an ascending triangle on such a large timeframe.
Working out of the previous descending triangle is shown by red lines!
Price is clamped in the triangle, volumes are decreasing, there is a possibility of accumulation of coins before the breakout and achieving the specified goals
Thank you for your attention

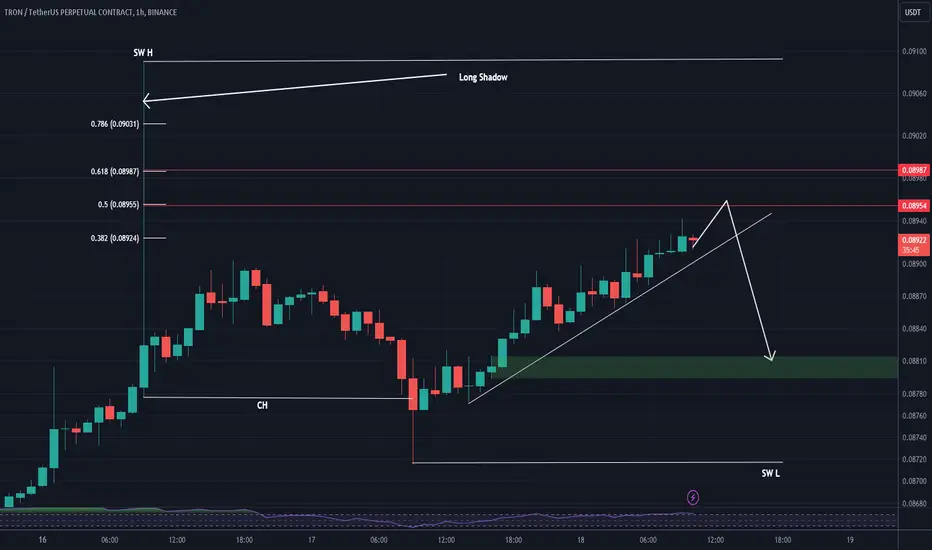
TRX can have a crash (has an educational point)TRX can have a crash
There is an educational tip here, pay close attention:
Educational tip: When we have long shoadow, the price tends to fill 50-60% of these shodows and then continue in the opposite direction. If a CH is in the opposite direction of the long shadow, we have more confirmation.
If more than 70% of the log is filled, it is possible to pass the log.
Above 0.07679: Expected to create a new upward waveHello?
Hello traders!
If you "Follow" us, you can always get new information quickly.
Please also click “Boost”.
Have a good day.
-------------------------------------
Since we operate a stablecoin based on TRX, a drop in price can be a very dangerous warning.
Accordingly, it is one of the coins (tokens) that must be certain about how profits will be realized during trading.
In that sense, if it falls below 0.05378, it is necessary to check the movement of the stable coin (USDD).
(TRXUSDT chart)
If the price remains above 0.07679, it is expected to create a new wave.
(1W chart)
It is necessary to check whether the price can be maintained above 0.07725 and rise above 0.11964.
(1D chart)
Since it has fallen from a rising channel, I think it is highly likely that the current trend will continue until a new trend is created.
Since the StochRSI indicator is currently in the oversold zone, it is necessary to check at which point or zone it receives support or resistance when it leaves the oversold zone.
Accordingly, it is necessary to check whether it can quickly rise above 0.08867 or be supported around 0.08177.
-------------------------------------------------- -------------------------------------------
** All explanations are for reference only and do not guarantee profit or loss in investment.
** Trading volume is displayed as a candle body based on 10EMA.
How to display (in order from darkest to darkest)
More than 3 times the trading volume of 10EMA > 2.5 times > 2.0 times > 1.25 times > Trading volume below 10EMA
** Even if you know other people’s know-how, it takes a considerable amount of time to make it your own.
** This chart was created using my know-how.
---------------------------------
