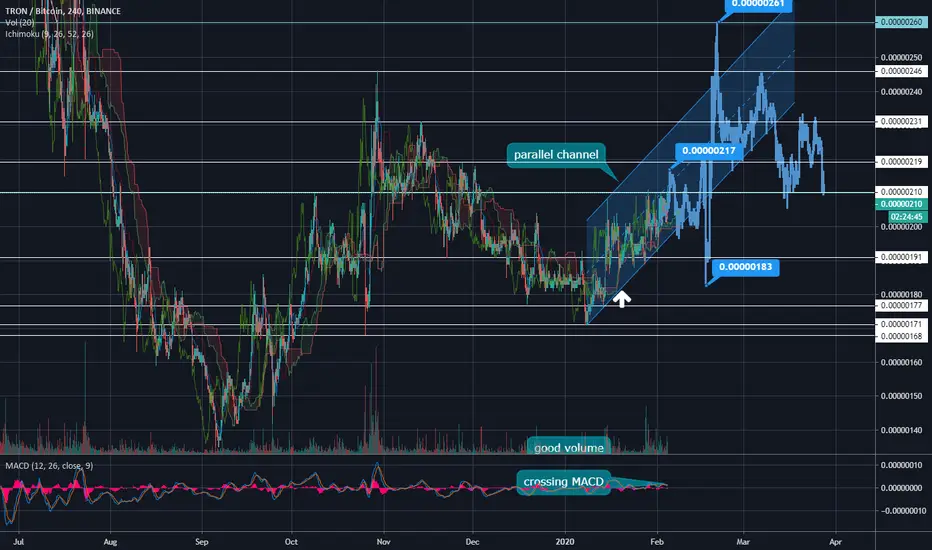
TRX/BTC BINANCE4H Candles
As far as price stays in the parallel uptrend channel,
we have bullish movement
Bar Pattern repetition expected
MACD is crossing
volume is rising
TRXBTC

TRX/ETH TA Update (0.618 Fib Support Target?)TRX/ETH
TRX broke immediate support area 9880 and failed to get above daily EMAs.
I'm looking for the next support at 0.618 Fib levels before we could see a pump to the upside.

TRON, like other crypto...The price is close to the Support/Resistance Zone. It can continue to grow like other crypto.
The best buy will be after the breakout and pullback to Zone.
Dear followers, the best "Thank you" will be your likes and comments!
Before to trade my ideas make your own analysis.
Thanks for your support!

[300% ROI] SEEMS REASONABLE TRONBTCIt broke its long term channel and made first impulse and retraced.
Good place to be a buyer here. It stayed more than 4 months and consolidate.
Maybe 1 or 2 months it CAN go sideways but i need to buy from this areas.
My setup like that:
Buy: 200 sats
Sell: 603 sats
Stop: 130 sats
Trade time: It should resolve in 2020. (Mid-term trade)
R:R (Risk to reward): more than 6
If I can sell trx from 603 sats it means I will gain more than 300% ROI which is reasonable.
If you like this format, trade setups like, share and follow for more. Thank you.
You can check my other mid-long term analyisis on BTC here;

TRON can pump nicelyTRX - Tron had a falling wedge break out yesterday.
Price is currently testing 200DMA as resistance. Expecting a 20% rise once price break above 200DMA.
TRON can pump nicely in the next few days.
Trade Signal:
Entries: 0.00000185-195
Exit: 0.00000225-240
STOP: 0.00000175

TRX/BTC BINANCE4H Candles
Tron has not pump yet so...
Bar Pattern Repetition expected
volume rising
bullish MACD
3 SUPPORT AREAS
up to 80% profit in 54 days
Good Luck

TRX breaking resistance linein the daily time frame, we can see a break in our trend line and the candles crossed the 200MA with a good space between candles and moving average

TRX/BTC 4H CANDLESAs far as price stays in the parallel uptrend channel,
we have bullish movement
Bar Pattern repetition expected
MACD is crossing
volume is rising
If price breaks up or down the parallel channel,
new analysis is needed
Our Tron (TRXH20) Trade Pays 320%+... More Is PossibleTake a look at Tron (TRXH20) .
TRXH20 is the BitMEX "instrument"/trading pair we use to trade Tron with leverage.
We share a trade here on Trading View and these are the results...
Over 320% of profits with 10X leverage, here is the chart:
The best part is that this is only the beginning... The entire altcoins market will continue to grow.
Namaste.


TRXBTC now 32% up from Our entry TRXBTC now 231 Satoshi.
And went upto 239 Satoshi.
according to Technical Analysis I told you our entry was 188 Satoshi.
now I am booking some profit.
still chance to TP2 but I will wait for dip.
congrats guys.
Please like and follow me for latest crypto updates.
Thank you

TRX at 220 sat resistance Opened a short position at 220 sat. Strong resistance here. Divergence at 2h.
2 possibilities are shown at the chart. Targets 211 sat and 202 sat.

TRX breaks out - up 13% in past 30 minutesTron has just broken out of a giant pennant it has been moving within for the past six months, including a move above the weekly 21 EMA and any other key moving average you care to name. This will be a crucial time now to see if TRX will continue up to join the alt party which has been gathering momentum over the past few days.
Save crucial space on your Trading View chart by utilising the free RSI and StochRSI indicator which overlays both in a clear and helpful fashion. Add the essential EMA/SMA indicator to your chart too.
Please give me a thumbs up and follow me if you found my analysis interesting. This is for educational purposes only and not a recommendation to buy or sell.

TRX / BTC Falling Wedge. Cycle. Work on a coin.TRON after a local maximum formed a local downtrend. This trend has formed a downward wedge .
If this wedge works out on a global scale, a double bottom will form, which will become a reversal pattern of the main trend.
ENTRANCE
1) on the breakthrough of the line of resistance of the wedge . (maybe it’s happening now).
2) on confirmation of support in the region of 130-150 satosh if the price reaches there.
Stop loss
Under key support levels during your entry into the market.
Do not forget to move Stop Loss during the price increase, but take into account the volatility of the coin.
TARGET
On the chart, I showed the first potential movement when trading in a local trend.
To see in the global where the price is, look at these previous training ideas, where this coin was used as an example.
1) TRAINING. Theories of the Dow. Types of trends. Phase TRON. There is still a bit
TRON Lateral movement. Possible formation of a double bottom .

TRX/BTC 28%??RSI = Bullish Divergence and going into a bullish region
200 ma (black line) = Sitting nicely above this
Price Action Vigor = We have a nice tick up on the PAV
Super Guppy is also turning bullish again which could signal a decent move up
Buy and hold

TRX/BTC 16% up and towards Target 1 and Target 2#TRXBTC Chart Update:
Our Entry was 188 Satoshi.
#TRX now 16% from our Entry.
and TRX went upto 218 Satoshi and now trading at 215 Satoshi.
Now Good sign for Candle Close above Trend line.
Towards TP1 & TP2.
Support 1: 210 Satoshi
Support 2: 200 Satoshi
Resistance : 231/274 Sat.
Please like and follow me guys for latest crypto updates.
Thank you

Tron Conquers New Resistance, Extremely Bullish (600%+)Tron (TRXBTC) continues to build up in anticipation of a very strong bullish move... This move has been in the making for long.
I believe we are about to see Tron print some really good numbers.
The charts are really bullish on the daily timeframe and MA200 has been fully conquered.
This is a bullish/green chart.
TRXBTC Weekly:
On the weekly, we can see volume starting to grow and the chart looking really bullish after TRXBTC conquered EMA10 (0.00000196).
Below is another chart for Tron (TRXBTC), here I am sharing with you the long-term targets including a new ATH.
Thanks a lot for reading... Remember to hit LIKE if you enjoyed the content.
Namaste.

TRON WILL SHINE SOONAs you can see tron is range bound in the accumulation zone. Might be awhile before we eventually break out. Once we close over the top we should be in for a ride. If you don't have a position and are looking to get in I'd buy the bottom of the accumulation zone, or wait for a breakout and try to catch a retest. Target is monthly Resistance.


TRX ANALYSIS (WEDGE BREAKOUT, 220 SATS INCOMING?)TRX ANALYSIS:
TRX has finally pushed in a very positive bullish manner outside of the falling wedge shown in the chart. Look for entry back at 50 MA at 190-195 sats. I expect this run to continue, the volume backed by the dominance of BTC falling is positive in all ways. Look for T1 back at 199 sats, followed by the break above 200 sats to T2 at 209 sats and T3 at 220 sats. These are the most important levels to break thru as we have seen some major fluctuation recently in these levels. It is possible we see T4 at 239 sats for a double top. I would highly recommend take profit and wait for a small correction by then.
Possible Entries: 190-195 sats


