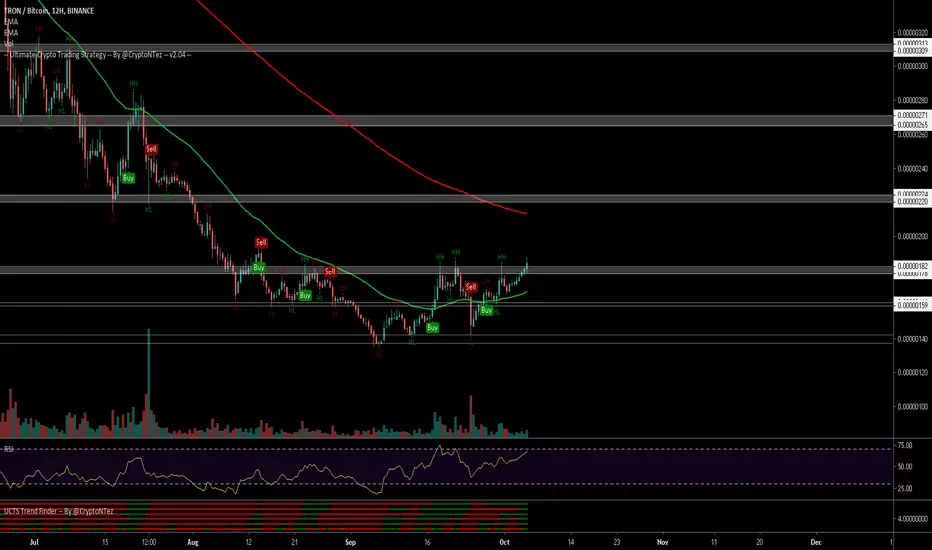
$TRX, Crossing above ~180sats resistance level, making a new HH$TRX
Crossing above ~180sats resistance level, making a new HH
If it manages to hodl/flip this level, then we may see new volume flowing in and pushing this asset to next target/resistance at ~220 sats (20%)
UCTS is signaling buy signals across many TFs
RSI at overbought
#TRX
TRXBTC
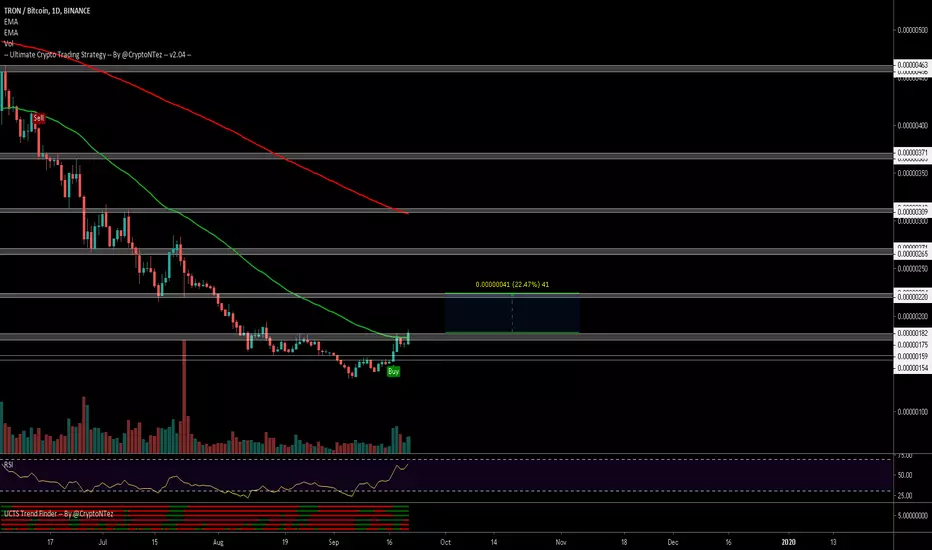
Long $TRX on retest of previous resistance after a breakoutPrice is above the 21EMA which it haven't been in a long time. 21EMA is about to cross the 55EMA to the upside, last time this happend TRX rallied over 100%.
Looking at the chart it kinda looks like we are forming a rounded bottom, and considering how a lot of alts have been moving lately i think there's a possibility this could be some kind of reversal.
A daily open & close above resistance zone (red box) while the 21EMA crosses the 55EMA to the upside would confirm bullish market structure.
SL is very tight with this setup, it could be lowered quite a bit and still maintain decent R/R. But if we close above resistance and bounce we shouldn't trade back below the 21EMA

TRON - Long Opportunity, Risind WedgeTron (TRXBTC) is making higher highs, resulting in a Rising Wedge formation.
The price broke the Resistance Line at 0.00000184. A close of the 4h candle above this level confirms further bullish movement.
Expecting to reach Target I 0.00000192 - 0.00000195 and Target II 0.00000199 - 0.00000203 soon.
Leave a thumbs up if you like my idea and let me know what you think!
This will keep me motivated :-)
Disclaimer:
Any opinions, chats, messages, news, research, analyses, prices, or other information contained in this Idea are provided as general market information for educational and entertainment purposes only

9R Trade on $TRX / $BTC- Break of falling trendline
- RSI after divergence trying to get bullish
- Previous peak after accumulation was 0.618 of previous rally.
- So targeting 0.618 again
- SL under recent lows


TRX/BTCDescending wedge: one of the most bullish patterns. Not sure when it will break out, but when it does, it will be so bullish that you will not be able to keep up with the price. Hopefully soon we will enter wave 3 (wave 3 will take us to a minimum of .36 cents.

Today`s ALT!!! TRXBTCBINANCE:TRXBTC
Exchange : Binance
Coin: TRXBTC
Buy Zone: 0.0000017 ~ 0.0000016
Target Point: 0.0000018/ 0.0000019/ 0.00000204/ 0.0000023
S/L: 0.0000016
Risk: MIDDLE - HIGH
Term: Middle - Long
It broke Symmetrical Triangle but there wasn`t Big pumping
Pink Line was made in April, so we can except Big pumping !!!
=====================================================================
Today`s ALT is that information is raised regardless of the Coin market situation
So sometimes there`s a high risk trading
Investment is your responsibility.
I'm just providing about coin`s information
=====================================================================

Tron divergenceI know that there was lot going on with Tron this year.
Even mr. Sun had few questionable moves which were not best received by Trons community.
All of that led Trx to fall to current prices.
We can't pretend that the tech behind Tron was superb and just 1 year later it's all gone. They have a good idea, Bittorrent was a really cleaver buy and their marketing strategy is just better than most.
Maybe way too centralized for the whole crypto concept, but they surely have their place in the future.
Said that, let see what chart analysis says about Trx:
We can see a huge RSI divergence developing for 5 months now.
I won't call it a bottom, but in my opinion the price shouldn't have gone below 300 sats in the first place.
This could be a great time to accumulate if you believe what Trx is and will be offering.

Today`s ALT!!! TRXBTCBINANCE:TRXBTC
Exchange : Binance
Coin: TRXBTC
Buy Zone: 0.00000169~0.00000171
Target Point: 0.0000018/ 0.0000019/ 0.00000204/ 0.0000023
S/L: 0.00000165
Risk: HIGH
Term: Middle-Short
It`s making Cup Handle
Pink Line was made in April
When it break Pink Line, it will start real - pump !!
=====================================================================
Investment is your responsibility.
I'm just providing about coin`s information
=====================================================================


$TRX, Trying to break from resistance level at ~180sats..$TRX
Trying to break from resistance level at ~180sats..
Volume has been increasing over the last days
UCTS Buy signal on the daily chart
RSI about to reach overbought (bullish) levels.
Crossing EMA50
If confirmed first target around ~200/220 sats (20% from here)
#TRX
TRX/BTC Binance 24% profit potential!if price break 25SMAA (1D) and stay above 177 (4H), can go to 220 easily.
SL is 160.

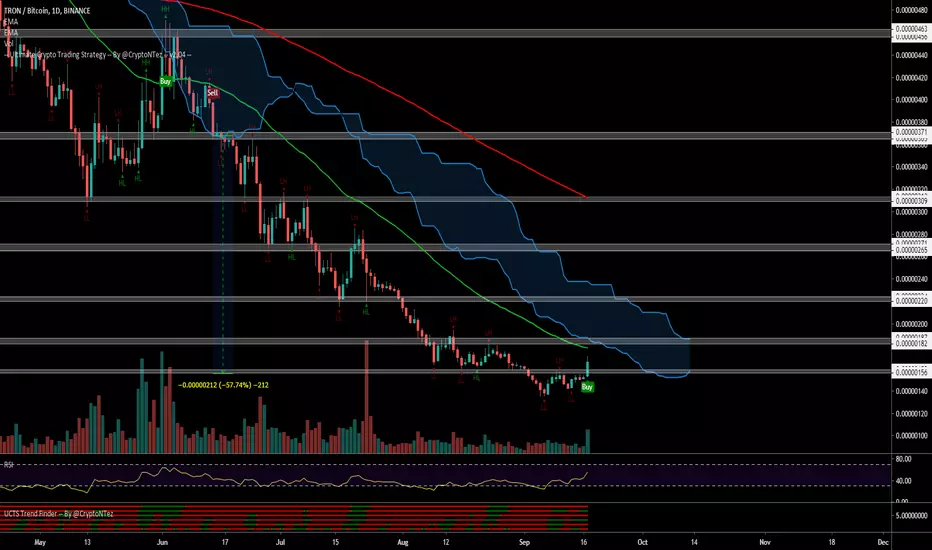
$TRX, Starting to show signals of life following the Alt markets$TRX
Starting to show signals of life following the Alt markets movements
Crossed above ~155 sats resistance level as volume is starting to rise (still low)
UCTS Buy signal on the 1D chart after several months of downside
~180sats as 1st target (matching EMA50)
#TRX
TRX inverse head & shoulder Very nice inverse head & shoulders pattern here, alts are looking to recover some from the long downtrend and TRX/BTC has broken the falling wedge (will post in updates)

tronbtc - vertical triangleBitcoin dominance falls
TRX the dollar looks more promising
Naturally in relation to the cue ball, too, growth.

TRX Heading towards new targets - 528% ROETrx has been making good moves.
There is still time to get into the move. As we have seen better uptrends done by BCH, ETH, XRP.
Now its time for TRX to do it.
Trx was bottomed out. The weekly chart is turning green.
1 D Chart is super bullish.
We have good volume, not the best but more will flow in.
Targets -
T1 - 195 / 95%
T2 - 224 / 216%
T3 - 300 / 528%
Leverage - 7X
Liquidity - 148
Stoploss - 162.

TRXUSD beartrend was in troubles for real. what to expect now? this is the analysis continuation of my previous TRXUSD set-up.
LET me know what is your plan right now
Cheers everybody

TRON - Accumulation Zone - Motors are startedTRX made a new low with bullish divergence and a bounce followed. I think that an impressive rally will follow f it manages to clear 195 sats. But like I've said, alts are in an accumulation zone. If you want this one, start nibble on it

Is it On in TRON?Usually, you don't touch an alt coin after a big rally. TRONBTC may be an exception.
We noticed that TRON is breaking above its 21-day moving average on its daily chart. That moving average has been a huge pivot for TRON during it's relentless bear market. Every time it reached that level, it was a sell. Rumors the coin had fundamental problems likely fueled selling.
This time looks a bit different as the burst above the 21-dma looks really good. The true test is whether TRON can break above a monster Fib resistance speed line near 167. TRXBTC has to be above that level to really confirm a bottom.
In the meantime, if you felt like going with the upside momentum, we wouldn't blame you.

TRX long term falling wedge bounced off supply zoneTRXBTC longterm falling wedge moved back into supply zone
stop loss 110sats
targes 450 sats (3x)
buyzone 150sats or lower
maybe some catalysts coming up, or just alt relief for confluence

TRON (Sept 17) #TRX $TRX #BTC $BTC #USDT $USDTBuy : 150-155 / 0.0155$
Sell : 165-180 / 0.0165-0.018$
Mid-Hold : 200-220 / 0.02-0.023$
Stop : 140 / 0.135$


Target - TRX - 16/9/2019Breck up 160 next tg: 168, 190, 208, 22x
Breck down 134, next tg: 86
------------
Folow - Only open position when breck
