UPDATE: TRON LONG OPPORTUNITY!! BUY NOW, PROFIT LATER!!TON recently LAUNCHED hitting Both our T1 and T2. The Target 3 was off by 1 SAT!
Now, heres where we are at.
Currently retracing back down from 230 sats, we are sitting at 211 sats.
This is a great re-entry for those who took profit, or those who want to accumulate more :)
TRX has room to grow on RSI & STOCH.
The Ichi cloud hasn't been broken and are sitting easily inside, with plenty to rise.
Buy the Rumor, Sell the News.
Entry: 210 sats
Target 1: 220 sats
Target 2: 231 sats
Target 3: 269 sats
WE DONT HIT STOP LOSSES, WE HIT TARGETS
LL <3 XSR
Trxlong

TRX HUGE LONG OPPORTUNITY!! BUY NOW, PROFIT LATER!!TRX has broken the falling wedge with a strong momentum.
Look for my major targets up to temporary resistance.
Short Term Trade, Will Update After Targets Hit.
Entry: 195-200 sats
Target 1: 209 sats
Target 2: 217 sats
Target 3: 231 sats
Target 4: 272 sats
FOLLOW ME, YOU WILL LEARN::
WE DONT HIT STOP LOSSES, WE HIT TARGETS !!
LL <3 XSR

TRXUSD LONG HOLDTRX/USD
ENTRY 1 .01500
ENTRY 2 .01400
ENTRY 3 .01300
Sl none
tp.1 .02000
tp.2 .02400
tp.3 .03500
tp.4 .05000
IM HOLDING TO .1000

TRON - Broke out of 2-Year Wedge, Bullish momentum comingLooking at Tron's daily chart, we can see that it has completed a 2-year descending wedge. So the overhead resistance which had prevented the price from moving higher is no longer there. I also like that the daily MACD is right at the zero-line. A break above this level is bull territory. The bullish signs are there. However, I'm not moving in just yet. I will be waiting for one of two things before buying:
1) Bitcoin to hit bottom - This usually gives the alts permission to move again. The alts are not dropping like they once did against Bitcoin, which suggests their bottom is close. However, even if TRX/BTC doesn't move at all on its Bitcoin chart, its USD chart will lose value. Waiting for BTC to bottom could allow you to buy TRX at a discount.
2) Buyer volume moves in and pushes the price up with force - We had a breakout of the wedge, but the price hasn't moved yet. We're lacking volume. I think once the volume comes, it will come with some force.
Keep Tron on your radar for good entry points. Getting in early as the alt season begins could be very lucrative.

TRON - $TRX - Are you ready for the next leg higher? We had a minor 5th wave so the expected retracement followed... Are you ready for the next leg higher?
Everything goes according plan. But the bulls have a lot of things to do... The trading Up 28% since my last update which, marked the absolute bottom.
Breakthrough that rising channel
Movering towards 223 sats
I believe that there is still more upside ahead! The potential on this one is huge!
We closed above (weekly chart) 170 satoshi! A great signal!
We here go
#TRXBTC #TRON $TRX #CRYPTO @justinsuntron

TRON (Sept 17) #TRX $TRX #BTC $BTC #USDT $USDTBuy : 150-155 / 0.0155$
Sell : 165-180 / 0.0165-0.018$
Mid-Hold : 200-220 / 0.02-0.023$
Stop : 140 / 0.135$

TRON TRX TRON TRX TRON TO THE MOONThe ultimate pump and dump coin. Get ready for this massive move to new ATH.
TARGET: S0.93

TRX Thoughts$TRX
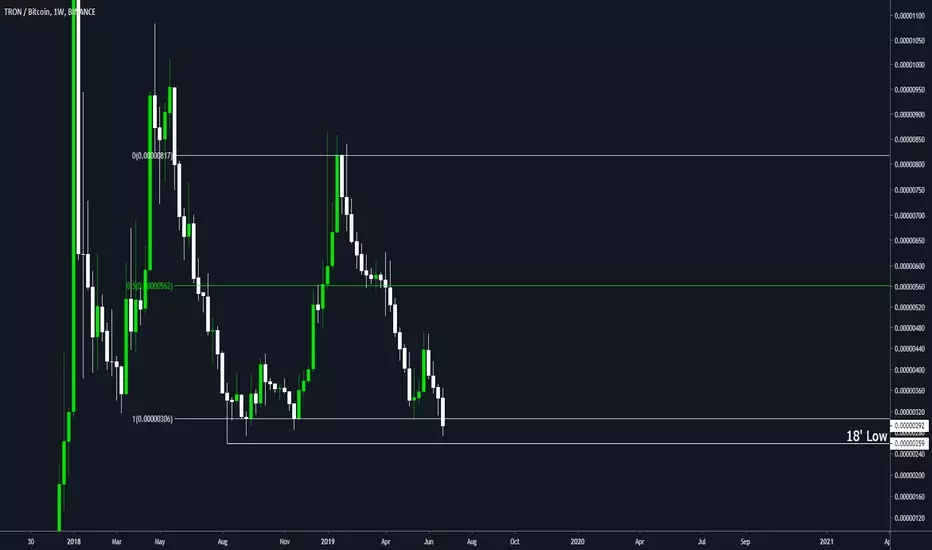
We haven't taken out the 18' low, and we're currently resting beneath the range low. I would personally be patient with this and sit on the sidelines until we get some closes back into the range.

TRX Scalp Trade ideaClear invalidation beneath the POC/recent HL, bullish divs on the 4H, exit at the first trouble area, lunch is on me.
R: 2.83

TRX LONG$TRX
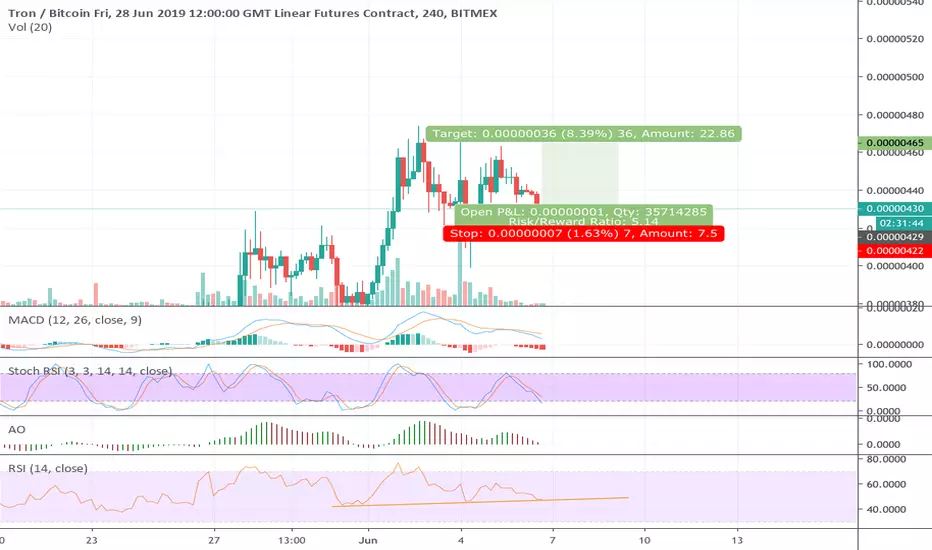
Looking great. I'd like to see S1 hold here on a retest, heading to R1, R2. Announcement is June 3rd, so keep your eyes on the prize.

TRX LONGTRX
Not too chabby at all, so far I'm liking what it's doing here. Once we get moving upwards, R1 and R2 will be two areas of resistance to look at.

TRX Long wasted on weekly chartDisclaimer:
***Any information represented here is my opinion only and not intended to be used for financial gain. None of the information posted here is to be considered financial advice. Information posted here is strictly for entertainment purposes only. Please consult your financial professional before making any kind of investment. Investments can be very risky and any investor should educate themselves before investing by enlisting the help of a licensed financial professional. Past results are not indicative of future results in any construable way.***

Tron (TRX/BTC)(Binance) Buy 0.00000437 BTC > 0.00000857 BTCTron (TRX/BTC)
Information:
Considering a purchase for 2 reasons. 1) The graph on the left will mark the point of support from which the price has rebounded and the candle has closed higher. This support may affect the price reversal. 2) On the chart, as you see, the channel was painted in blue and it also coincided with the zone where the throne is now. Two events suggest that a reversal may take place, but at the same time risks should be reduced and a short stop loss should be placed.
About stop loss:
Stop loss place at a minimum of candles.
------
Buy = 0.00000437
Take Profit = 0.00000857
Stop Loss = 0.00000415
------
Take Profit = +96.20%
Stop Loss = -5.12%
---------------------
Profit:Risk = 18.8 : 1

TRX LONG (BULLISH BUTTERFLY) TRX Bullish Butterfly Potential Reversal Zone.
Bullish Butterfly completion into a much bigger Bullish Gartley. This Bullish Butterfly will trigger the C leg of the Bullish Gartley.
Targets for C leg, time (first week of May) and stop loss identified for the Bullish Butterfly.
Right Shoulder (S) should be at the completion of the bigger Bullish Gartley.
Good trade and good luck everyone,
Zakaidze Omar

TRX Position RecommendationBINANCE:TRXUSD on the daily time frame has been on a long term trend line (Uptrend) from its initial days. Breaking its biggest down trend in its entire lifetime on 20 Dec 2018, It is getting close to the same lifetime uptrend after a long time.Also the chart signifies in the last 80 days people believe BINANCE:TRXUSD worth more than 0.022 Cents, making this region as a support zone. Being close to support zone & the uptrend line,the Stop Loss & the Targets make a good Risk/Reward Ratio (At least 3.77 for first TP). I believe these are sufficient reasons for a Chartist to take a position.
Stop Loss & the Targets are clear in the chart. please zoom for clarification. Aqua lines with numbers are important lifetime Fibonacci levels.
Remember Money management is one of the essential keys to success in Trading.
Good Luck ;) .

TRX/BTC - reversal time?TRX/BTC has been dropping for a while, could it finally be time for a turn around? Lets see.
Blue triangle indicates the current range.
Green box is buy.
Red box is sell.
Blue line indicates major resistance.
This is a log chart.

Huge short opportunity coming for #Trx#trx Based on Elliot wave count we are on wave B of correction. Not going long on $trx instead i/ll we looking for short opportunities in coming days. I am expecting a move to atleast 740 sats, before breaking down.
I will update my analysis as we get nearer to the conference which tron is doing. Make sure you're following me to get the notifications.
Leave a like if this helps. Comment below , are you bearish or bullish on Tron.
Read other analysis below. (Over 90% + accuracy so far)


Is this the bottom for TRX/TRON ?it's mainly for swing trading, i use the 3 day / 15 day / monthly charts with it and it works perfectly,
it works good for stocks and cryptocurrency.
you will use heiken ashi chart style and turn on the EMA DOTS indicator.
once the indicator is on you will hide the heiken ashi so you only see the dots.
when a green dot -0.53% -7.44% appears you buy, if a green dot -0.53% -7.44% appears after that green dot -0.53% -7.44% you hold your investment.
if a red dot appears you sell your position. easy as that.
the standard dots setting will be set to 10 - use this for any chart above 3 days
change the dots setting to 6 for 3day charts and below
shorter time frames will be choppy.
larger time frames will be smooth.
*Daytrading smaller timeframes is possible but not recommended.

Easy money. let it drop give me more red :) TRXBuy Green
Sell Red
//
it's mainly for swing trading, i use the 3 day / 15 day / monthly charts with it and it works perfectly,
//
it works good for stocks and cryptocurrency.
//
you will use heiken ashi chart style and turn on the EMA DOTS indicator.
once the indicator is on you will hide the heiken ashi so you only see the dots.
//
when a green dot -8.89% appears you buy, if a green dot -8.89% appears after that green dot -8.89% you hold your investment.
if a red dot appears you sell your position. easy as that.
//
the standard dots setting will be set to 10 - use this for any chart above 3 days
change the dots setting to 6 for 3day charts and below
//
shorter time frames will be choppy.
//
larger time frames will be smooth.
//
*Daytrading smaller timeframes is possible but not recommended.
