TRX Tron the Next LUNA ? Justin Sun is the CEO of TRX, Tron, the 15th biggest cryptocurrency, with a market cap of $4.74 Billion.
Justin Sun`s TRX also controls a stablecoin, USDD, that keeps on depegging from the dollar recently.
He has also a controlling stake in Singapore-based Huobi, the fourth largest digital asset exchange.
Yesterday the amount of withdrawals from Huobi were significant, $60 Million.
There are Insolvency Rumors for Huobi.
I think TRX will ultimately reach its pandemic low of $0.0072.
Looking forward to read your opinion about it.
Tron

TRX: Showing strange trendTRX is showing since short term a strange pattern, for this reason, we will follow this coin to see if it can confirm the breakdown trend.
There is a cash-out trend on TRX, the question is to see if there is a whale trend following the same pattern.
Until now it's interesting to follow to see last trends on TRX.
A long at this moment on TRX can be risky since it's important to confirm the trend first.

TRXUSD- Short Position- DYORHere is a technical analysis considering all the drama going on with Justin Sun and Huobi Crypto Exchange. Tron plunged more than 8% today, USDD Depegs and also, Huobi Crypto Exchange has said it will lay off hundreds of staff in coming weeks. Justin Sun is one of their advisors.
DYOR before trading based on this chart. Not liable for any of your personal loses due to this analysis.

TRXUSD is ready. Are you ready for this? 50 % dump (NEW)TRXUSD looks ready. The price has been in the descending triangle for a long time. Now it looks like it's ready for a breakout.
Taking into an account very bearish sentiment in the whole crypto market, we expect that it will break down.
Targets are shown on the chart.
We don't expect it to go to zero therefore targets are defined based on the historial key supports instead of traditional methodology applicable to trading descending triangle pattern.
Expect more FUD in crypto market which could be a trigger for a triangle to breakdown.
good luck

TRXUSD ❕ above the liquidityThe Tron is trading above the range.
Price has fixed above 50EMA and 200EMA (4H TF).
I expect price to rise after fixing above the range.

TRX - Range trend but positive momentumDuring the past weeks, TRX had a range trend but positive momentum. The price of Tron entered a correction after the bearish wave, which was able to stay at the support level of $0.053-$0.054 by breaking the downtrend line drawn in the previous analysis. Again, a positive reaction has been observed at this level, which indicates the attempt of buyers to grow the price to the resistance of $0.057 to $0.059. In general, the major resistance in daily time is considered in the range of $0.070. But in the 4-hour period, if the $0.059 resistance is broken, we can expect further growth and an upward trend. So, in general, for this week, the resistances of $0.059 and $0.062 can be short-term targets for buyers. You can also consider a narrow ascending channel for the price in the 4-hour timeframe. As long as the bottom of the channel is maintained in the orange range, we expect the price to grow.

The 0.05358 point is stronger than any pointHello?
Traders, welcome.
If you "Follow", you can always get new information quickly.
Please also click "Boost".
Have a good day.
-------------------------------------
(TRXBTC 1W Chart)
It has risen in the section where the power of the rise is gained.
In order to release this force, we need to see if the price can sustain above 0.0000 0318.
-----------------------------------------
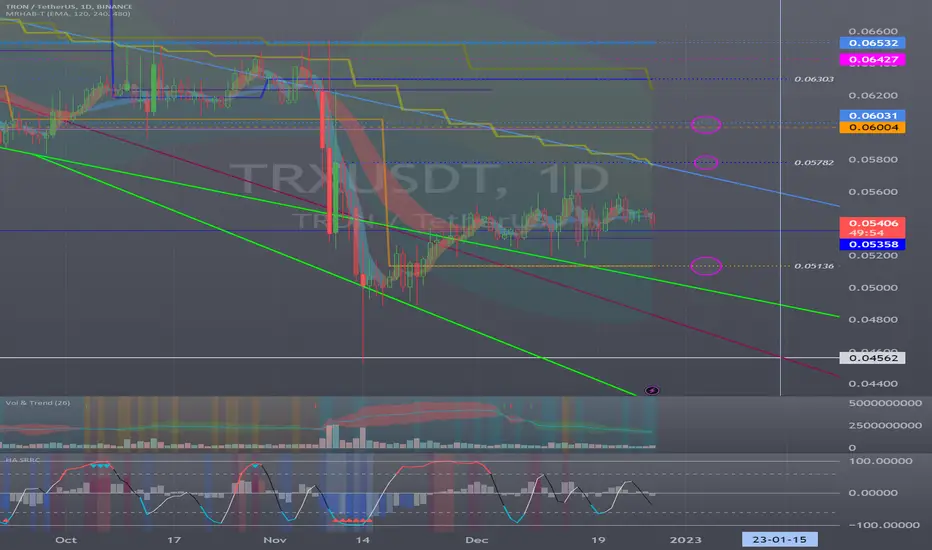
(TRXUSDT 1W chart)
The key is whether it can get support around 0.05358 and rise above 0.06004.
If not, a fall below 0.04562 is highly likely and you should think about how to counteract that.
(1D chart)
TRX is linked to USDD, a stablecoin.
Therefore, a drop in the price of TRX is likely to have a profound impact on the shape of TRX.
So, I think keeping the price above 0.05358 is of utmost importance.
Therefore, you have to work hard to ensure that USDD is pegged to $1.
Those who believe in TRX and continue their mid- to long-term investments should take advantage of this and take a trading method that increases the number of coins corresponding to profits while recovering the principal amount purchased.
The next volatility period is around January 15th.
-------------------------------------------------- -------------------------------------------
** All descriptions are for reference only and do not guarantee profit or loss in investment.
** If you share this chart, you can use the indicators normally.
** The MRHAB-T indicator includes indicators that indicate points of support and resistance.
** SR_R_C indicators are displayed as StochRSI (line), RSI (columns), and CCI (bgcolor).
** The CCI indicator is displayed in the overbought section (CCI > +100) and oversold section (CCI < -100).
(Short-term Stop Loss can be said to be a point where profit or loss can be preserved or additional entry can be made by split trading. This is a short-term investment perspective.)
---------------------------------
TRXUSD ❕ tests the rangeTrading volumes are low, but TRX is still moving above liquidity.
I believe that the asset may go lower to collect liquidity after a fixation in the range.

trx viewpoin shortHi, dear traders. how are you ? Today we have a viewpoint to SELL/SHORT the trx symbol.
For risk management, please don't forget stop loss and capital management
When we reach the first target, save some profit and then change the stop to entry
Comment if you have any questions
Thank You

Good opportunity on TrxusdtWe can see that it’s on 270 degree for gann cycles so it’s good area to get reflected at least 35% so try to not miss this one in this hard market

TRXusdt 3D important support zone Well in the chart we see the triangle pattern that is an important support range and with the complaint of this area, otherwise the line fails; The upward trend is formed.
Its not Buy or Sell SIGNAL
DYOR
BY : M.TeriZ - @AtonicShark

Trx set to make quick recovery from break to the downside.Back in October 20th I mentioned Tron had a chance to breakout to the downside and if so it will make a quick recovery back to the upside. So far we've had this temporary setback as foretold, and therefore we expect a quick recovery from here on. So far looking promising 👌 😀

Trading opportunity in TRXUSDTBased on technical factors there is a Sell position in :
📊 TRXUSDT Tron
🔴 Sell Now 0.05451
🧯 Stop loss 0.05605
🏹 Target 1 0.05285
🏹 Target 2 0.05065
🏹 Target 3 0.04715
💸RISK : 1%
We hope it is profitable for you ❤️
Please support our activity with your likes👍 and comments📝

Tron TRX price at the start of a strong trend moveTRXUSDT price has been demonstrating one of the longest consolidations since April 2021, 20 months.
You understand that in consolidation: those who believe in growth are always buying at different levels, and those who believe in depreciation TRX are actively selling their portfolio.
So when the TRXUSD price breaks out of this consolidation, there will be a strong and prolonged price movement in one direction.
The ambitious goals of longs are growth to $0.09, and if they are lucky, to $0.13
Benchmarks for shorts - falling to $0.035, and if lucky, to $0.0175
Which scenario Tron price move is closer to your heart? Whose side are you on?
_____________________
Did you like our analysis? Leave a comment, like, and follow to get more

TRX ANALYSIS#TRX UPDATE.
#TRX is currently trading in a rising channel with blue box area as the resistance ,since trx got rejection from the blue box area we do expect that trx will have a pullback on losing either support level i.e. orange and the pink line support.Keep eyes guys.

TRXUSD - Oversold - Small bounceOn the chart, we can see TRXUSD is currently oversold.
This oversold condition is suggesting that the price will bounce up. This is a short-term setup and the profits could be taken at the target. The three indicators used are Bollinger Bands , RSI and Stochastic .
See all further details on the chart.
Goodluck!


TRXUSD ❕ under liquidityTron is trading under the liquidity zone.
Trading volumes are up on the price drop.
50EMA broke down 200EMA (1H TF).
I expect the TRX to continue to test the lower boundary of the liquidity zone, but will continue to decline after it fixes below it.

TRON, which is expected to promote new business in 2023...Hello?
Traders, welcome.
If you "Follow", you can always get new information quickly.
Please also click "Boost".
Have a good day.
-------------------------------------
(TRXBTC 1W Chart)
A rise above 0.0000 0318 is expected to release bullish strength.
---------------------------------------
(TRXUSDT 1W chart)
The key is whether the price can stay above 0.05358 to break out of the long-term downtrend channel.
And, ultimately, whether it can rise above 0.06236 is important.
(1D chart)
The key is whether it can rise with support in the 0.05136-0.05358 range.
If not, a decline to around 0.04437 is likely.
Since TRX is issued as a stable coin, a drop in the price of TRX can create a great risk.
(USDDUSDT 1D chart)
Therefore, holders of TRX need to pay attention to USDD's pegging situation.
We are currently airdropping APENFT (NFT) tokens until 2023 to promote new businesses.
Attention is focusing on whether the victory or defeat of the business to be carried out this time can change the fate of TRX.
-------------------------------------------------- -------------------------------------------
** All descriptions are for reference only and do not guarantee profit or loss in investment.
** If you share this chart, you can use the indicators normally.
** The MRHAB-T indicator includes indicators that indicate points of support and resistance.
** HA SRRC indicators are displayed as StochRSI (line), RSI (columns), and CCI (bgcolor).
** The CCI indicator is displayed in the overbought section (CCI > +100) and oversold section (CCI < -100).
(Short-term Stop Loss can be said to be a point where profit or loss can be preserved or additional entry can be made by split trading. This is a short-term investment perspective.)
---------------------------------

TRXUSD ❕ lower boundary of a channelRSI chart is moving in the sellers area (4H, 1H and 30m TFs)
Asset successfully tested 50EMA as resistance (4H TFs)
I expect a continuation of the decline after the correction and price holding in the channel.

Tron TRX Price Targets for DecemberLitecoin LTC is bearish ahead of the release of new economic data on December 13, the Consumer Price Index:
TRX/USDT short
Entry Range: $0.053 - 0.055
Price Target 1: $0.049
Price Target 2: $0.045
Price Target 3: $0.040
Stop Loss: $0.061

TRXUSD ❕ above the liquidityTrading volumes indicate a lack of interest in falling prices.
Tron is trading above liquidity.
Price successfully tested 50EMA as bearing support (4H TF).
I expect a rise if TRX successfully fixes above the current support level.

TRON (TRX) - November 24Hello?
Traders, welcome.
If you "Follow", you can always get new information quickly.
Please also click "Boost".
Have a good day.
-------------------------------------
(TRXBTC 1W Chart)
The range of 0.0000 0259 to 0.0000 0311 is the boundary between rising and falling.
Therefore, if the price stays above 0.0000 0311, it is likely to release upward force.
-----------------------------------------
(TRXUSDT 1W chart)
The key question is whether it can move above 0.06236 to break out of the long-term downtrend channel.
(1D chart)
The 0.03538-0.04437 interval determines the trend.
Therefore, if it falls, it must rise with support in the 0.03538-0.04437 range.
To turn into an uptrend, the price needs to hold at least 0.05358 higher.
At the same time, as a whole, the price should make a move to break out of the downtrend channel.
Accordingly, the key is whether the price is maintained by rising more than 0.05358 due to the volatility around December 1st.
-------------------------------------------------- -------------------------------------------
** All descriptions are for reference only and do not guarantee profit or loss in investment.
** If you share this chart, you can use the indicators normally.
** The MRHAB-T indicator includes indicators that indicate points of support and resistance.
** SR_R_C indicators are displayed as StochRSI (line), RSI (columns), and CCI (bgcolor).
** The CCI indicator is displayed in the overbought section (CCI > +100) and oversold section (CCI < -100).
(Short-term Stop Loss can be said to be a point where profit or loss can be preserved or additional entry can be made by split trading. This is a short-term investment perspective.)
---------------------------------
