Tron

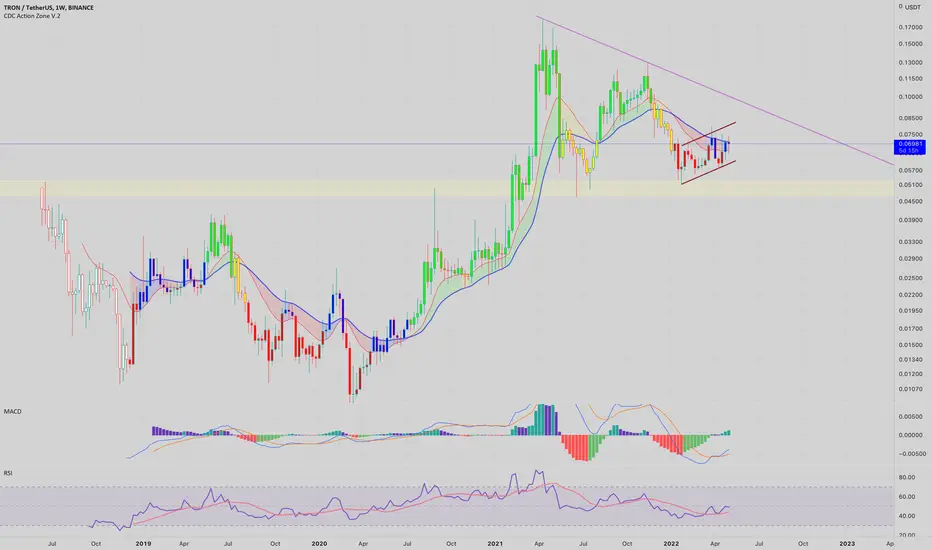
TRXUSD Strong short-term but long-term needs moreTron (TRXUSD) has showed incredible strength short-term since May 01 up until today. Even though it broke above the 1D MA200 (orange trend-line) yesterday for the first time since December 17 2021, the coin remains within a long-term Triangle pattern since the April 21 2021 High.
As a result it is still best to trade the Triangle (buy low - sell high) for as long as the 1W MA100 (red trend-line) supports and the Lower Highs (top) trend-line of the Triangle resists. In order for the market sentiment to turn bullish again on the long-term, we believe that a break above the 0.786 Fibonacci retracement level is needed (which contained the previous Lower High). In that case we expected a new rally towards the 1.382 Fib (matched the April 2021 High) and the 1.618 Fib in extension around 0.2200 - 0.2300.
Note that the 1D CCI has been within a Channel Up since the last Triangle Higher Low. Adds to the bullish break-out case.
--------------------------------------------------------------------------------------------------------
Please like, subscribe and share your ideas and charts with the community!
--------------------------------------------------------------------------------------------------------

TRX in coming days!TRX is in a CRAB Pattern. This Means The Price Still has room For Being Bullish.Ex Ret is 1.618 So It Is Safe To Say The Price can reach 0.085$.
_ _ _ _ _ _ _ _ _ _ _ _ _ _ _ _ _ _ _ _ _ _ _ _ _ _ _ _ _ _ _ _ _
Thank you for seeing idea .
Have a nice day and Good luck

TRXUSD ❕ false breakout?The Tron moved strongly upwards out of the uptrend channel, and then hit the resistance level. On increased trading volumes, the price went down after the doji candlestick was formed. I expect a quick correction after fixing under of upper boundary.

TRX TRON BUY WHEN BREAKOUT ConfirmedSignal: Red -> Green accumulates
Buy when the breakout is confirmed
TRX, TRON, TRXUSD , TRXUSDT , TRXUSDTP, CRYPTO,CRYPTOCURRENCY
DISCLAIMER
This is only a personal opinion and does NOT serve as investing NOR trading advice.
Please make your own decisions and be responsible for your own investing and trading Activities.

Trading opportunity on TRXUSDTBased on technical factors there is a short position in :
📊 TRXUSDT Tron
🔴 Short Now 0.07055
🧯 Stop loss 0.07610
🏹 Target 1 0.06650
🏹 Target 2 0.06160
🏹 Target 3 0.05310
💸Capital : 1%
We hope it is profitable for you ❤️
Please support our activity with your likes👍 and comments📝

TRXI think the next downtrend has begun
This is my personal opinion. Please do not trade based on my analysis and data.

TRON : WATCHLIST for scalping longFrom most ALT coins i overlook today,
TRX look positive on 4H CDC indicator.
When looking at weekly view, It already tested major support twice
as above chart
and on daily TF is moving along this channel
So in case of BTC is moving up, this one will be good choice for scalping LONG
................
1. The analysis is for scalping /day trade methods only , not for coin holders/investors /long term If you follow it please set SL at ur acceptable risk
2. Tradingview won't let me update the analysis status via phone-- but i try to log in PC 1 time a day
TRX Tron short Price Targets and Stop LossTRX/USDT short
Entry Range: $0.061 - 0.064
Price Target 1: $0.060
Price Target 2: $0.055
Price Target 3: $0.049
Stop Loss: $0.071

TRXUSD ❕ volume growth50MA and 100MA formed a golden cross at 1H Timeframe.
Price is above the liquidity level.
I expect retest and fixation above the support level with further reaching the resistance level.

TRON (TRX) - April 28hello?
Traders, welcome.
By "following", you can always get new information quickly.
Please also click "Like".
Have a nice day.
-------------------------------------
(TRXUSDT 1W Chart)
Primary resistance: around 0.08631
Secondary resistance: 0.11228-0.12526
Support: 0.04736-0.06034
(1D chart)
(buy)
- After confirming the support at 0.06427
(Stop Loss)
- When the resistance falls below 0.06034
(Sell)
- When resistance is received in the range of 0.07070-0.07322
- When resistance near 0.08631
The section 0.07070-0.07322 is the section where the downtrend line passes, so there is a high probability of a whipsaw.
Therefore, an appropriate response is required.
If it rises above the 0.08233-0.08631 section, it is expected to surge.
------------------------------------------------------------ -----------------------------------------------------
** All indicators are lagging indicators.
Therefore, it is important to be aware that the indicator will move accordingly as price and volume move.
However, for the sake of convenience, we are talking in reverse for the interpretation of the indicator.
** The MRHAB-T indicator used in the chart is an indicator of our channel that has not been released yet.
** The OBV indicator was re-created by applying a formula to the DepthHouse Trading indicator, an indicator disclosed by oh92. (Thanks for this.)
** Support or resistance is based on the closing price of the 1D chart.
** All descriptions are for reference only and do not guarantee a profit or loss in investment.
(Short-term Stop Loss can be said to be a point where profit and loss can be preserved or additional entry can be made through split trading. It is a short-term investment perspective.)
---------------------------------

TRX/USDT Linienchart. Trendlinie. Dreieck.Rising trend. The chart is linear to remove "market noise" and show a clear trend direction and a triangular formation.
Coin on the coin market: TRON(TRX)
This triangle is on a candlestick chart

Is TRX a good investment ahead of the USDD's debut?On Thursday, the price of TRX skyrocketed when Justin Sun announced plans for a new stablecoin. TRX hit a high of $0.074, the highest since April 4th. However, following Jerome Powell’s hawkish remarks, these gains were short-lived.
Bullish Scenario: TRX may retrace back to $0.06 support levels. If TRX manages to break over the resistance level at $0.074 after retracements, it will be mildly bullish. With sufficient buying activity, breaking above the $0.08 price barrier will lead to a rise towards $0.10 and higher.
Bearish Scenario: TRX has been in a decline for several months, thus we don’t have a strong bullish bias for the medium term. If the support level of $0.06 does not hold, the price will sooner or later fall below $0.05, $0.03, and much lower.

TRX/USDT ANALYSISTRX took a strong bounce after it broke and retest the major support level. Price made a high of $0.075 which is 19% profit from the entry. I hope you booked some profit with the increasing market price.

TRXUSDT 1D When the Tron price correction ends ?Today we will consider a pair of TRXUSDT on the global chart.
From March 2020 to April 2021 there was a strong and confident growth, which can be marked by the first wave of growth.
From April 2021 to the present, the second wave of correction continues, which in our opinion may have 3 options for completion, which will be discussed below:
1. The correction at the final stage and yesterday's aggressive buyout of buyers shows that they are set to start a wave of growth, even despite the correction in the price of BTCUSDT
In this case, $0.06 per TRX is a critical level below which the price can not fall.
2. This option is to fix the price of TRXUSD below $0.06 and start the final wave down. The upper limit of the liquidity zone can be attracted the fall to level $0.035
3. This is the most pessimistic option and a strong fall on the crypto market. In this case, it will be possible to focus on the lower limit of the liquidity zone - the level of $0.024 for Tron
We are trading probabilities and do not know which option will work exactly. However, the painted and painted action plan is already half the work, now the main thing is to orientate in time and make the right trade decision in the future.
_______________________________
Since 2016, we have been analyzing and trading the cryptocurrency market.
We transform our knowledge, trading moods and experience into ideas. Each "like under the idea" boosts the level of our happiness by 0.05%. If we help you to be calmer and richer — help us to be happier :)

TRX races high, aiming for $0.074 next as bulls show momentumThe TRON price analysis indicates a strong bullish trend, as a sharp increase in price has been detected today. The most recent update shows that the cryptocurrency is going in favor of the buyers as they have taken over the market. The past few hours have observed a continuous aggressive bullish price movement, due to which the price has reached the $0.073 level and is on course to go above the current resistance at $0.074.
TRX/USD 1-day price chart: Bulls mark 16 percent gains as price surges to $0.073
The 1-day price chart for Tron price analysis is going in a bullish direction for the day, as the price has jumped higher than expected. There has been a massive rise in the coin value, and the price levels are going high every hour, which has resulted in the price reaching $0.073 of value. The coin has gained a handsome 16.4 percent value overnight. The moving average (MA) has also taken a sharp upwards turn and will soon cross over SMA 50 curve, which is a further bullish indication.

TRON TRX Price Targets and Stop LossTRX/USDT
Entry Range: $0.061 - 0.064
Price Target 1: $0.067
Price Target 2: $0.072
Price Target 3: $0.082
Stop Loss: $0.057

Tron will be the biggest mover$1.5 Tron will come soon, believe in Justin and Tron, The pace he is going with he can be the next richest man.

trx looking goodtrx is looking good to accumulate down at these levels
could see a big move soon if we can break the down trend

#trx/usd longElliott Wave Count for Theron BINANCE:BTCUSDT
It is suggested that this crypto currency be examined

TRXUSDTThe falling wedge has formed. It is better to work from breaking through. Good targets. After the take, I expect further movement to 1.618


TRXUSD ❕ end of correctionAfter the correction, the TRX reached the support level and the lower boundary of the uptrend. Volumes have declined. I expect a retest of the lower boundary of the uptrend channel with fixing above it and after reaching the resistance level.
