TRX is more confused than everA look at TRX daily chart shows that the long-term and medium-term trends are bullish.But the short-term trend is very confusing , The price candle on September 22, for example, was very promising, but the trading volume was small , As a result, buyers were unable to offset their losses on September 23 and a Dodge candle was formed.Today the situation has become more complicated and after the formation of the Dodge candle, now the price changes with emotions.I think the downtrend is more likely Because with a simple look at the chart, it can be seen that the power of descending candlesticks is more than ascending candlesticks.In the short term, the most important support is 0.085 and the most important resistance is 0.12.
This is not a financial recommendation.
This is just a technical analysis.
Tron

I starting to re-gain position on the TRXI starting to re-gain position on TRXUSDT. I'm starting to re-gain position on the Throne. Bought 20% of the position. I am looking for the mirrored level-zone 0.09-0.104 on the weekly timeframe. I think that it will be fixed at this level. If the price goes against, I will average 40% of the position in the 0.082-0.076 zone. The minimum from the squeeze on September 7th. I do not put a stop yet.

A great potential on TRXUSDT to fall!As it is noticeable, if the price hit the orange channel which is shown in the chart, it may fall into the down-line of the channel.
So, if we see a great bearish candle we could open a sell order!

A great potential on TRXUSDT to fall!As it is noticeable, if the price hit the orange channel which is shown in the chart, it may fall into the down-line of the channel.
So, if we see a great bearish candle we could open a sell order!

TRXUSD D1: XABCD 150% gains BEST LEVEL TO BUY(SL/TP)(NEW)Why get subbed to me on Tradingview?
-TOP author on TradingView
-2000+ ideas published
-15+ years experience in markets
-Professional chart break downs
-Supply/Demand Zones
-TD9 counts / combo review
-Key S/R levels
-No junk on my charts
-Frequent updates
-Covering FX/crypto/US stocks
-before/after analysis
-24/7 uptime so constant updates
🎁Please hit the like button and
🎁Leave a comment to support our team!
TRXUSD D1: XABCD 150% gains BEST LEVEL TO BUY(SL/TP)(NEW)
IMPORTANT NOTE: speculative setup. do your own
due dill. use STOP LOSS. don't overleverage.
🔸 Summary and potential trade setup
::: ALGOUSD 2days/candle chart review
::: XABCD setup in progress
::: currently ACCUMULATION MODE
::: point C is near 27cents
::: BUY/ACCUMULATE near market
::: strong bullish chart
::: up to 150% gains possible later
::: short-term pullback possible
::: bulls wait for pullback
::: SPECULATIVE SETUP
::: do your own due dill
::: and use proper risk management
::: TP bulls is +150% gains
::: details: see chart
::: FINAL TP is 16/17 cents
::: recommended strategy: BUY/HOLD after correction
::: best entry near 0.06
::: TP BULLS +150% gains
::: SWING TRADE: BUY/HOLD IT
::: bull run not over yet
::: good luck traders!
::: BUY/HOLD and get paid. period.
🔸 Supply/Demand Zones
::: N/A
::: N/A
🔸 Other noteworthy technicals/fundies
::: TD9 /Combo update: N/A
::: Sentiment mid-term: BULLS/FINAL PUMP
::: Sentiment short-term: BEARS/CORRECTION
RISK DISCLAIMER:
Trading Crypto, Futures , Forex, CFDs and Stocks involves a risk of loss.
Please consider carefully if such trading is appropriate for you.
Past performance is not indicative of future results.
Always limit your leverage and use tight stop loss.

TRON - Overlook ✅TRON has two main supports on the way down: one local for short term and one key support for long term which is the area we've consolidated on for a while.
I said on the way down because TRX also is going through corrections, just like the whole market, and we're not sure when it'll stop since there are strong sell volumes on the market.
Not a good time for opening long positions at all, not safe at all.
Use this chart as your trade setup for now.
Current Market Price: $0.09321
Good Luck
Tell me your ideas. Like and Share

trxusdThe TRX currency is used to power programs running on the Tron network. One of the most sought-after uses for this type of tech is to create social platforms that reward users directly for content creation and curation

TRXUSDT | Short/Sell !My argument:
1. Wave 5 is over, Corrective started
2. RSI Divergence
3. Hit the resistance trendline

TRX_USDT good time for LONG position everything is ready for TRX to grow.
up to 15% profit
whats your idea?
comment here🔽🔽🔽


TRX/USD - Path to $0.20 🚀TRON macro view looks bullish as the trend is clearly up (higher lows).
If we count the waves, we seem to have completed all waves apart from the last fifth wave up. Once that is done, we may have a longer cool-off.
Price appears to be around half-way towards the top on this last wave. It's hard to guess the top, but I'd bet anywhere around $0.20 is a good place to secure profit. Some possible resistance levels are on the chart.
I don't exclude another re-test of support which would present a good buy opportunity before the last pump up. Then we need to re-assess the chart.
On weekly timeframe, indicators are bullish but I don't like the lacking volume. Hence, why on daily it does look like tron wants to re-test our support before we push higher again. So best to buy then if you are interested in longing Tron. If this plays through, you can double your entry, not bad.
Like and follow if you liked this idea!

TRON at a 13% Discount - Potential Entries Before Next Leg UpA quick post that I thought was worth mentioning. Tron reset the RSI correcting ~13% since last night. When I saw that it was sitting on a confluence of support level from several different trends, I couldn't control myself and bought some more TRX at this 222 sat level. Bitcoin just had a little shakeout to $46750, but maintained it's bull flag. If it can show some strength and have a solid breakout beyond $48,000, I think we can expect a bullish continuation from TRX. The price could really fly if it breaks out against BTC.

TRXUSDT long-termTRXUSDT long-term
Buy now OR Buy on Support area
Support area 0.083 ~ 0.096
SL 0.075
TP 0.152
TP 0.220
TP 0.318
TP 0.550
TP 1.04
Researcher Strategy v2
@IR_Researcher

TRX will see high prices when it breaks out!Here's a quick look at TRX 2 days chart. As we can see, the price has been going sideways and has printed a big symmetrical triangle. The price will probably revisit previous ATH when it breaks out. Definitely one to keep an eye on.
The best entry would be, when the price breaks above the symmetrical triangle with good amount of volume .
-------------------------------------------
The idea is: Buy the breakout from the symmetrical triangle and take profits at the levels shown in the chart.
Targets:
- Profits can be taken in the resistance zone .
1. 0.14$
2. 0.148$
3. 0.18$
-------------------------------------------
If you like the content, then make sure to comment and like the post :D
Follow me for daily profitable trading setups
BTC dictates the market. If BTC falls, then Alts will fall as well. Trade safe!

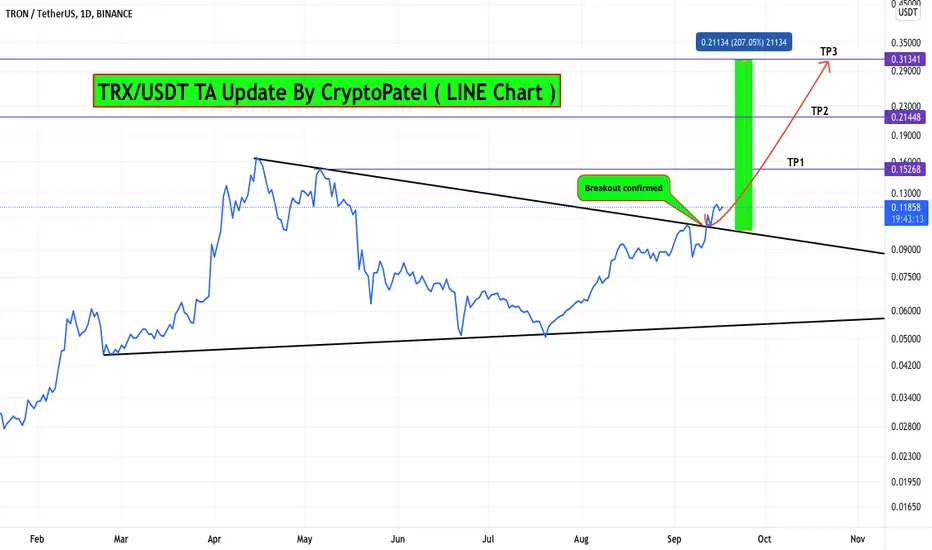
TRON Ready for another 200% move from here..?#TRX/USDT TA Update:-
$TRON currently trading at $0.119
Which is 18% up from our lower entry.
In the LINE chart also breakout and Retest also confirmed.
Now Waiting for Big move from here.
Stop Loss same at :- $0.09
Targets:- $0.152/$0.214/$0.313
If break $0.152 then we can see new All time high.
Support:- $0.1
Resistance:- $0.152
₿ TRXUSDT 1D ₿ : 16.Sep.2021 (Update)Still Powerful ... BINANCE:TRXUSDT
⚠️ This Analysis will be updated ...
👤 Arman Shaban : @Ar_M_An_4
📅 16.Sep.2021
⚠️(DYOR)

TRXUSD formed a 1D Golden Cross and aims at $0.30The Fibonacci Channel since the COVID market bottom fits perfectly on Tron. The latest key technical formation is the Golden Cross (MA50 crossing above the MA200) on the 1D chart. Last time we saw this pattern was in June 07/08 2020. That draws inevitable comparisons with that fractal.
See the similarities of then and now:
* The Golden Cross was formed after the price broke above the Lower Highs trend-line
* The Golden Cross was formed after the price broke above the 0.618 Fibonacci retracement level
* Since the bottom, the price has been trading within the 0.5 and 1.0 Fibonacci levels of the Channel (blue Channel)
* The LMACD on both is identical
What happened after the Golden Cross in 2020 was a sustainable 2 month rise within the 0.5 and 1.0 Fibonacci levels of the Channel supported by the 1D MA50 (blue trend-line) and then when the Resistance (previous High) broke, an aggressive rally followed just below the 1.5 Fib extension from the bottom and the 2.0 Fib extension of the Channel. Currently that's a little over $0.30 and that's what we are targeting on TRXUSD.
** Please support this idea with your likes and comments, it is the best way to keep it relevant and support me. **
--------------------------------------------------------------------------------------------------------
!! Donations via TradingView coins also help me a great deal at posting more free trading content and signals here !!
🎉 👍 Shout-out to TradingShot's 💰 top TradingView Coin donor 💰 this week ==> Vergnes
--------------------------------------------------------------------------------------------------------

Tron TRXUSD - Ascending channel + Elliott Wave- On the chart we can see an incomplete Impulse Elliott Wawe (5th wave).
- Rounding bottom or cup and handle is also printing on the chart.
- Volume is very bullish and also RSI is prepared for another pump!
- Target is 1:1 fib trend-based extension + top of the ascending channel + 5th elliott wave
- For expected duration of the trade, probability, stop loss, profit target, entry price and risk to reward ratio ( RRR ) - please check my signature below ↓
- Huge bullish volume is also one of the positive signs!
- If you want to see more of these ideas, hit "Like" & "Follow"!


TRX 12h How much more to grow The last time we did a global idea for TRXUSDT was in May of this year, less than two weeks before crypto prices started to collapse (ohhh, then we read a lot of hate .... "what are you writing, this growth can't be stopped, etc." but :)
Since then, the price of TRXUSD has managed to fall by -65%:
The TRXUSD price has been rising almost uncorrected for the past two months and has almost worked off all of its losses.
The TRXUSDT price has been trading in a 20% corridor of $0.10-0.12 for the last few days and most likely, buyers are preparing for another upward momentum.
To confirm their strength, buyers should at least keep the TRX price upper $0.10 for the next few days and at most hold above $0.12.
We assume that the growth retardation can start in the range of $0.13-0.144 , in this zone fully compensates for the May fall. Deceleration in this area may be provoked by the fact that traders, who had been in a drawdown for 5 months, will want to fix position at break-even and forget about this negative experience.
If the area of $0.130-0.144 will not have critically large trading volumes, it will be a signal that the sell-off time has not come yet , and the growth itself may continue at low volumes, as it has been doing for the last months.
Targets for a move higher are shown on the chart — $0.155 and $0.169
_____________________
Do you like the idea fulfilment? Does it help you trade and make a profit?
Do you want more forecasts from us?
Give us motivation! (Like, comment and donate). These little things won't make us rich, but they will warm the trader's soul while writing the next idea!


TRXUSDT Mid-term AnalysisHello guys
According to this chart
We had finish a rally a few weeks ago and until 3-4 weeks ago we are in downtrend until the important zone that we shown on chart support the price
After the second zone that shown in pink color we can say up trend is beginning and we are in floor price upward trend
until the pink zone is not break down with powerful candle and close it below them the up trend is valid
you can buy and take long position in buy zone and then put stop loss where we are putting it then put TP and watch
we think this year with this bullish market TRX can touch target over a dollar ( 1$ )
but this is just prediction , the market should move and then we update our analysis and predict new target
Trx project is powerful
Good Luck
Abtin

TRX/USDT Broke Out Resistance so ready for 125% from here...?#TRX/USDT TA Update:-
$TRX currently trading at $0.108
And recently broke out very long term resistance level.
And candle also closed above resistance level.
So I am buying some $TRX here.
Entry:- $0.1-$0.108
Targets:- $0.136/$0.164/$0.236
Stop Loss:- $0.093
Support: $0.1
Resistance:- $0.136/$0.164/$0.236
Press LIKE ❤️ and Share
