Tron

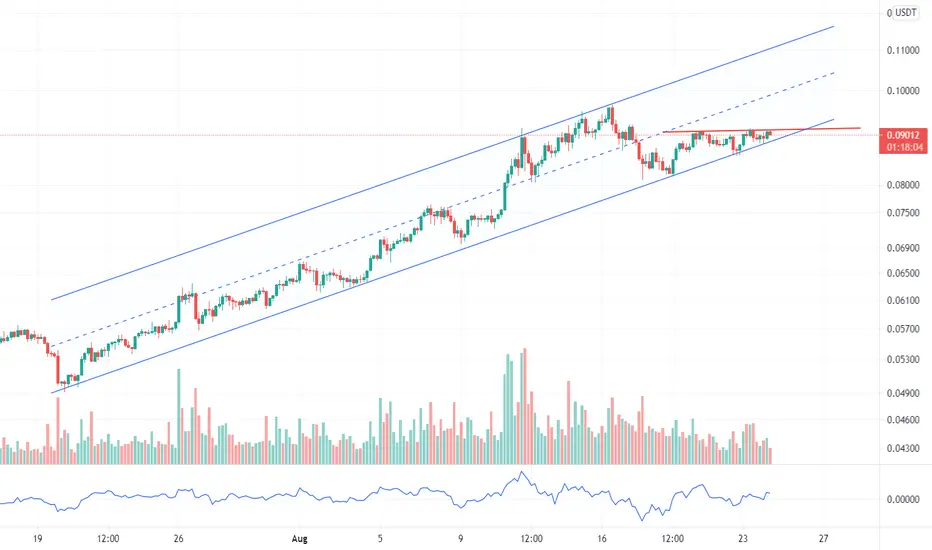
Tron TRXUSD - ATH SOON + Ascending channel- On the chart we can see an incomplete Impulse Elliott Wawe (5th wave).
- Rounding bottom or cup and handle is also printing on the chart.
- Volume is very bullish and also RSI is prepared for another pump!
- Target is 1:1 fib trend-based extension + top of the ascending channel + 5th elliott wave
- For expected duration of the trade, probability, stop loss, profit target, entry price and risk to reward ratio ( RRR ) - please check my signature below ↓
- Huge bullish volume is also one of the positive signs!
- If you want to see more of these ideas, hit "Like" & "Follow"!

TRX fuelling up for breakoutGoing by the chart, TRX is moving in an Ascending Triangle.
Going by the rules, looks like TRX has already touched point E on the chart, and in a day or two it should breakout soon.
Potential entry zone should been between 0.08400 - 0.08550 and keep a stop loss at 0.8309 (3% Loss).
I have also given potential profit booking zones.
If you like my analysis then do drop a LIKE and a COMMENT. Also do SHARE it with your friends.
Also don't forget to smash that FOLLOW button to get daily analysis of multiple crypto currencies and sometime ASX stocks.
Note - These are my personal notes and in no way a financial advice. Do your own research and Trade wisely

#TRX Get a support levelSince the broken support level is still unreliable and may once again penetrate this level, after a good reaction or trigger, go to the entrance and continue the uptrend with the confirmation of full support

Simple technicalIt is a valid channel. Form a triangle at the bottom time frame. It is unlikely that the canal will be broken down.
Other charts also confirm this chart. Make a logical decision.
TRX Trade setupTRX is above a critical resistance and confirmed it as support. Trade setup Idea for TRX including moon shot to fib retracement. Where TRX is right now, it's easy to strategise a stoploss. 4 profit targets

TRON BREAKOUT Price Action Trading:-
Tron Long Opportunity
Reason to enter long
1. Support on diagonal trendline
2. Breakout
3. Double Bottom pattern ( W pattern)
4. 0.236 Fib level

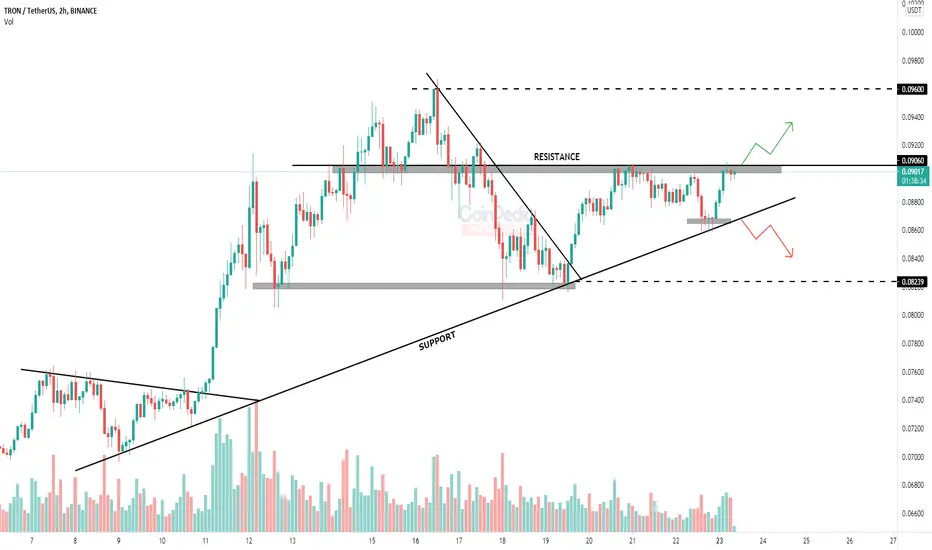
TRON analysis in 2H time frame* TRON is in a tight consolidation between it's resistance around $0.09060 and the below trend-line.
* The below trend-line is working as support for the price.
* If the price breaks the above resistance we can expect a rally till $0.0960.
* TRON is bearish below the lower trend-line (support).
TRON - 3.5 Year Bullish Wedge Near Completion, Get Ready!TRX isn't on many radars as it has been pretty dormant the past couple years, but long periods of low volatility often lead to powerful spikes. You can see the falling wedge in pink that TRX has been bounded by the past couple years. But Bitcoin's latest surge has brought some life to alts and has TRX knocking on overhead resistance. You can see that the weekly MACD is very bullish as it finds support above the zeroline. Once resistance is broken, I think TRX will go crazy. Barring a BTC collapse, I think Tron is poised for a massive breakout. I know the volatility TRX brings (see Dec 2017), so I'm making sure I'm on this rocket ship before it takes off!

TRXUSDT (Tron) 1D : VIP Bullish Signal As we can see, after breaking its downward trend, the price is gathering strength to start a strong climb.
In order to buy, the SL (stop loss) and capital management must be observed.
All resistances and TPs (take profits) are marked on the chart.
(DYOR)

TRX possible scenario for the next daysThis is not a recommendation to buy or sell. Do your own research.
Good luck

TRX is going to be volatileTRX should go to the resistance zone. on its way, there's a redline. if price breaks this line, it can go up to the next target. although there's no clear analysis of what happens in this gap.
The red support shown in chart is really powerful and will not be easily broken.
Don't forget to follow and comment

TRX/USDT : Expecting a Bullish Movement.Hi every one
TRON/USDT
TRX/USDT has managed to Break the Descending channel which It was stuck in. Now the price has a Great chance to do a Good Bullish movement. It can reach the Resistance shown In the Picture (around 0.9) there is a Good chance that the price does a pullback to the channel before continuing the Bullish Movement.
Summery:
-TRX has broken the Descending channel
-The greatest Resistance for TRX is around 0.08$
-There should be a pullback before the bullish movement happens
Previous Analysis:
💎Traders, if you liked this idea or have your opinion on it, write in the comments, We will be glad.
Thank you for seeing idea .
Have a nice day and Good luck

Tron TRXUSD - Elliott wave + Massive channel!- On the chart we can see an incomplete Impulse Elliott Wawe (5th wave).
- Rounding bottom or cup and handle is also printing on the chart.
- Volume is very bullish and also RSI is prepared for another pump!
- Target is 1:1 fib trend-based extension + top of the ascending channel + 5th elliott wave
- For expected duration of the trade, probability, stop loss, profit target, entry price and risk to reward ratio ( RRR ) - please check my signature below ↓
- Huge bullish volume is also one of the positive signs!
- If you want to see more of these ideas, hit "Like" & "Follow"!


TRXUSD (TRON) Target Price 0.1120TRXUSD (TRON) closed above 0.0909 and retested 0.0909. Entry at close of pin bar.

trx 4hr looks ready for next leg up 4hr ascending triangle, making higher lows. has been slowly consolidating

TRXUSD Target Price 0.0916TRXUSD Tron Entry Price 0.0842. Trade Set Up is entry at Pin Bar Close Price.

Tron start it's amazing moves ... BULLISH to $0.086Take position after breakout and closing candle.
It's just for education.
I will be happy to use your comments.

Tron has broken above- 0.9 in sightAlso Tron is on the run since 20th July, and after breaking above the double bottom's neck-line, the coin confirmed the break as a genuine one and now is making a new high.
I expect a continuation and 0.9 resistance is my target

Tron TRXUSD - Massive Ascending channel + Impulse Elliott Wave!- On the chart we can spot an incomplete Impulse Elliott Wawe (5th wave).
- Rounding bottom or cup and handle is also printing at the chart.
- Target is 1:1 fib trend-based extension + top of the ascending channel + 5th elliott wave
- For expected duration of the trade, probability, stop loss, profit target, entry price and risk to reward ratio (RRR) - please check my signature below ↓
- Huge bullish volume is also one of the positive signs!
- If you want to see more of these ideas, hit "Like" & "Follow"!


TRXUSD OpportunitiesTRXUSD remains bullish as structure keeps creating higher highs and higher lows. Look around the marked areas for 4 hour candles rejections. As long as price respects marked area, buy opportunities could be taken.
