Trx daily predictionI think she’s about to explode, macd is crossing up hopefully we get our next leg up.
Not financial advice
Tron

Doesn't want to upload(sorry)but posting anyways! TRX possible ☕Hello traders and investors! 😃👋 This idea was not loading correctly last time I posted, but I would like to put it out there anyways I hope you understand.
Here we have TRX(TRON) on a 6 hour chart, drawing is just for fun, but I am actually monitoring TRX to see if this can play out 👀🧐🔍📌🥳
This is a long-term investment idea📆📅
I have mixed feelings about TRX but it has shown great strength in the past🕡🕝🌞🌚💪
TRX is involved in many Dapps/high risk gambling games/is a very successful blockchain..🕹🏀🎮♣♠♟🎲
TRX is very volatile and this would be a RISKY trade, but could be potentially very profitable.⏬⏫🐂🐮🐻💲
The fact that BTC has been getting a lot of fundamental hype today and has gained support(knock on wood,) at ~50,000 and again at ~53,000 makes me believe that TRX could continue to pump, and possibly complete a "'Cup and handle"' formation.💹🙂☕
Let's wait and see, and possibly analyze again in the near future!!
🛑🛑🛑THIS IS NOT FINANCIAL ADVICE🛑🛑🛑
Always keep a stop loss🤚🛑💲, keep a close eye 👀 on BTC for sudden bearish movement that would be very dangerous⚠⚠⚠ and trade at your own risk!!!!
Thank you so much!!!😁💹🤪 Would love to know what YOU think about TRX/TRON
Any thoughts 🤔💭, questions🙋♀️🙋♂️❓, good👍, bad👎, happy😃, sad😥, always welcome in the comments below⏬!
Jazerbay
🤍

Tron, Wave-Developments In Structure, These Scenarios Important!Hi,
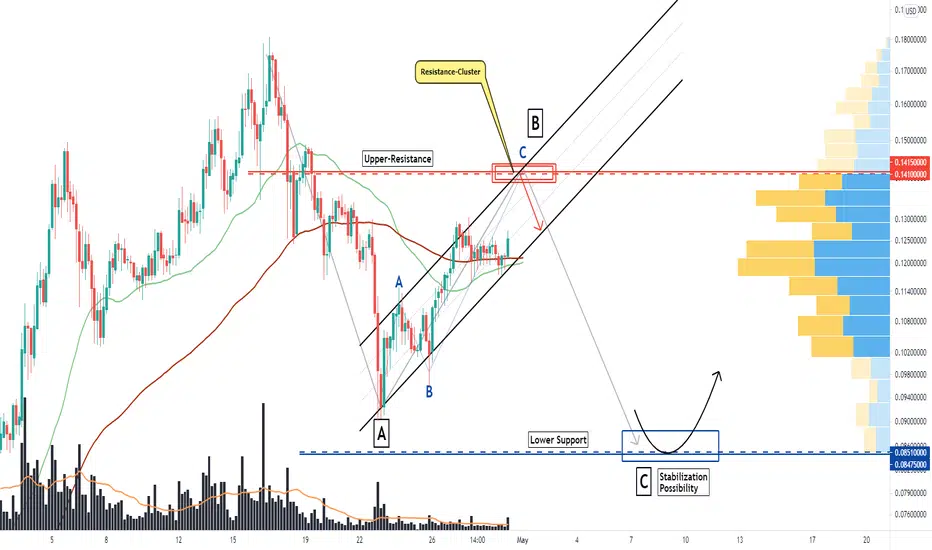
Welcome to this analysis about Tron, we are looking at the 4-hour timeframe perspective. As the cryptocurrency market divergence is increasing more and more there are currencies showing more bullish alignments while others having more bearish ones. With Tron there is initially forming this ascending-channel-formation now with the coherent wave-count within the formation, the ending of the wave-count with the wave E is running directly into this main resistance-cluster from where a pullback is likely to emerge, this will lead to further testing of the lower support as shown in my chart however this does not mean Tron does not have further potentials in upcoming times as there are still good bullish edges on the more global perspectives.
In this manner, thank you for watching the analysis and great contentment for everybody supporting, all the best!
"The high destiny of the market is to explicate rather than to speculate."
Information provided is only educational and should not be used to take action in the market.
TRX\XRP - Tracking Minor Waves - Making Note Of The Differences In this video I go through TRX, XRP and TRX\XRP.
The idea is still the same and continues to be a consistent view on these very interesting charts.
I make note of some key differences between the corrective price action and what it will mean moving forward.
Not all Cryptos will make stellar moves but that's OK because we have potentials targets at our disposal.
I know where I am putting my dirty fiat.
Either way we are approaching an interesting crossroads for these pairs and I will continue to track them.
I have taken the liberty of linking some related ideas down below in case you are bored.
If you don't know the long term pattern shouldn't you be doing your research instead of just following the crowd?
Just remember: I am not a financial advisor, I suggest using this only as a guide. Always do your own research.

TRON to $3.11 or $42Before you crucify me... Yep I know! Market cap big big! Is that even possible? Well first target ($3.11 +22x) would put the market cap at around 190b. If I compare that to where the market is now it doesn't look likely but if I compare it to where I think the rest of the market will be by the end of the year; it starts looking more reasonable. However, the second target ($42 +340x) would put it at 2.7t... In its current state I don't think that's possible. But If there's one thing I've learnt from being in this market; it's that sometimes the chart can hint at what's going to happen well before it actually happens... So that makes me wonder what could get TRON to these crazy numbers? A massive token burn maybe? Some kind of burn function incorporated into the protocol that makes it deflationary? I'm just speculating now. Only thing I can say for sure is that if TRON gets back to my buy box I'll be loading the boat.
Key points:
A retrace back to .04c - 0.072c would be an awesome opportunity to get long
The stop-loss for this trade would be just under the 3/1 Gann fan line which is constantly moving higher
First target is $3.11 and is a confluence zone for the parallel channel and the 1/1 Gann fan line
Second target is the 1.618 fib target for a wave 3 and is also in confluence with the 1/1 Gann fan line if it takes until FEB 2022 to play out
Lets not even go into where the wave 5 is projected to go in 2024-25.
Never Trust. Verify.
D.Y.O.R. Not Financial Advice Just an Observation.
Technical Analysis is not about being right, it's about increasing your odds.
Be prepared to be wrong. Risk management is key . Capital preservation above all else.

TRX/BTCThis is weekly candle
$TRX is finally ready to fly to the moon because it supported at important trend line.
However, as you can see, it may take a while because it is a weekly candle so this dinosaur needs some patience. okay?
Tron is making a universe. $TRX, $BTT, $JST, $SUN. . .


TRXUSD Crypto
TRX / USD
Chart guide: Red = monthly,Purple = weekly,Blue = daily,Green = 3 hours&Yellow = 1 hour

TrxUsd- New leg down?After finding strong support at 0.09, Tron started to correct only to encounter strong offers at 0.13
A new leg down could follow from this point on this coin and a drop to 0.66 liquidity zone is not out of the question
0.09 recent low also offers support.
I m bearish as long as the price stays under 0.13


Tron (TRX) - April 27Hello?
Dear traders, nice to meet you.
By "following" you can always get new information quickly.
Please also click "Like".
Have a good day.
----------------------------------
(TRXUSD 1W chart)
(1D chart)
We must see if we can ascend above 0.12748467 point
If it goes down, you need to make sure you get support at 0.10487024.
If it falls from the 0.07253780 point, a Stop Loss is required to preserve profit and loss.
To continue the uptrend, it needs to be supported at 0.12748467.
----------------------------------
(TRXBTC 1W chart)
(1D chart)
We have to see if we can gain support and ascend in the 199 Satoshi-215 Satoshi section.
If it falls at 168 Satoshi, Stop Loss is needed to preserve profit and loss.
--------------------------------------
It is advisable to trade at your average unit price.
This is because if the price flows below your average unit price, which was on an uptrend or downtrend, there is a high possibility that you will not be able to earn a large profit due to the psychological burden.
The center of every trade starts with the average unit price you start trading.
If you ignore this, you may be trading in the wrong direction.
Therefore, it is important to find a way to lower the average unit price and adjust the proportion of the investment, so that the money that ultimately corresponds to the profit can regenerate the profit.
-------------------------------------------------- -------------------------------------------
** All indicators are lagging indicators.
So, it's important to be aware that the indicator moves accordingly with the movement of price and volume.
Just for the sake of convenience, we are talking upside down for interpretation of the indicators.
** The wRSI_SR indicator is an indicator created by adding settings and options from the existing Stochastic RSI indicator.
Therefore, the interpretation is the same as the conventional stochastic RSI indicator. (K, D line -> R, S line)
** The OBV indicator was re-created by applying a formula to the DepthHouse Trading indicator, an indicator that oh92 disclosed. (Thank you for this.)
** Check support, resistance, and abbreviation points.
** Support or resistance is based on the closing price of the 1D chart.
** All explanations are for reference only and do not guarantee profit or loss on investment.
Explanation of abbreviations displayed on the chart
R: A point or section of resistance that requires a response to preserve profits
S-L: Stop Loss point or section
S: A point or segment that can be bought for profit generation as a support point or segment
(Short-term Stop Loss can be said to be a point where profits and losses can be preserved or additionally entered through installment transactions. It is a short-term investment perspective.)
GAP refers to the difference in prices that occurred when the stock market, CME, and BAKKT exchanges were closed because they do not trade 24 hours a day.
G1: Closing price when closed
G2: Cigar at the time of opening
(Example) Gap (G1-G2)

TRXUSD Is this a Cup pattern?
I think TRXis completing the Cup and Handle Pattern (Completing the handle now).
Considering the BTC further correction and its influence on TRX, (and also the fact that the last wave's structure is still incomplete) we should still expect a further correction for TRX.
In the end, TRX looks very good in the long run, with the promise of reaching 6.8$.

TRX | looks like Longif it breaks the line, we are gonna have a great Long!
if not... i wonder how is it gonna loose!


TRX\XRP Update - Turning Point For XRP - Tron Eye's $1.50Just a quick update on the Tron VS XRP situation.
I am long term bullish on XRP so I am going to use this analysis to buy more XRP using profits from TRX.
It's an interesting situation and one that will either prove to be either successful or simply wrong.
The proof will be in the pudding.
Check out the related ideas linked below.
If you don't know the long term pattern shouldn't you be doing your research instead of just following the crowd?
Just remember: I am not a financial advisor, I suggest using this only as a guide. Always do your own research.


💡 TRX/USDT💡 Hello everyone, if you like my idea, follow me with likes and comments, I will also try to share the best ideas with you, Always do your own research before opening positions and always put stop limit.

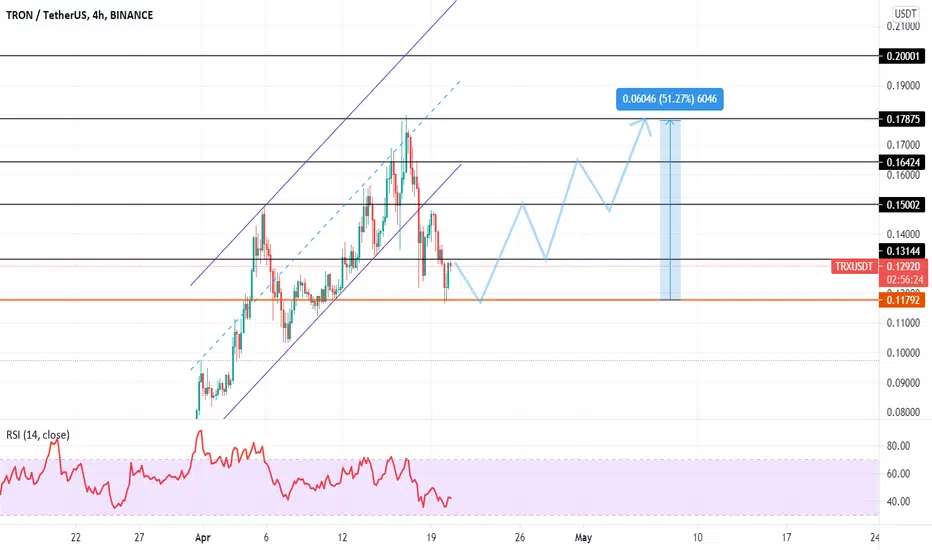
TRON CLEAN TECHNICAL ANALYSIS CURRENTLooking attain here on the 1hr time frame we can see price has come up to a all time high area coming from a previous impulsive leg to this level where price rejected from 0.18.
Currently price has tripled down the the 2.618 fib level where support is being tested, price has got to this level in toe from of a descending channel (squeeze), price has made clean touched within the trend lines confirming the pattern.
Anticipating fro price to possibly make a push to the downside one more time to the 0.119 level where a second touch of the descending channel and the outer structure will meet at the signifiant 2.618 fib support.
There is a high probability that price will reject this level and make a push to the upside once again reaching the 0.16 level, then looking for price to create support at the 2.618 level before continuing higher

tron/tether have a two tp!It seems two tp Based on H&S pattern and fibonatchi .
The 1st one done, It's better to find second tp will happen or not then buy again!
Need a correction !
Good luck!