TRON 240 MIN CHARTFinally TRX seems to have broken the continuation figure and is looking for support in the area marked above.
- Scenario 1: We can anticipate at this point an entry to look for the previous resistance area as TARGET 1 and 0.08 $ as TARGET 2 with a SL at 0.047 $.
- Scenario 2: Wait for a confirmation with rising highs and lows + BREAK and place our stop below this figure.
-----------------------------------------
Finalmente TRX parece que ha roto la figura de continuación y busca soporte en la zona marcada anteriormente.
- Escenario 1: Podemos anticipar en este punto una entrada a buscar la zona de resistencia anterior como TARGET 1 y los 0,08 $ como TARGET 2 con un SL en los 0,047 $.
- Escenario 2: Esperar una confirmación con máximos y mínimos crecientes + BREAK y Situar nuestro stop debajo de dicha figura.
Tron

TRXUSDT BuyHello Traders!
TRXUSDT has formed a channel and it's very close to the support area.
It's strong bullish sign it will break this channel upside.
The target at 0.08 will give the 55% of the investment
Don't forget to hit the like button and follow to stay connected.

TRX/USDT 4H + FUNDAas you know , today ( 8 march ) trx join the DEFI networks
If 0.05 support is maintained, there is a possibility of price growth up to 0.06 resistance along with this news.
lets see what happens


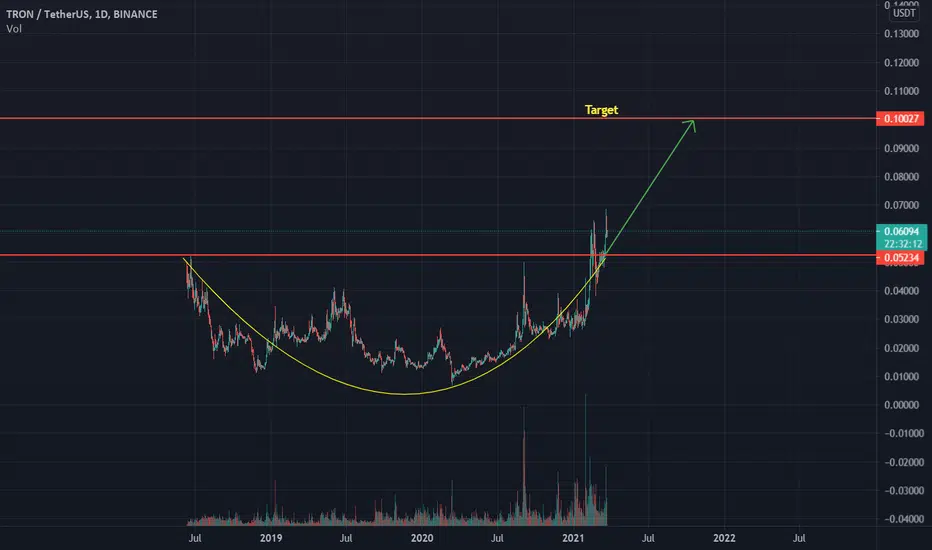
$1 Trx is possible ?Trx is very bullish and broke the neckline of the cup. TRX immediate target .10
we discussed the same in our today's video
Tron (TRX) - March 23Hello?
Dear traders, nice to meet you.
By "following" you can always get new information quickly.
Please also click "Like".
Have a good day.
-------------------------------------------------- -----
We have to see if we can ascend to the 0.06103-0.06366 range.
In particular, it remains to be seen if it can rise along the uptrend line.
If it falls from the 0.05577 point, a short stop loss is required.
However, it may rise along the uptrend line, so careful trading is necessary.
-------------------------------------
(TRXBTC 1D chart)
We have to see if we can ascend more than 114 Satoshi.
If it falls, we need to see if it can rise along the uptrend line.
-------------------------------------------------- -------------------------------------------
** All indicators are lagging indicators.
So, it's important to be aware that the indicator moves accordingly with the movement of price and volume.
Just for the sake of convenience, we are talking upside down for interpretation of the indicators.
** The wRSI_SR indicator is an indicator created by adding settings and options from the existing Stochastic RSI indicator.
Therefore, the interpretation is the same as the conventional stochastic RSI indicator. (K, D line -> R, S line)
** The OBV indicator was re-created by applying a formula to the DepthHouse Trading indicator, an indicator that oh92 disclosed. (Thank you for this.)
** Check support, resistance, and abbreviation points.
** Support or resistance is based on the closing price of the 1D chart.
** All explanations are for reference only and do not guarantee profit or loss on investment.
Explanation of abbreviations displayed on the chart
R: A point or section of resistance that requires a response to preserve profits
S-L: Stop Loss point or section
S: A point or segment that can be bought for profit generation as a support point or segment
(Short-term Stop Loss can be said to be a point where profits and losses can be preserved or additionally entered through installment transactions. It is a short-term investment perspective.
GAP refers to the difference in prices that occurred when the stock market, CME, and BAKKT exchanges were closed because they do not trade 24 hours a day.
G1: Closing price when closed
G2: Cigar at the time of opening
(Example) Gap (G1-G2)

Consolidation below resistance is bullish trxusdtrx usdt chart confluence with the trxbtc double bottom deviation
looks like this one getting sent soon 1-4weeks imo
prbly will be with the rest of the altcap
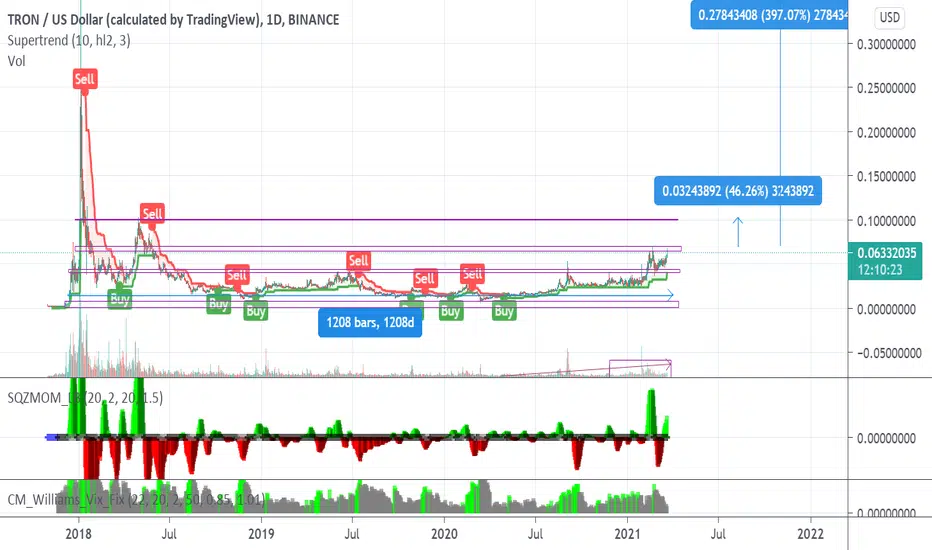
but still, 48% and then 400% targets
4x in 3months probalby thats a fairly good mid term swing
TRON LOOKS PRIMED FOR A BREAKOUTLots of volume coming in here and a classic charting pattern working here,could reach .1 + with the type of moves we're seeing from altcoins.

TRX could finally do something!While Many Alts have reached their ATH in Feb Bull run or are about to, Tron lagged behind. However with the recent announcement of Tron entering Defi and also looking at the chart in the Weekly time frame I am giving it a high chance to Tron for some sharp gains in March.
In the weekly chart we can see that it has broken out of its descending triangle for a while and that it has not broken the green trend line support since June. since first week of Feb it's been also riding on the support of Purple line without closing below it.
the Bearish momentum signal has still not given a Volatile circle however I expect to see it in next week's candle.
If needed I will update the analysis in coming week.
in most bullish scenario it could reach the 2nd Target before end of March.
NOT A FINANCIAL ADVICE!
P.S Also hope Mr. Sun helps this momentum by sharing a Funda news which despite his usual hype attempts, is actually meaningful.

TRXUSD 4th Wave longlooks like it could either be a 4th wave, or a 5th wave, but if we are right about 4, we could see this blow, reduce risk, ride it out.


Tron (TRX) - March 16Hello?
Dear traders, nice to meet you.
By "following" you can always get new information quickly.
Please also click "Like".
Have a good day.
-------------------------------------------------- -----
We need to see if we can get support and climb in the 0.04787-0.05050 range.
If you fall from 0.04787 point, you can touch 0.03998 point, so you need a short Stop Loss.
If it falls from the 0.03998 point, a Stop Loss is needed to preserve profit and loss.
It remains to be seen if volatility around March 21 could break the downtrend line.
-------------------------------------------------- -------------------------------------------
** All indicators are lagging indicators.
So, it's important to be aware that the indicator moves accordingly with the movement of price and volume.
Just for convenience, we are talking upside down for interpretation of the indicators.
** The wRSI_SR indicator is an indicator created by adding settings and options from the existing Stochastic RSI indicator.
Therefore, the interpretation is the same as the conventional stochastic RSI indicator. (K, D line -> R, S line)
** The OBV indicator was re-created by applying a formula to the DepthHouse Trading indicator, an indicator that oh92 disclosed. (Thank you for this.)
** Check support, resistance, and abbreviation points.
** Support or resistance is based on the closing price of the 1D chart.
** All explanations are for reference only and do not guarantee profit or loss on investment.
Explanation of abbreviations displayed on the chart
R: A point or section of resistance that requires a response to preserve profits
S-L: Stop Loss point or section
S: A point or segment that can be bought for profit generation as a support point or segment
(Short-term Stop Loss can be said to be a point where profits and losses can be preserved or additionally entered through installment transactions. It is a short-term investment perspective.)
GAP refers to the difference in prices that occurred when the stock market, CME, and BAKKT exchanges were closed because they do not trade 24 hours a day.
G1: Closing price when closed
G2: Cigar at the time of opening
(Example) Gap (G1-G2)


TRX at support, Good buy zoneTRX is now trading at the support zone and this is a good buy zone. TRX hasn't pumped in this altseason and a big pump is pending. We expect a good rally in TRX soon and this is a good time to fill your bags.
Buy Zone: around $0.05
Target: $0.055 - $0.06 - $0.066 - $0.072 - $0.079- $0.085 - $0.097


TRX/USDT BUY SIGNALTron does look extremely bullish and we are likely to test the key psychological area in the next week or two.

Bull Can start for #TRXI think it can be a start for #TRX , dynamic support help it to stand on uptrend, so i think the bearish was just because of crypto atmosphere.
we can see a good feature price for TRX.


TRX breaks the ascending triagnle TRX breaks the ascending triangle and ready for the next rally. TRX also has a news event coming next week that will push the price higher. This is a good setup for short-term trading.
Buy Zone: around $0.05
Target: $0.054 - $0.06 - $0.066 - $0.074 - $0.081
