Could TRON #TRX 6X v #BITCOIN TRXBTC
has very good market structure
(higher high's , higher lows's)
for the past 3 years.
Overlooked , & under-appreciated it seems like, in my view on it's sentiment on Justin's success of network adoption.
We can see a clear Inverse head and shoulders
with a very key neckline level
that if broken with strength
could a indicate a run at the LOG target.
A disappointing TRX may only reach the linear target and not much beyond.
My TRXUSD chart which I am watching also does point to a stellar Bull market for TRX
Tron

Tron is above the neckline of a long standing logchart C&HStill working on a weekly candle close above the rimline of this cup and handle and also the top trendline of an even bigger symmetrical triangle pattern seen here on the logarithmic weekly chart. The smaller and more realistic potential breakout target here is for the cup and handle pattern, the one that’s al the way up at $23 is the target for the symmetrical triangles breakout. Seems improbable that Tron could somehow reach a price as high as $23 when considering how sketchy Justin Sun has seemed over the last few years but that is indeed what the chart reveals. I think the smaller cup and handle breakout target is much more probable. For now though we still don’t even have a weekly candle close above the rimline yet, so before getting too excited about Tron s price action I’d need at least 1-2 weekly candle closes above that trendline…maybe even 3-4. Something to keep an eye on here. *not financial advice*

TRX-USDT / 4H / TECHNICAL ANALYSISBINANCE:TRXUSDT I have set the resistance at 0.13017, support at 0.09559, and the daily pivot point at 0.10475 for TRXUSDT. My target is 0.12308, and this target remains valid as long as the trend line is not broken.
Like and comment if you find value in our analysis.
Feel free to post your ideas and questions at the comments section.
Good luck

TRON looks like it wants to make a run northward!If Tron can breakout of the .1106 level, it might be able to run hard for a bit. It's above the 50 DMA and the 200 DMA on the 15 min chart as we speak.

Signal again in high & low(TRX)❤️❤️Thanks for boosting 🚀 and supporting us!
📊 (Entry) : 0.10233(buy)- 0.10832(sell)
🔴 Stop Loss : 0.1(buy)- 0.11035(sell)
🎯 Take Profit : TP-1 = 0.10357 (TP-2 in entry reverse position)
🔗 For more communication with us, In the footnote and send a message in TradingView.
👨🎓 Experience and Education: Our trading team has five years of experience in financial markets, especially cryptocurrencies.

TRXUSD - Global Idea dump on 37% in autumnWhat will happen to the coin in the near future with a high probability. Buy exclusively from these zones and the red zone is a squiz zone if bitcoin is very bad and it falls badly in autumn. The expected start of the bull race on TRON TRX is waiting for a week-long candle on November 14

Tron TRX aiming for 0.13 short termBullish pennant, break out, retest, go! I just put it out here to see how this turns out.

#TRX/USDT LONG#TRX
The price is moving in a cross channel on a 1-day frame
Supported by price stability above moving average 100
It is expected that this descending channel will be broken upward
Current price is 0.10750
First goal 0.11078
Second goal 0.11466

Huge upside potential for tron trxthe chart is pretty self-explanatory
there is a massive pattern for trxusd on the daily chart...
please set the target and stop loss accordingly
100 percent profit potential for a 10% stop loss
this trade is worth taking.
this is just entertainment and NOT financial advice :)
good luck!

Tron (TRX) completed setup for upto 16% pumpHi dear friends, hope you are well and welcome to the new trade setup of Tron (TRX) with BTC pair.
Previously we caught more than 10% pump of TRX as below:
Now on a daily time frame, TRX formed a bullish AB=CD move for the next pump.
Note: Above idea is for educational purpose only. It is advised to diversify and strictly follow the stop loss, and don't get stuck with trade.

Tron, 5 days consolidationAMEX:TRX inside ascending triangle and already touch fibonacci support 0.10212
this coin already enter accumuation with 5 days and 12 hours consolidation,
you can see I also draw bullish trendline,
in the next hours (not more than 12 hour), this coin will rally to reach triangle resistance,
maybe with little a pump, that indicate the consolidation time already over.
The worst case is fibonacci support at 0.10212 break down, if this happen, I still have ascending triangle support trendline.
My entry :
.10310 current price
.10212 fibonacci support
.10018 Higher low
Target : .11017 Ascending triangle resistance
Risk every entry : .00100
Risk reward ratio : 6.54
Actual profit percentage : 654%
Good luck, happy trading.

TRXUSDTBINANCE:TRXUSDT Long idea
⛔"Daily crypto market analyses I provide are personal opinions & not financial advice. Trading carries risks, so do your own research & seek advisor's help.#DYOR"
Don't forget to like and comment

TRX Ready for Parabolic Bullish Cycle ⬆BINANCE:TRXUSDT
Hi Traders, Investors and Speculators of the Charts 📈📉
Ev here. Been trading crypto since 2017 and later got into stocks. I have 3 board exams on financial markets and studied economics from a top tier university for a year.
After finally breaking out of triangular consolidation, TRON has confirmed a reversal after the bearish market and is starting a new bullish cycle. From the left we analyze the trend lines to get targets for the next bullrun and on the right we take a quick look at technical indicator CryptoCheck START V3.5 to confirm the bullish bias.
INCASE YOU MISSED IT : 👉 Another altcoin recently formed a bullish pattern:
_______________________
📢 Show us some LOVE 🧡 Follow for daily updates and trade ideas on Crypto , Stocks , Forex and Commodities 💎
We thank you for your support !
CryptoCheck

TRX/USDT: TRON Confirmed breakout for LONG tradeAs we can see from the chart, TRON has a clear breakout from its resistance. This is a good time to enter a LONG trade.
Entry Price: 0.104
StopLoss: 0.100
TP1: 0.1068
TP2: 0.1105
TP3: 0.1128
Like and follow us and share your thoughts in the comments.
Cheers
GreenCrypto

TRX to $0.12? Prepare for a Long!TRX continues to march into its current bull channel, pressing on for higher prices. The price just touched the channel resistance and is pulling back, but to what price? We have the previous high in the channel at $0.095 then the 30EMA and bull channel support around $0.09.
How do we trade this?
We're in a bull channel, which means our probability of profit is higher if we long. If you longed at the channel support every time the price made contact, you would make money. Let the trend do the talking and follow it. We should be looking for entries near two key support levels: the 30EMA and bull channel support, which is around $0.09.
Do we simply long when that price is hit? Absolutely not. Wait for a strong bull signal bar closing on or near its high at those levels, confirming that the support is still being respected. Once you see that bounce, it's reasonable to enter a long, place a protective stop just below the channel support, and set your take profit somewhere in the top 20% of the channel as shown in my analysis. This gives you a 1:3 Risk/Reward ratio, meaning you could run this trade 10 times, hit your take profit 30% of the time, and still be profitable.
Bitcoin is also at risk of pulling back since it's near Weekly resistance; see my recent analysis for reference. TRX RSI is also around 70.00 which is a weak indicator on its own, but supports the previous data points mentioned here.
Key Points
1. Bull Channel. Look for Long Entries.
2. Channel Resistance Touched. Pullback in Progress.
3. Bitcoin Leading Indicator, Risk of Pullback.
4. RSI near 70.00, Plenty of Room to Fall.
5. Look for Bull Signal at Weekly 30EMA.
You are solely responsible for your trades, trade at your own risk!
Let us know what you think in the comment section below!

TRX/USDT , Technical analysis , CyclicityInteresting active , TRX/USDT , Timeframe 1 week.
Cyclicality in the market, please pay attention to my idea TRX/BTC

TRON/BTC , Ascending triangle , timeframe 1 weekFormation of an ascending triangle on such a large timeframe.
Working out of the previous descending triangle is shown by red lines!
Price is clamped in the triangle, volumes are decreasing, there is a possibility of accumulation of coins before the breakout and achieving the specified goals
Thank you for your attention

TRX/USD Main trend. Cup with handle. Triangle.The main trend(most of it). Logarithm. Weekly chart.
Coin in coinmarketcap : TRX
An idea to understand the trend and visualize the formation of a bullish formation in a bear market and such large size. The reversal/jamming zone is yellow levels. Quite a long time the price is squeezed the final phase of the triangle. Volatility is decreasing. At the decoupling, the exit is very likely to be momentum by a significant percentage.
Linear, to understand the trend and clarity of formations. A cup with a handle, a large triangle with a base of about 200%.
Candlestick chart with the same parameters.
Secondary trend. Close-up of the triangle area.
Pair to bitcoin
TRX/BTC Main Trend. Linear 1 week. Rhombus 250%

Tron TRX price knows how to surprise with its "maneuvers"The TRXUSDT price often moves differently from the rest of the market.
This may be because Justin SUN is behind the project, and he likes to "impose his own game" on the market. He is an interesting character in the crypto industry, you can read various investigations and stories about him in your spare time.
So, the other day, the TRXUSD price hit a strong mirror level of $0.09. Now TRX price is undergoing a correction.
If you believe that Tron's growth trend has not yet reached its culmination and will continue to move in a similar manner to 2020, then buying TRX closer to $0.072 is for you.
However, if the TRXUSDT price consolidates below $0.068, the decline may continue, at least to the range of $0.052-0.055
_____________________
Did you like our analysis? Leave a comment, like, and follow to get more

Is TRON leading the market? When will market crash?Tron has shown extreme relative strength in down market
Tron held up relatively very well. It fell less than ever bitcoin this bear market. That is a strong indication of relative demand. Important to keep in mind that not only was it relatively strong from a technical standpoint, fundamentally its users/fees was extremely relatively high. It looks like one of the biggest value plays in crypto and its moving as such.
Keep an eye on USDT for when market crashes
If USDT starts to drop then we can see cash being pulled out of the system rather than just cycling thru to either BTC or ETH (or TRX?) or TOTAL3. The rotation of capital is a nice cycle but it does always lead to eventually a net redemption of stablecoins as capital rotates out entirely to book profits and look to other markets (bonds/commodities/equities). Keep an eye on USDT for this moment!

TRON (2023) v BTC (2016)Tron (TRX) has been a legacy coin that has held its own and carved out a niche
Most legacy coins have faded away into obscurity as they've been unable to find a usecase or adoption. They may still have high market caps and may still turn things around but as of now many older coins are falling down the ranks. New coins are eating up dominance. Not for Tron. Tron has consistently been raking in fees and holding a relatively very low fee to price ratio (according to tokenterminal).
$3m in daily fees v SEED_TVCODER77_ETHBTCDATA:8B FDMC
To put into perspective.. Ethereum has had $3.4m fees in the same 24hr period and has a $200b+ FDMC. This makes Tron look wildly cheap into those isolated terms. According to Tron they'll continue using fees to burn token supply. Essentially share/token buy back program. With SEED_TVCODER77_ETHBTCDATA:1B in yearly fees and SEED_TVCODER77_ETHBTCDATA:8B in FDMC.. in 8yrs time 1 single TRX will be worth SEED_TVCODER77_ETHBTCDATA:8B (all things remaining equal.. they wont).
This creates an interesting opportunity to keep an eye on.
From a TA perspective we have a very bullish structure on TRX
This structure is reminiscent of BTC back in 2015/2016 in the build up to the 2017 bull market. Check video for more details on the technical side of things.

TRX to $0.10?TRX is trading within the uptrend channel.
which u can see its rally throughout the whole 2023.
$0.080 is the key level for TRX .
must hold.
MACD still favor to the bull.
next resistance $0.10
DYODD

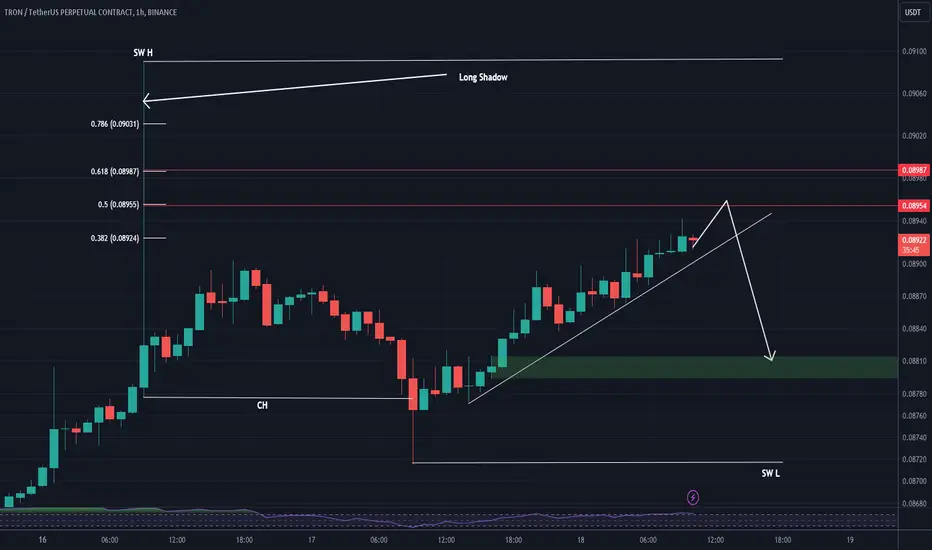
TRX can have a crash (has an educational point)TRX can have a crash
There is an educational tip here, pay close attention:
Educational tip: When we have long shoadow, the price tends to fill 50-60% of these shodows and then continue in the opposite direction. If a CH is in the opposite direction of the long shadow, we have more confirmation.
If more than 70% of the log is filled, it is possible to pass the log.