🔴TRX is retaining the support floor still ▶️ TRON
⏰ Time Frame : 1D
✴️ If the correction is finish, this range can be considered for drawing fibo ( 0.12933 - 0.05101 )
Resistances has shown by Fibonacci numbers.
🔴 and has shown support zone . It is important to maintain this area
❓ What Do you think about Continue of trend?
Please tell me
⚠️ (This isn't a signal for buy or sell)
#️⃣ 2022 / 04 / March
👸 Analyzed by : Parisa_Alipoor
Trxusdt

TRON - Medium TermOn a daily timeframe, Tron is in a position that is suitable for medium-term arrivals, with 0.068 and 0.075 targets. Be sure to observe your input volume so that if we are in a critical situation, we can transfer the average purchase to lower prices by increasing the input volume.

Trading opportunity in TRXUSDTBased on technical factors there is a long position in :
📊 TRXUSDT
🔵 Long Now 0.06000
🧯 Stop loss 0.05700
🏹 Target 1 0.06230
🏹 Target 2 0.06660
🏹 Target 3 0.07140
💸Capital : 1%
We hope it is profitable for you ❤️
Please support our activity with your likes 👍 and comments 📝

TRX/USDTabout my technical analysis trx looking bullish many pattern find out in trx
buy at current price
tp 1 s/r zone
tp 2 harmonic resistane

TRXUSDT long postion PossibilityHello every one
after TRX Fall like a shark now TRX is back in the channel and if it will break out it will rise up to the next support at 0.07174
all you need to know is in the chart
look closely and make your position smartly
this is just my idea and not a financial advice
leave a comment

LUNAUSDT 1D TA : Break LinesIt has successfully broken the downtrend line upwards and can move to the next resistance if it crosses the OB range. Otherwise, with a reaction in the price range of $ 70 to $ 75, the possibility of falling to the trend line is not unexpected.
Its not Buy or Sell SIGNAL
DYOR
BY: Mohamad Teriz @AtonicShark

Can TRX use energy for growth?Hello everyone, let's do the 1D TRX / USDT review.
As you can see, the price is below the downtrend line.
Let's set the two closest supports which are at the levels: $ 0.05564 and $ 0.05132.
while looking the other way, we can establish several resistance lines that the TRX will have to overcome on its way. The first resistance is at $ 0.07038 and the next resistance is at $ 0.08188 and $ 0.09087.
It is worth noting that on the CHOP indicator we regain energy again and there is quite a lot of it.

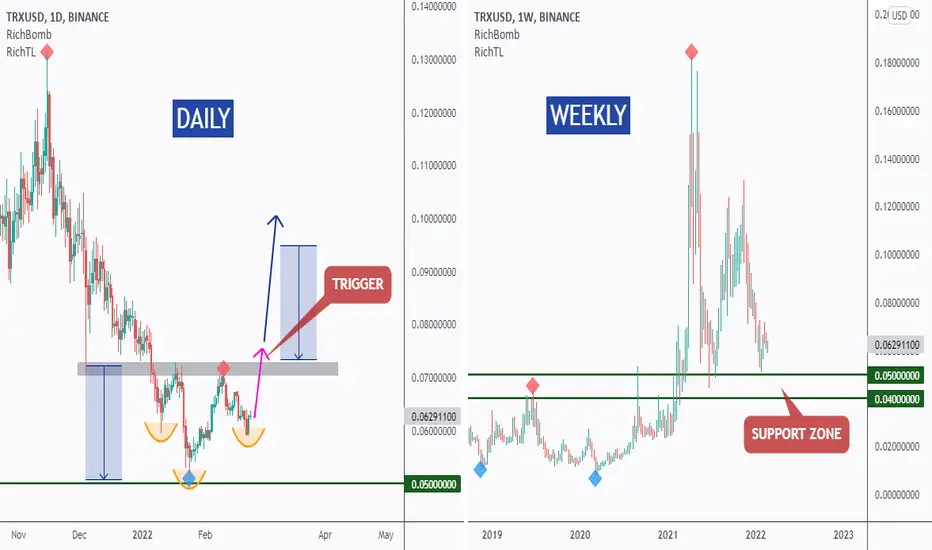
TRX - Top-Down Analysis!Hello everyone, if you like the idea, do not forget to support with a like and follow.
WEEKLY: Right Chart
TRX is sitting around strong support in green so we will be looking for buy setups on lower timeframes.
DAILY: Left Chart
TRX is forming an inverse head and shoulders pattern but it is not ready to go yet.
Trigger => Waiting for a momentum candle close above the gray neckline to buy.
Meanwhile, until the buy is activated, TRX would be overall bearish can still trade lower inside the green support.
Good luck!
All Strategies Are Good; If Managed Properly!
~Rich
TRXUSDT - Falling Wedge PatternTRXUSDT (4h Chart) Technical analysis
TRXUSDT (4h Chart) Currently trading at $0.0628
Buy level: Above $0.0626
Stop loss: Below $0.059
Target 1: $0.0644
Target 2: $0.0668
Target 3: $0.070
Target 4: $0.074
Max Leverage 3x
Always keep Stop loss
Follow Our Tradingview Account for More Technical Analysis Updates, | Like, Share and Comment Your thoughts

TRXUSDT TECHNICAL ANALYSISTRON lost over 65% last year April till now and $TRX hasn't reached out last ATH yet. The candles are staying on Support level and whole candles are in triangle. If recent candle open-close completely above to support line, it might be an opportunity for buy. One of the coming candle break out down trend-line and later candle open-close completely above down trend-line, it may another opportunity to buy as well. We haven't got buy signal from @EngineeringRobo daily time frame yet but we have got multiples buy signals in 3H time frame. MA7&25 changed direction on negative way but when we look at the MA20&50, it changed direction on positive way as well. We haven't got any buy signals on MA20 or MA50 yet. Also, if candles stay above to up trend line, it may gain more. But do not do any trade while candles are in triangle. Wait for clear out then move forward. Let's follow our chart together.
"NFA"

Update For TRX/USDT Analysis 📈📉
What's up Guys , in this analysis I gonna talk about TRX
As you can see in the daily and weekly time frame for pair of TRX/USDT ,since 16 April it has been declining after recording new ATH about 0.18$ ,
and now we can see that TRX is compressing in an descending or symmetrical triangle pattern ,
also there is a possibility of further fall right now bcs of crossing under of emas ,
and now It is trading above pivot zone and if break out this current zone in can go down to lower support and Demand area ,
meanwhile it has reached the bottom of triangle again and can have a jump again ,
by breakout of descending trend line , there is a high possibility to reach the targets respectively and seeing new ATH in the long-term .
so in this case it can continue its rally by closing above resistance range and have a pulback and continue .
🛑resistances: $0.099-0.107///descending trendline
🆚pivot zone: $0.057-0.064$
❇️supports: $0.012345-$0.03142 ////ascending trendline
--------------------------------------------------------------------------------------------------------------------
👉This analysis is my personal opinion ,not a financial advice ,so do your own research.
💜 if you're a fan of my analyses PLZ follow me and give a big thumbs 👍 OR drop comment 🗯💭

TRXUSDT 3D TA : Next MOVEIn the 3-day timeframe, it is on the dynamic resistance of its downtrend line. If the trend line breaks upwards, an uptrend will be formed, but according to the current market trend, the possibility of falling to the support range and then the trend line support is not far from expectation.
Its not Buy or Sell SIGNAL
DYOR
@AtonicShark

TRX/USDT - Potential 183% SetupHello Traders!
TRX demonstrates the continuation of the correction phase, completing the previous cycle.
It's better to form a medium-term position by buying from support levels of $0.0495, $0.0430, $0.0370.
It will be necessary to close the position in case of price fall under the level of $0.0240.
The profit taking targets within the medium term by the levels of $0.0830 $0.0930 $0.1050
Good luck and watch out for the market
P.S. This is an educational analysis that shall not be considered financial advice

TRXUSDT LongHey traders, we are monitoring TRON for a buying opportunity arounnd 0.064 zone, once we will receive any bullish confirmation the trade will be executed.
don't forget to supports with like and comments for more contents!
Trade safe, Joe.


TRON (TRX) - February 15Hello?
Traders, welcome.
If you "follow", you can always get new information quickly.
Please also click "Like".
Have a nice day.
-------------------------------------
(TRXUSD 1W Chart)
(Full: )
Above 0.0441 3840 point: Expected to create a new wave.
It must rise above the 0.0750 0028 point to turn into an uptrend.
However, in order to continue the uptrend, it must break out of the downtrend line.
If it declines from the 0.0441 3840 point, it is likely to enter the mid- to long-term investment zone, so you need to trade cautiously.
As the CCI line failed to rise above the EMA line in the CCI-RC indicator, the TRX entered a sideways section.
On the 1W chart, when the CCI line rises above the EMA line and above the +100 point, it is most likely showing a large uptrend.
(1D chart)
First resistance section: around 0.0864 4692
Second resistance section: 0.1124 3825 - 0.1254 3392
Support period: 0.0474 5992 - 0.0604 5559
-------------------------------------
(TRXBTC 1W Chart)
0.0000 0259 - 0.0000 0318 or higher: Expected to create a new wave.
It must move above the 0.0000 0194 point to turn into an uptrend.
------------------------------------------
We recommend that you trade with your average unit price.
This is because, if the price is below your average unit price, whether the price trend is in an upward trend or a downward trend, there is a high possibility that you will not be able to get a big profit due to the psychological burden.
The center of all trading starts with the average unit price at which you start trading.
If you ignore this, you may be trading in the wrong direction.
Therefore, it is important to find a way to lower the average unit price and adjust the proportion of the investment, ultimately allowing the funds corresponding to the profits to be able to regenerate themselves.
------------------------------------------------------------ -----------------------------------------------------
** All indicators are lagging indicators.
Therefore, it is important to be aware that the indicator moves accordingly with the movement of price and volume.
However, for convenience, we are talking in reverse for the interpretation of the indicator.
** The MRHAB-O and MRHAB-B indicators used in the chart are indicators of our channel that have not been released yet.
(Since it was not disclosed, you can use this chart without any restrictions by sharing this chart and copying and pasting the indicators.)
** The wRSI_SR indicator is an indicator created by adding settings and options to the existing Stochastic RSI indicator.
Therefore, the interpretation is the same as the traditional Stochastic RSI indicator. (K, D line -> R, S line)
** The OBV indicator was re-created by applying a formula to the DepthHouse Trading indicator, an indicator disclosed by oh92. (Thanks for this.)
** Support or resistance is based on the closing price of the 1D chart.
** All descriptions are for reference only and do not guarantee a profit or loss in investment.
(Short-term Stop Loss can be said to be a point where profit and loss can be preserved or additional entry can be made through split trading. It is a short-term investment perspective.)
---------------------------------


DOGEUSDT 1D TA : Next Move DOGECOINDOGEUSDT 1D If the downward trend line breaks upwards, there is a possibility of climbing to the specified targets. Otherwise there is a possibility of falling again to the support range.
This is not Buy or Sell SIGNAL
DYOR
@AtonicShark

What are targets for TRX ??▶️ TRON
⏰ Time Frame : 1D
🔴 It is important to break resistance zone of chart for growth.
targets are shown.
❓ What Do you think about my targets?
✴️ All Supports and Resistances market are in the chart .
⚠️ (This isn't a signal for buy or sell)
#️⃣ 2022 / 02 / 09
👸 Analyzed by : Parisa_Alipoor

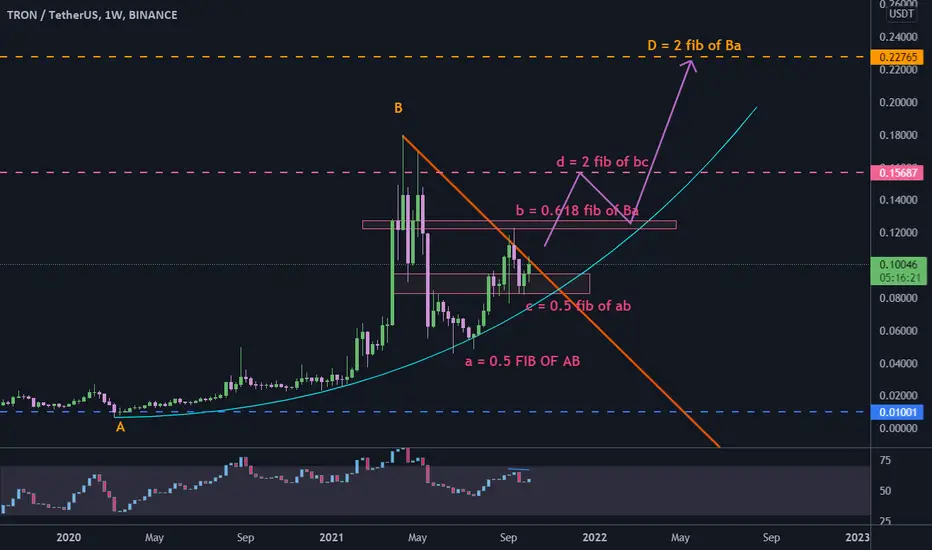
TRX ab=cd#TRXUSDT
$TRX is trading below a descending resistance line, although price hold above the support zone.
bullish scenario: breaking above the resistance line can lead price upward to touch $0.156 in midterm, and $0.22 in long term as you can see the fib ratios for AB=CD pattern.
bearish scenario: if price break down below support zone, next support is around $0.05 and then $0.01.
TRXUSDTHello friends.
Please support my study works and I will appreciate for your comments and suggestions. Thank you!
As can be seen from the chart, the trend line + order block has worked as a support line. Then we can see the beginning of the strong growth.
Now the POC line + order block that previously worked as a resistance, will work as a support.
So I expect two scenarios:
1) The weekly maximum will work as a resistance and on the retest of the POC level take a long. RR1:2
2) On the short OB take a short with RR1:5. But just wait for confirmation on the low time frame.

TRX is on the Edge of reaching 0.15$ or 0.04$ !Hello every one
TRONUSDT
🟡Chart is speaking it self!
🌳What Is TRON (TRX)?
TRON is a blockchain-based operating system that aims to ensure this technology is suitable for daily use. Whereas Bitcoin can handle up to six transactions per second, and Ethereum up to 25, TRON claims that its network has capacity for 2,000 TPS.
To learn more about this project, check out our deep dive of Tron.
This project is best described as a decentralized platform focused on content sharing and entertainment — and to this end, one of its biggest acquisitions was the file sharing service BitTorrent back in 2018.
Overall, TRON has divided its goals into six phases. These include delivering simple distributed file sharing, driving content creation through financial rewards, allowing content creators to launch their own personal tokens and decentralizing the gaming industry.
TRON is also one of the most popular blockchains for building DApps.
Thank you for seeing idea .
Have a nice day and Good luck

TRX is on the Edge of reaching 0.15$ or 0.05$ !Hi every one
TRON/USDT
TRX has formed a Symmetrical Triangle. This pattern is gonna change the price depending on the Break out which is gonna happen soon. If the break out would be bearish, we might have to see TRX at 0.05$ ( Pretty strong support) but if the break out is bullish, TRX will be able to reach 0.15$ pretty Easily. we shall wait and see what's gonna happen next!
⚪Summery:
-TRX is in a symmetrical Triangle
-Depending on the break out, there is a support at 0.05$ and a Resistance at 0.15$.
-Wait for the break out!
💎Traders, if you liked this idea or have your opinion on it, write in the comments, We will be glad.
Things can change...
The markets are always changing and even with all these signals, the market changes tend to be strong and fast!!
Thank you for seeing idea .
Have a nice day and Good luck
