TRXUSDT-SHORTThere is a short position in TRXUSDT Tron
TRXUSDT Tron
🔴Short Now or set on Key Level 0.08885
🟢Target 1 0.08420
🟢Target 2 0.08090
❌Stop loss 0.09065
#K_Level
Trxusdt


TRX break/ kırılımIts my trx setup
for normal time frame not long not early..
Not a financial advice..

TRXUSDTHello Crypto Lovers,
Mars Signals team wishes you high profits.
We are in a daily time frame.
We have drawn a support line for you that looks like a good area to buy and the price is fluctuating between a support line and a resistance line. The price can implement the reverse head and shoulder pattern and then move towards its second resistance.
It is also possible that the price will move to its first support line, then move to its second resistance after being supported, so do not rush and wait for it, to break its second resistance line and stabilize above that, then enter the trade, or wait for the price to hit the support line and being supported, then enter the trade.
Warning: This is just a suggestion and we do not guarantee profits. We advise you analyze the chart before opening any position.
Wish you luck

trxusdt330% profit in 430 days
330% profit in 430 days
330% profit in 430 days
330% profit in 430 days
330% profit in 430 days
330% profit in 430 days

TRXUSDT # 001 ( complicated chart with clear Target !!! ) Hello dear friends.
God dat day .
This is complicated chart with weekly , daily and 4HRS Gann chart .
Which all this target is defined .
Thanks for your comments & support.
Good luck & safe trade
TRXUSDT-SHORTThere is a short position in TRXUSDT TRON
TRXUSDT TRON
🔴Short Now or set on Key Level 0.08565
🟢Target 1 0.07450
❌Stop loss 0.08870
#K_Level

TRXUSDT AnalysisHello friends.
Please support my work by clicking the LIKE button(If you liked).Thank you!
Everything on the chart.
open pos: market and lower
target: 0.125 - 0.14 - 0.165
after first target reached move ur stop to breakeven
stop: under 0.082 (depending of ur risk). ALWAYS follow ur RM .
riwk/reward: 1 to 4
risk is justified
Good luck everyone!
Follow me on TRADINGView, if you don't want to miss my next analysis or signals.
It's not financial advice.
Dont Forget, always make your own research before to trade my ideas!

TRON SELLING outlook TRON following the coin leaders but in a lane of its own. this sell happen. message me to find out how my students get these set ups first on zoom.


TRXUSDT-SHORTThere is a short position in TRXUSDT TRON
TRXUSDT TRON
🔴Short Now or set on Key Level 0.09860
🟢Target 0.09280
❌Stop loss 0.10000
#K_Level

please keep it mind it is good does it want to touch the previous ceiling ??? or not??? so
risk / reward is good number for investing.

Best buy opportunity ??! BUT WHERE ?!Hey Traders,
There we go, we have nice and clear pattern on TRX and BTC so as I expected BTC will touch 48K soon so we have another bearish pattern on TRX and will touch 0.82 and lower , so there is a chance to exit in pullback ( last time it did not happen ) and there is a chance to buy in lower prices. so its depend on your strategy.
Have Fun ;;)

TRXUSDT , Buy zone activatedHello everybody
According to that last analysis of TRX we published we shown on chart the one of the main support that the price and support and rise from there
Exactly happen and the price supported in here and because of the condtion of market is better than days ago , the targets we shown on chart is ready to reach for the price
The trend is upward and we only ready to buy and take long position
If the price want to dump more the sensitive zone that the price can support in there is shown to buy it
Previous analysis :
Good Luck
Abtin

TRXUSDT AnalysisHello friends.
Please support my work by clicking the LIKE button(If you liked).Thank you!
Everything on the chart.
open pos: market and lower
target: 0.125 - 0.14 - 0.165
after first target reached move ur stop to breakeven
stop: ~0.085 (depending of ur risk). ALWAYS follow ur RM .
risk/reward 1 to 3
risk is justified
Good luck everyone!
Follow me on TRADINGView, if you don't want to miss my next analysis or signals.
It's not financial advice.
Dont Forget, always make your own research before to trade my ideas!
Will be very APPRECIATE FOR UR DONAT/coins :)
Open to your questions or suggestions(Looking for investors!).

TRXUSD Bull SentimentAn idea showing comparable points for TRXUSD (labelled a,b,c)
Bullish action is coming
Using the MavilimW indicator still, it is quite effective

TRX IS PREPARING FOR THIS HUGE MOVE...HI EVERYONE
I think this could happen for TRX as you can see on chart 0.09 is strong support and was strong resistance and that means the correction is pull back to 0.09 and after that will touch ATH and a huge move to 1$ and next 2$ very soon.
God bless you

Tron is in a good area to go long.you can have it in your watch list. after hitting the bottom of channel and an engulfing bullish candle i will enter long.
this is just my analysis and IT IS NOT A TRADING SIGNAL!

TRON, EXPECTED SCENARIO...This is my expected scenario for tron and hope you enjoy.
*Not financial advice.

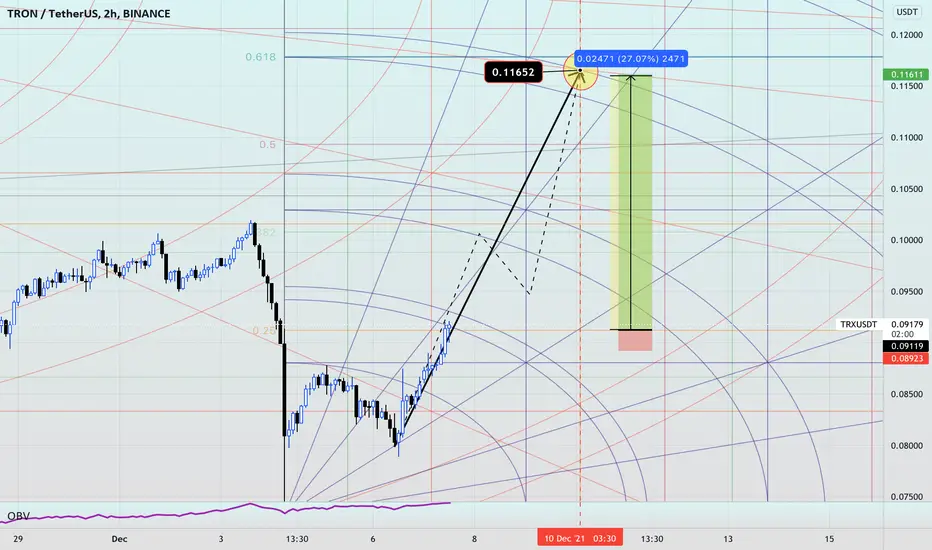
TRON - 2h TF AnalysisIn a 2-hour timeframe, The support of 0.097 is very important right now. If this support is strongly broken, then I expect it to drop to lower targets. In the $0.09 area, there is a possibility of reversing the trend. If you want to trade (Long or Short), check the price reactions in the ranges I have drawn.

TRXUSDT-SHORTThere is a short position in TRXUSDT
Futures
🔴Short Now or set on Key Level 0.10100
🟢Target 0.09200
❌Stop loss 0.10500
#K_Level


TRONTron still in bullish scenario until now. Correction on support EMA 50 TF 1D, Support Trendline and Classic Support.
Correction happen after price touch fibonacci 0.618 on price 0.12867 (swing high to swing low).
Based on fibonacci -0.272 and -0.618 target price around 0.14329 and 0.16780 (swing low to swing high). Wait for confirmation before take position.
