TESLATesla has started correction instead of impulse last week, we will expect this correction to last this week and give us reaction near 450.
Tesla Motors (TSLA)

Stock Market | TSLA NVDA AAPL AMZN META GOOGL MSFTStock Market QQQ and SPY Analysis
Mag 7 Analysis | TSLA NVDA AAPL AMZN META GOOGL MSFT

Tesla: More Room for Wave [iv]We place Tesla in a magenta upward impulse, imminently allowing wave more room on the downside. While the current extension suggests that this wave might already be complete, the necessary confirming signals are missing. Still, wave should primarily settle its low with a sufficient distance above the support at $271. A sell-off below this level, however, is 33% likely in the context of our alternative scenario. In this case, the stock would still be working on the broader correction of the blue wave alt. (II), with the gains since April 2024 considered corrective. To render this alternative scenario irrelevant, TSLA needs to stage a decisive rally above the resistance at $488.50.

MOBILEYE - A Merger & Acquisitions target! Downside limitedNASDAQ:MBLY - M&A Target 🎯🚘
Here's my thoughts of what I believe to be limited downside on Mobileye with my thesis that they could be a prime M&A target for a slew of Mega-Cap companies with the new administration pegged to be more lax in this area of business. More details in this post. 👇
I personally love Mobileye - NASDAQ:MBLY as a fundamentally undervalued company with great tech. I believe its a great investment with great technicals as well.
My thesis is that the downside is limited at this point due to this M&A realm we are about to step into here shortly.
Jensen just clarified what I had already perceived to be true which is the AV and Robotaxi market is a multi-trillion TAM over the next decade. These words alone increase any M&A price targets of any company in this space to include a robust Top 3 player such as $MBLY.
They currently sit at a 13.75B Mkt Cap after the massive 25% flush the last two days due to no new news. Not actually based off of fundamentals or the technology.
I would put a MINIMUM M&A target on this name of 15B and Maximum of 30B IMO.
A lot of big tech getting into this space and are way behind the Top 3 players in this realm of Mobileye/ NASDAQ:TSLA / NASDAQ:GOOGL (Waymo). It's obvious who would get gobbled up by a deal that is too good to resist which I believe personally is north of 20B as they are already on a solid path forward with headwinds turning into tailwinds (interest rates/ inflation/ china recovery/ auto-market recovery)
My personal theory of the companies most likely to take their shot are as follows in order:
NASDAQ:QCOM - Big chip player who is partnered with majority of legacy car brands. (Did a write-up in the past when they were thinking of acquiring/ merging with Intel in which own 80% share in Mobileye)
NASDAQ:NVDA - Announced there ambitions in this sector and have already been working within it. They've recently lost Hyundai though which tells me they aren't so close to having solid breakthroughs. But I believe they have the money and will to throw at M&A and take short-cut.
NASDAQ:GOOGL - Their robotaxis use very expensive lidars and I could see them make this purchase to get Mobileyes much cheaper technology that can be fitted to cars a lot simpler and with a cheaper price tag.
Others that I'm less confident on but have the money and could become a player: NASDAQ:META $APPL NASDAQ:AMZN
Great post Za! I hope I was able to add something for any Mobileye investors/ traders. Have a great market day off friend.
Not financial advice.

My TSLA thoughts for InaugurationMy TSLA thoughts for Inauguration.
If all things are equal, US stocks are likely going to rally till before and during the inauguration.
My entry 1: $404 SL 1: $391.7
TP 1: $440 TP 2: $465
Stay safe and don't be greedy

MOBILEYE DD - A COMPLETE UPDATE!It's been a tough two days with getting ZERO news at CES2025. Mobileye has reported news here every year for the past couple of events. Thus, no news was devastating while pouring colder water on the situation with Riskier names falling like a knife, the market overall condition being unclear, FUD setting in the markets, and people being scared of an NASDAQ:NVDA competitor. It was an avalanche of multiple criteria, all of which weren't the potential Honda deal I spoke about. Which I was wrong on and I'll admit that, but all I was doing was taking all data in front of me and created a thesis were I truly saw it happening, it didn't, oh well. My initial technical or fundamental investment thesis didn't include Honda anywhere in it when I started researching and investing in this company many months ago! I share IDEAS HERE, NOT FINANCIAL ADVICE! Only the fact that there was no deal announced at all. The CEO in a recent Bloomberg interview identified the reason the stock was falling but said:
"We are not ready with announcements, I think we'll have major announcements throughout the year but we're not ready yet" Amnon Shashua - Mobileye CEO
I don't see the NVDA news as a bad thing and people don't understand that they already had this sector of their business up and running. In which Hyunda just left them and are looking for a different supplier of AV technology. Also, Nvidia called this a multi-trillion-dollar market and validated everything I already knew. Which is this sector is going to be a massive investment opportunity. Mobileye is still Top 3 in Autonomous vehicle technology alongside Waymo and Tesla. NVDA is nowhere to be found in that conversation, and the same is to be said about AMZN, who also is in this space. It's the same thing when AMZN got into the pharma delivery market and everyone sold off HIMS to turn around and be right back in stock price in a few weeks.
These large companies do certain things really well, but they try to have their hands in too many cookie jars at once and don't invest the attention and necessary manpower to make them the best they could be or even competitive to smaller companies whose only business is in said sector!
This is 60% and investment for me and 40% trade. I'm in this for the most part, the long haul. I will only sell my 40% trade allocated position when we hit our profit targets or my strategy tells me to exit. Which leads us to the charts.
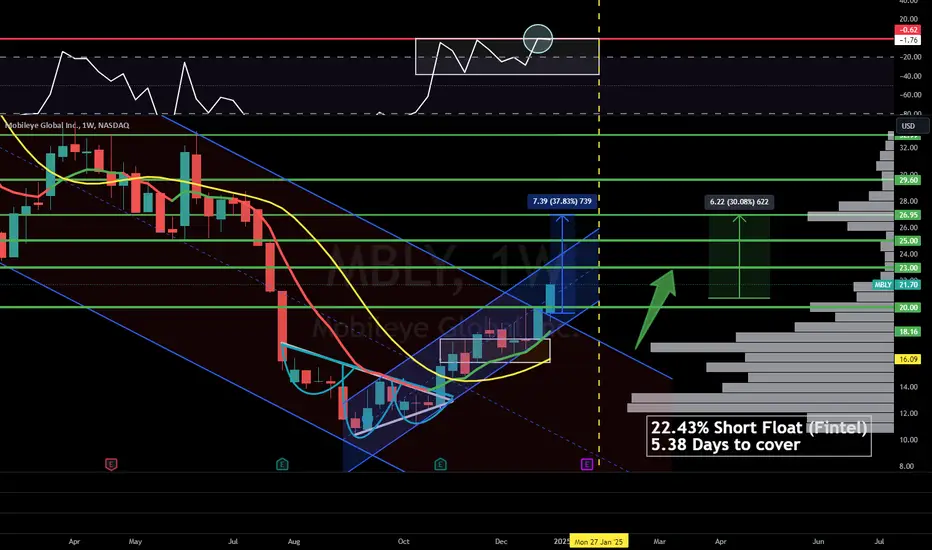
Weekly: (Chart Shown)
-H5 Indicator is still Green
-We are at a Volume shelf
-At the smoothing line (yellow) to the 9ema
-We have further support from the 25MA
-We have this DIP BUY BOX that I've called out in the past multiple time in which we've built up this area of support from all the back and forth and volume within this box.
-We had a one week red candle the like we've only seen a couple other times when things were a lot worse and unknown before earnings or when they lowered rev. guidance (THINGS ARE A LOT BETTER NOW THAN THEY WERE THEN! WE JUST DIDN'T GET NEWS YET! THATS IT!) Typically the week or weeks after we get these massive amount of sell volume we get a bounce back week or weeks.
-Finally, this name still to my knowledge pending new data has a 23% SHORT FLOAT and as such this trade of a short squeeze and parabolic move is very much still on the table!
Daily Chart:
-At the same big S?R zone
-Same large volume shelf
-In my eyes taking a breather and collecting/ rallying the troops before another run at $23
-Most importantly, when we smashed into the red barrier of the Williams percentage range (Wr%) and the 50MA on the daily and 100MA on the weekly, we rejected hard. Do we get the same bounce move when we are running into the Wr% GREEN bounce support beam? While also being extremely oversold on timeframes under the daily timeframe. Finally, being right at the volume shelf, 50MA that already did a bullish cross of the 100MA!
- We are still in an uptrend!
The fundamentals haven't changed, and based on my investing spreadsheet, which is mostly a DCF model, it's still a $30+ stock!
- Headwinds are still becoming tailwinds (Falling interest rates/ inflation, China recovering, Auto market recovering)
NOTHING HAS CHANGED BUT THE PRICE OF A STOCK TICKER!
The haters can honestly kick rocks until they realize they are in control of their own financial decisions and can THEN come back, understand this game and learn! Some said I owed them an update, which I laughed at as I DON'T OWN YOU ANYTHING! The ideas I post here are FREE, and I'm paying to be on this service, just as some of you are! Some of you really need to look in the mirror and self-reflect. I'll still help you, too, friend; I don't like to hold hate in my heart for anyone; it's unhealthy!
I'll never let the haters win or get me down! I will continue to do me with this stock and post my ideas for all of the people out there that have learned and appreciate my work! Too many great people out there that truly want to learn and become better and I will help them do that EVERY STEP OF THE WAY!
So, here is my DD Mobileye Technical and Fundamental update for all my amazing followers who aren't TOXIC! I LOVE YOU!
AS ALWAYS, NOT FINANCIAL ADVICE!

Is DOGE ready for 1.00 USD: Spoiler, it's not. BUY/HOLD 500%.🔸Hello guys, today let's review daily price chart for DOGE. Currently pullback in progress, however price chart still looks strong with sequence of higher lows.
🔸Previously we had a nice run from 8 cents to 40 cents, 500% gains. Currently, reloading getting ready for a new bull run to trigger S/R zone at 1.00 USD, however consolidation is not complete yet, more time required.
🔸Recommended strategy bulls: BUY/HOLD low at/near 0.20 in the re-accumulation range in pullback/consolidation. TP bulls is 100 cents, 500% gains possible in this trade.
🎁Please hit the like button and
🎁Leave a comment to support our team!
RISK DISCLAIMER:
Trading Futures , Forex, CFDs and Stocks involves a risk of loss.
Please consider carefully if such trading is appropriate for you.
Past performance is not indicative of future results.
Always limit your leverage and use tight stop loss.

BUY TESLA $315 AND SELL $430 Tesla has topped and now will be range bound for a long time. So , trade, do what you do best. Forget buy and hold for the next 12 months.
A sell off to $315 should be bot, and then sold at $430. Murrey, Elliot and Kumar wave being used here.

Tesla's Unhealthy Rise Could Correct Tesla's Unhealthy Rise Could Correct 🚨
Tesla has experienced a significant and rapid price rally recently, creating a potential imbalance in the market. However, this chart highlights a few key areas that traders should watch for potential corrections:
1️⃣ Gap Formation: A noticeable gap formed during the rally (highlighted on the chart). Gaps often act as magnets, and markets tend to revisit them over time. This suggests the possibility of Tesla retracing to this level.
2️⃣ Resistance Zone (~$420): The price is currently testing a resistance zone after the recent pullback. If Tesla fails to break and sustain above this level, it could trigger further bearish momentum.
3️⃣ Potential Targets:
First Target (~$360): If the bearish move begins, this level, marked as a prior area of support, could act as the next stopping point.
Second Target (~$316): A deeper correction could bring Tesla back to a more balanced price range, aligning with longer-term support zones.

Do we see TSLA below $300?This chart looks extremely bearish to me. I think everyone has become complacent to dips and that makes me worried for the downside in this one.
If we lose the $336 area, there's very little support below it. I think below that area would setup a test of the 200DMA at $244, but I'm actually worried we fall all the way back to the trend line before the next rally.
Let's see how this price action plays out in the coming weeks.

$DATS and $HOTH largest two gainers of entire stock market todayImagine two +360% vertical stocks 🚀🚀 while rest of the market crashes
Imagine no more, that was reality today!
Today's 2 trades were the hottest two stocks of the entire market
NASDAQ:HOTH and NASDAQ:DATS with buy alerts before they went up 363% and 376% on over $1 Billion USD volume each
Now you know where all the bulls went today 📈
This further proves our strategy is able to generate big wins no matter the market circumstances!
🖐️ 5 Buy Alerts - 5 Wins yesterday
✌️ 2 Buy Alerts - 2 Wins today
Perfect week so far, let's keep it going!

I just created this $300 Million dollar push in the market $HOTHOops?
Stock doubled in minutes causing huge losses to shortsellers and awesome wins to everyone who bought because of my alert
Volume went from 100 million shares to 270 million shares, stock went from $1.70 to $3.80 both within an hour 🔥
We're just getting started, shortsellers we're coming for you in 2025!

When uptrend speaks a thousand words +245% ($1.44 - $4.98) $FUBOHave you seen anything more beautiful in 2025 so far? Except a female...
When uptrend speaks a thousand words +245% from $1.44 to $4.98 with 2 Buy Alerts along the way NYSE:FUBO

$13 to $20 vertical in 90 minutes after 2 Buy Alerts $CRNCThat's the definition of Fresh Cash Friday 🤑
Early mention in $12's just minutes after market open about gap up to close into $14
Once it got there another dip buy at $13 for a double ride back up
Then once resistance was eaten out $16+ buy for $20 vertical
Whole team getting fresh cash

1/6 Weekly Watchlist + NotesIndexes - SPY had a really interesting start to the year this past week. For starters, we went 2-1-2d and hit magnitude on Thursday before seeing price retrace back through all of the weeks previous range before making new weekly highs, and closing green. We now have 1-2-2U potential on all indexes, as well as a LOT of names off my scanner. Its also worth noting that we poked through previous month lows on all indexes before seeing a reversal back into previous range. This now opens up the potential for outside months on all indexes (AKA engulfing bars) which will be evidenced by our weekly setups triggering the 1-2D-2U and targeting the previous month's midpoint on all indexes to trigger the SSS50% rule (Which essentially says when you break one side of previous range and then retrace more than 50% of the previous candles range, you are now closer to taking out that other side than you are to reclaiming the side that was already taken out. It doesn't necessarily mean price is more likely to go to the other side, but it does mean that there is less room to the other side than their is to the one side broken, which means it is fundamentally less difficult to achieve since it would require less effort from one group (in this case buyers) to reclaim one side vs the effort it would take the other group (Sellers) to reclaim the level broken already.
This week it is evident we have all the setups and evidence needed to start heading back towards ATH on the indexes, but it will depend on whether we can actually take out previous week highs, and then remain above them. Simply put, if price is above previous week highs, we are seeing an attempt to reclaim the previous weekly highs all the way up to ATH. If we break above previous highs and fail to stay above, then we are seeing a failed attempt from buyers, and we can look to target previous week lows. If inside week, we just rely on what is happening each day to see where daily participants are attempting to take price. If price is stuck inside previous week range, trade something that isn't.
The watchlist for the week will include the best bullish setups, and also looking for relative weakness in what is currently a strong market (as evidenced by the majority of stocks on all indexes being green on the previous day and week).
Bullish:
NYSE:LUV - Big hammer daily that took out a lot of daily pivots below on friday. Hammer week as well, but having mother bar issues on the week as well as M being inside despite large drawdown Friday. Sort of expecting a big move or big fail this week.
NASDAQ:AMD - Revstrat hammer week at M/Q Exhaustion level
NASDAQ:SMCI - 2-2U weekly to counter M going 2D. Daily BF looking to expand. (played this 2 weeks ago for downside, now we have evidence to go long back through range)
NYSE:NET - 3-2U W to target ATH
NASDAQ:MSFT - 2-1-2U D to trigger W hammer 2-2 to negate monthly 2-2 rev. Daily PMG as well
Bearish:
NYSE:KO - 3-1-2d shooter D, 2-1-2 W, 2-1-2 M. 3 Actionable signals that could all trigger and hit targets easily this week, if not all on Monday alone
NYSE:DG Revstrat shooter W to trigger monthly 2-2D. Nice weekly Broadening Formation
NASDAQ:DLTR - Failed 2U Week that triggered SSS50% rule. Looking to quickly drop back through previous range to take this month failed 2U to 3. DG also looking weak so slight industry support here too.
Neutral:
NASDAQ:AVGO - 2x Inside week. No daily AS, but seemingly making a new BF within the combined range of the 2 days after their recent ER. Weekly participants lacking control since then and currently showing evidence of sellers trying to take out LOD from ER gap up day. Can trade this either way since compound inside bars typically result in outside bars following.

SPX PRICE ACTION JAN05 2025Welcome to SPX weekly. I have discussed in depth price action of SPX and if you have any doubts feel free to leave a message or comment below.
NOTE:BE CAREFUL IF YOU ARE LONG

TESLANext reaction we are aiming for Tesla will be around 500+ zone if it doesn't correct here anymore.

TSLA | InfoNASDAQ:TSLA
Bullish Entry:
Buy on a break and close above $411.88 (green line).
Stop-loss: Below $407.00.
Targets: $419.18 → $430.08 → $445.58.
Bearish Entry:
Short on a break and close below $396.11 (red line).
Stop-loss: Above $400.00.
Targets: $379.45 → $373.04.
Summary
The green bullish line ($411.88) serves as a key resistance level that, if broken, could signal a bullish breakout. Conversely, the red bearish line ($396.11) acts as a critical support level that, if broken, could lead to further downside. The current price is at a pivotal level, requiring close monitoring for decisive moves above or below these lines.
*Personally based on recent price action I'm bullish. and most likely market will be bullish this week.

Unlocking the Secrets of $MBLY: Prepare for a MONSTER MOVE!NASDAQ:MBLY - A chapter out of my Book!🚘😂
MASSIVE MOVE ON FRIDAY!
What I'm seeing, we are smashing into the Red Barrier of my Williams CB strategy which means we need to peel off it! Well if we really do get that Honda news on Tuesday that only leaves Monday to have a pullback before we would have the monster move from the news then short-squeeze that week.
I've honestly never been in this predicament with a stock running into the barrier. I really believe that if we don't pullback Monday and get the Honda news on Tuesday we will bust right through this red barrier and it won't even matter which I've never seen a stock break through that red barrier before so I mean that's how BULLISH I am lol.
As far as the charts there are no other charts on this planet as SEXY as MOBILEYE!!!
Weekly chart:
- H5 is GREEN
- Broke out of downtrend and up trending with room up to $25 and I also believe we could bust through the top of this channel if we get the Honda news which will start the short squeeze! (Short Squeezes are rare and when you have them they defy gravity!)
-Williams CB is thriving
-Launched off volume shelf into volume GAP! Have room to $27 then another massive GAP!
Daily chart:
- CupnHandle Pattern breakout with successful retest
- Volume shelf launch with GAP
-Williams CB is formed and thriving
-Volume is increasing
-Massive measured move
I'M NOT KIDDING I COULD LITERALLY WRITE A DAMN BOOK ON MOBILEYE WITH HOW BULLISH I AM!
IT WILL BE CALLED THE MOBILEYE MILLIONAIRE!😂
Fundamentals are phenomenal:
-Revenues and margins troughed
-All head winds becoming tailwinds (Inflation, China, Interest rates)
2025 Price Target of $45
TA Targets:
🎯$23🎯$25🎯$27 🎯30
If you are still here reading this you better share this! 😂
Okay I have to get to other charts that's all for now on Mobileye friends!
Not financial advice
Stock Market | TSLA NVDA AAPL AMZN META GOOGL MSFTStock Market | TSLA NVDA AAPL AMZN META GOOGL MSFT

$LCID - called bottom at $2 This will be one of the best mid to long term holds!
With so much backing yet no action price wise, this is a sleeping giant.
$2-$3 is accumulation and rest is history.

SPX 2025 7000+ The most likely scenario.Experts who forecast stock market collapses and peddle narratives of financial despair often refrain from investing in the very concepts they promote; otherwise, they would face severe financial ruin on a repeated basis.
From the very beginning of this decade, I have championed a bold, risk-taking stance, predicting that these years will be remembered as the roaring 2020's, a time marked by an echo bubble of the 1920's.
This era is defined by the powerful convergence of technology, artificial intelligence, and blockchain, all propelling asset prices to new heights. The wealth generated by these colossal corporations and blockchain innovations is accumulating and concentrating, leaving behind individuals who are not part of these transformative trends.
Meanwhile, everyday people are grappling with a significant inflationary wave, as the value of their fiat currency continues to dwindle. To compound the issue, in 2024 around 150,000 workers have been laid off from giants like Tesla and Microsoft, a direct result of automation.
In this relentless struggle, machines are emerging victorious.
The age-old saying that markets lack a reason to rise but require one to fall or underperform holds particularly true, especially in the good old USA.
It’s reasonable to think that 2025 will not replicate the precise calendar movements of 2024 so it's prudent to lean towards performance tracking other years such as...
2017, the SPX return stood at 18%, marking it as the year that most closely aligns with 2025, the inaugural year of Trump's presidency.
Fast forward to 2023, where the percentage rose to 24%, making it the nearest reference point in the short term. As we are predicting a continuation of the bull market.
Meanwhile, 2021 reached a peak of 29%, representing the euphoric climax of that cyclical bull market, a scenario that could very well repeat itself in 2025.
The emerging pattern for 2025 appears to be shaped by these three pivotal years. Given that we are now nearer to the conclusion of the bull market than its inception, it seems prudent to draw insights from the trends of 2021 and 2023.

TSLA - Key Support/Bounce ZonesTSLA made a 'M' pattern which is typically seen when an asset has made a top (e.g. SPY, QQQ and BTC). Stock price has declined sharply since.
Key support zones in the short term are is between 354 and 345. This is because there is a fib retracement level of 38.2% and gap fill between 354 and 345. This is a high probability zone because this is coincides with the upper trendline of the parallel channel that started at the start of 2023 and price broke through the channel in Nov 2024 before reaching new highs. Furthermore, SMA 50 is also at 345.
Should the price pierce through 345 then there is also a secondary support zone between 320 and 312. This is because there is a fib retracement level of 50% (golden ratio) and gap fill between 320 and 312.
Remember technicals are all probabilities, price reverse and test all time highs.
