Tesla -> First Drop And Then PopHello Traders,
welcome to this free and educational multi-timeframe technical analysis .
On the weekly timeframe you can see that Tesla stock is now perfectly rejecting a quite obvious previous weekly support zone, which is now turned quite strong resistance.
However Tesla stock is also approaching a previous weekly support zone, from which we could potentially also create a right shoulder, forming an inverted head and shoulders pattern, so from a weekly perspective I do expect a retest of the $170 and then a rejection towards the upside.
On the daily timeframe you can see that market structure is currently massively bearish, but as mentioned above I am now just waiting for a retest of the previous support zone at $170 from which I also do expect a daily rejection towards the upside.
Thank you for watching and I will see you tomorrow!
You can also check out my previous analysis of this asset:
Tslaanalysis

TSLA DAY TRADE 3/7Bearish Pattern upon Bearish Patterns ... TSLA needs to Bounce between $190-$186 soon... ...if we head to $183 & do not Reclaim $186 or above... then we can see a H&S play out to take price to $170's

$TSLA - a perfect short ?TSLA showing :
1. Head & Shoulder pattern
2. At resistance
3. Forming bearish candle
4. Broke 20dma

TSLA Kangaroo Market These were charts I posted Yesterday in anticipation of end of Month Close & Investors Day.. I believe they are relevant enough to Post, Let me know how you think this plays out
Schematic#3 would be a capitulation Drop....

TSLA Kangaroo Market 3/1VIP Day for TSLA *DUMP & PUMP or PUMP & DUMP... Manipulation is Strong at these levels
This Consolidation will end soon leading to continuation break-out or distribution
Bullish Target $221.5 + Close above $224 will show Buyer Commitment
Bearish Target: Close below $197 *POC
My Patterns & Targets are on Chart
Detailed Insight from: 2/28
TESLA is currently one of if not the Strongest Stock and is helping to hold up the Markets. I believe that the Rally is close to wrapping up at this stage of the "Mark-UP" *Wyckoff Distribution"
I can see "Pump & Dump" -Final UTAD and Possible Continuation through Wednesday with Distribution.
****TSLA is BULLISH - do not mistake my bearish insights as a short confirmation *Daily Chart is very Bullish (The best moves keep going in the same direction) I
Technical/Trend/Patterns:
200 Daily MA & 0.382 Fib are psychological zones that Bulls will want to ensure TSLA gets too ..
-^Bullish double bottom pattern places TSLA move to $220-$224 area
-^Potential Island Reversal to the bullish side
BEARISH:
-Bearish Rising Wedge on Daily- if pattern completes, measured move will go to fill gap @ $147.61 (MACRO-2-3 weeks)
--Bearish Divergences are formed on lower time frames (4hr-1hr)
-Daily Bearish Divergences are looking to follow suit if a new High is made (speculation)
-OBV & Momentum indicators are diverging to the negative (OBV is High but Momentum is low -contrary)
-Price has been moving down but A/D Line continues rising *I analyze this as Higher Distribution
_____________________________
-***TIME FRAME: Analyzing consolidation patterns and impulse moves (Mark-UP) - I am seeing Consolidation on average of 25-27 days and Impulse Moves lasting 14 days
*Tesla is going to hit 27 days of consolidation on Wednesday I can foresee the Markdown Phase Beginning for 2 weeks and moving into consolidation until before next earnings in April before the Next Mark-UP
This aligns up with Seasonal Market Trends ( Bullish in Jan - Decline mid Feb to mid March)
-
Options
Current Options info: *$200 Call Option Wall
-Contrarian view is that with High Call Options @ $200 price will close below that by end of week (Market Makers do not want to pay-out) Max-Pain is currently at 197.5
-Bullish view: amount of options could create a "Gamma Squeeze" -Squeezing Tesla to test or surpass Highs in the short-term, ***Short-term pump & Dump
Weekly Expected Move: $215 High $197 Low
Positives:
-Investor Day is Hyping up the bullish trend as everyone is preparing for Elon to showcase "GEN 3" platform -a new commodity vehicle for $25-30k before mark-up. This has retail piling into TSLA stock with an enormous $200 call Option wall again..
-Berlin Higher production levels
--QQQ Potential Island Reversal to the bullish side - Help to continue Rally
Analysis: Short-Term Neutral/ Bearish (Long-Term Bullish )
My bias is Bearish with a possible pump & dump scenario in play ...
$200 Daily MA & 0.382 Fib are psychological zones that Bulls will want to ensure TSLA gets to .. If Tuesday shows strong Commitment and closes at the highs.. We could see Bullish continuation to $234.
Tomorrow is VERY CRITICAL - Monthly close above $200 shows strong buyer commitment - if there is a sell-off and we see a close below $197, I feel confident that Tsla will retrace to $145 area to fill gap ( 0.618 retracement )
Tsla Closing strong tomorrow will lead me to believe that consolidation may continue through next week until we get March Payroll Data (this puts my target price to $232-$234 before we see "Mark-Down"
*watch how TSLA reacts to Weekly Expected high at $215 area
-I am staying away from Options except for "Day-Of"
-Day Trading has been exceptional - waiting 15min after market open has proved beneficial

TESLA BUY the Rumor Sell the FactTESLA is currently one of if not the Strongest Stock and is helping to hold up the Markets. Strong Move today on Lower Volume. I believe that the Rally is close to wrapping up at this stage of the "Mark-UP" *Wyckoff Distribution"
I can see Possible Bullish Continuation through Wednesday.
Technicals/Indicators/Patterns:
$200 Daily MA & 0.382 Fib are psychological zones that Bulls will want to ensure TSLA gets too ..
-^Bullish double bottom pattern places TSLA move to $220 area
-^Potential Island Reversal to the bullish side
BEARISH:
-Bearish Rising Wedge on Daily- if pattern completes, measured move will go to fill gap @ $147.61
--Bearish Divergences are formed on lower time frames (4hr-1hr)
-Daily Bearish Divergences are looking to follow suit
-OBV & Momentum indicators are diverging to the negative (OBV is High but Momentum is contrary)
-Price has been moving down but A/D Line continues rising *I analyze this as Higher Distribution
_____________________________
-***TIME FRAME: Analyzing consolidation patterns and impulse moves (Mark-UP) - I am seeing Consolidation on average of 25-27 days and Impulse Moves lasting 14 days
*Tesla is going to hit 27 days of consolidation on Wednesday I can foresee the Markdown Phase Beginning for 2 weeks and moving into consolidation until before next earnings in April before the Next Mark-UP
This aligns up with Seasonal Market Trends (Bullish in Jan - Decline mid Feb to mid March)
-
Options
Current Options info: *$200 Call Option Wall
-Contrarian view is that with High Call Options @ $200 price will close below that by end of week (Market Makers do not want to pay-out) Max-Pain is currently at 197.5
-Bullish view: amount of options could create a "Gamma Squeeze" -Squeezing Tesla to test or surpass Highs in the short-term, ***Short-term pump & Dump
Weekly Expected Move: $215 High $197 Low
Positives:
-Investor Day is Hyping up the bullish trend as everyone is preparing for Elon to showcase "GEN 3" platform -a new commodity vehicle for $25-30k before mark-up. This has retail piling into TSLA stock with an enormous $200 call Option wall again..
-Berlin Higher production levels
--QQQ Potential Island Reversal to the bullish side - Help to continue Rally
Analysis: Short-Term Neutral/Bearish (Long-Term Bullish)
My bias is Bearish with a possible pump & dump scenario in play ...
$200 Daily MA & 0.382 Fib are psychological zones that Bulls will want to ensure TSLA gets to .. If Tuesday shows strong Commitment and closes at the highs.. We could see Bullish continuation to $234.
Tomorrow is VERY CRITICAL - Monthly close above $200 shows strong buyer commitment - if there is a sell-off and we see a close below $197, I feel confident that Tsla will retrace to $145 area to fill gap (0.618 retracement)
Tsla Closing strong tomorrow will lead me to believe that consolidation may continue through next week until we get March Payroll Data (this puts my target price to $232-$234 before we see "Mark-Down"
*watch how TSLA reacts to Weekly Expected high at $215 area
-I am staying away from Options except for "Day-Of"
-Day Trading has been exceptional - waiting 15min after market open has proved beneficial

TSLA Revised DistributionRevised Distribution - TSLA is beginning or completing final Phase of distribution, I would like to see one more Liquidity grab (UTAD) to 0.382 Fib from all time Highs ($221) , but $200 call option wall may prevent this.
I would think that today would be the day to rally past $214 and drop below $200 in order for Wall-street to make most $ from Options. ... Still we could see this pattern continue into next week before final distribution.
*Past $224 with-out strong pullback or rejection will indicate that $214 was Buying Climax- not first UT* and $187.4 was the CHoch This could put UTAD past $240 before distribution -
We will see how price reacts with retest of $214 again

$TSLA bulls keeping the TSLA alive!$TSLA holding it own this morning, keeping the momentum up just above $200 level. tesla must stay above the $190 to $200
to continue its momentum to upside. no new catalyst for tesla except the anticipation of the new tesla model 3 which still no
further announcement. also Elon Musk face class action lawsuit from shareholders, overstating the effectiveness and safety of
the company's autopilot and full self driving technologies.
below is the price level I'm looking for $TSLA:
TGT average price move per day is $7-12 per day depending on market volatility and catalyst.
Below is the price level I'm looking for entry and exit for TSLA:
Buy call above 209.26 and sell at 211.73+ or above
Buy puts below 204.17 and sell at 201.52 or below
make sure that you set up alerts on those key level so you wont miss the move.
and always to take your profits as you see one.

Tesla Time To RetraceHere Is My Study on Tesla Chart. Is To Much Extended. I Think Its Time To Retrace a Bit.
This analysis is for informational purposes only and should not be considered financial or investment advice. The information presented in this analysis is based on my own research and is subject to change without notice. The analysis is not a recommendation to buy or sell any specific cryptocurrency Stocks Or Forex, including This Pair. Please conduct your own research and consult with a financial advisor before making any investment decisions.

TSLA setting up for a pull back?$TSLA slightly pulls back after soaring for couple of weeks. this pulls back is expected and it might setting up for another pulls back or consolidate
if needs to cools off. TSLA bulls needs to hold the 190 level or bears might gain some momentum here to break below 190.
no majors news to push the TSLA except the analyst upgrade to buy rating.
TSLA average price move per day is $7-$13 per day depending on market volatility and catalyst.
Below is the price level I'm looking for entries and exit for TSLA:
Buy call above 203.31 and sell at 205.90+ or above
Buy puts below 196.61 and sell at 194.50 or below
make sure that you set up alerts on those key level so you wont miss the move.
and always to take your profits as you see one.


Why you should get out of your TESLA Long positions soon TSLA has been on the rise from the beginning of the year with a wave of optimism. It bottomed out at 104 and has risen to 218. If you were fortunate enough to get it at that price, perhaps it is time to think about closing your long as the market looks like it will come down again.
1) The Daily RSI is overbought
2) The H4 RSI is overbought
3) There is a lot of H4 RSI divergence
4) The S&P has topped out at around 4180 and heading lower
The reality of another round of rate hikes in March (Perhaps another 0.5%) has also spooked the market. Inflation isn't abating with the last one being at 6.4% which was higher than the Fed and market expected so don't be surprised if we see a few weeks of weak stock market movements.
As for me, I will go short on the stock with stop losses above 245 and aim for the 100 barrier.

Will Testa stay above 200? Hmmm...Like all stocks, also Tesla recovered strongly since the beginning of the year, and, in its case, this recovery is, in fact, a doubling of its value.
At this moment the price of Testa is 208 and, one may wonder if it will continue its rise.
Leaving aside this extreme optimism since the start of the year and getting back to Earth, there are no fundamental reasons for continuation.
Technically, this zone is very strong resistance and even considering only profit taking we will have a ceiling in this zone (100% gains in 2 months is immense as a return)
In my opinion, Tesla will roll back down, and is more probable from this point to drop to 150 than to rise to 250.

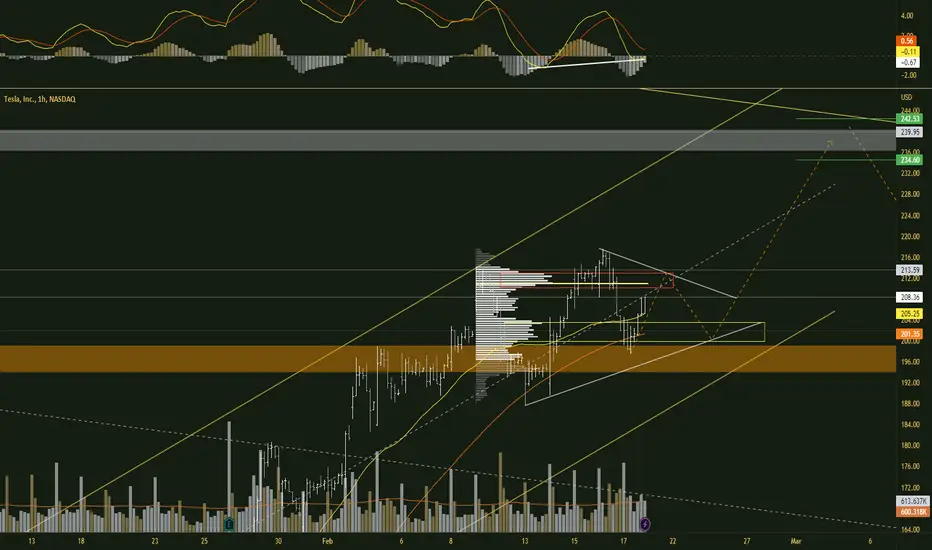
TSLA more climbs.!I see we are forming a triangle so I think a slight rise will continue (213.59)
And then it will bounce back into the momentum zone.
And I think after that the ascent is open to the top of canal,
where I expect the end of the ascent at (239.95\234.60)
Good Luck.


Continue, Pullback or Markdown PhaseI feel that TSLA is in or heading into correction. $214 pullback, continue or correction. Original Thesis was $234-$238 Correction zone with Pullbacks and gap fills before big Correction.
This would also be a great BullTrap so that Wall-street can bank on the $200 Call Options this week.
*TSLA is STRONG, The Markets have been Rallying but there are Warning signs that we are in or going into correction.
Bullish Thesis Continuation idea: this is a set-up for impulse move to $223, pullback then or continue to then $238 & gap fill with big sell-off
Lots of TSLA Events coming up which is bullish for next couple of weeks
*Pullback/Correction Idea:
Measured Moves: Extension and Retracements are matching. Extension: 2 Retracement 0.618
Date Range from capitulation event to now are equally measured.
If $215 is broken then TSLA can continue to $223 for wave 5 and correct (Bullish Final Move Idea: this is pullback for pop to $223 and pullback)
If TSLA stops here and the Markets Correct then this could be the set-up for Pullback or Correction. (possible sideways trading for next 2 weeks)
*Daily Volume is showing only Buying - Small Time frame is showing Steady Selling and Impulsive Buying with Automatic sell-off. These are signs of Wyckoff Distribution Phase. *** Pullbacks being bought up are Strong Bullish signs* but TSLA Price has Moved up only 6% in 10 days...on large volume, so distribution is happening, amount of effort to move price is becoming harder to maintain price markup...but is it in correction mode yet is the question.
TSLA can still go higher to extend Impulsive wave 5* currently Wave 3 and 5 are of equal distance which could represent end of Markup. note:I am not an Elliot Wave Expert*
Bearish Sentiment:
Greed is strong
*Seasonality- Markets tend to Drop off Mid February
Vix above 20
us 2y, us10y, dxy,vix all breaking out.
Divergence of NYSE ADV/DEC
Current Sentiment: Bearish* Drop here or possible Upthrust to $223 with Hard-sell below $200
Let me know what you think

$TSLA pull back is a bear trap?$TSLA soars after beating the eps couple weeks ago, along with the market bounce from inflation data and other news.
i think this pull back is a must to cool off after soaring almost 100$ in a month. daily chart rsi shows its over bought and
4hour chart show its entering the squeeze zone. but the momentum of tsla still looking strong for now until the higher time
frame breaks below moving average.
TSLA average price move per day is $7-$13 per day depending on market volatility and catalyst.
Below is the price level I'm looking for entries and exit for TSLA:
Buy call above 200.60 and sell at 204.90 or above
Buy puts below 192.09 and sell at 188.06 or below
make sure that you set up alerts on those key level so you wont miss the move.
and always to take your profits as you see one.

Tesla + Trade Setup
I think that this share is in an upward trend.
Currently, the ascending wave 3 has been completed and the share is in a corrective A B C trend, in this A B C wave A is completed and we are building wave B, wave C will be much bigger and faster.
Trading tip: Personally, I will trade wave c, and the return point or trading target may be a little lower than the parts specified and a candlestick with a very long shadow will be formed. As a result, I will do the opposite transaction with more patience and at the bottom of the shadow.
General conclusion: This share has a lot of growth potential and the best point of selling and exiting the entire share is as follows: 35% is at the price of 3150 and 65% is around the price of 9000 to 1000 dollars.
Warning: This analysis is valid until the previous ceiling of $410 is completely broken with a powerful candlestick. If it is not broken and the double ceiling is formed, scenario 2 will be activated, which I will definitely update at the right time.
In any case, the transaction up to the previous limit has a low risk.
Be successful and profitable.

TSLA spicing up - but important to be cautious Hi Guys thought id put out this idea.
Just for educational purposes & also my dad owns TSLA (majority of which he bought at higher levels) so i did this to see if i can advice him a bit with my limited knowledge, safeguard some of his capital.
But alot going on in my snap shot
Lets start from price action to indicators.
Firstly, in my opinion real bullishness in terms of major trend would be price action against the major red trendline that originates from Nov-2021 and ofcourse taking out previous highs. Which we are no where near.
So currently we've made huge recovery and that Red hammer candle from 1st week of Jan could be the bottom at least for now. If we close tomorrow with this engulfing candle, that would be real good.
We are however getting close to 2 major MA i follow. The 200SMA and 21EMA for longer timeframes. With how macro shapes out, ie. how the Fed moves and overall strength of broader markets like SPY, DXY, this could turn to resistance. Keep watch.
Im also liking the volume spike (last time we had these levels were in march 2021) and the decent sized wick of the hammer candle showing maybe bottom buying? That $100.00 level is a nice psychological level.
Just note, if things turn to more negative news, not much structure holding us up under $100.00 if we re-test and we could go down to $60.00
Now indcators:
1st - Is the RSI - WE bounced up from major oversold conditions and broke through our intermediate red trend line that has been bearish since 09-2022. We've moved above the MA of the RSI which is nice, if we stay above we can keep moving higher in prices, provided we make higher highs and higher lows on this indicator. We are now battling the yellow major major trendline that dates back from 11-2021. If we can confirm and it become support, thats a great sign.
2nd - MACD which is a momentum indcator. As you can see bearish momentum is decreases as shown by the yellow sloped line. AND we are getting close to a cross, if it crosses thats bullish. And adds to uptrend momentum.
3rd - Is the Stoch RSI which is also a momentum indcator - We are currently crossing above the 20 level which is indicative of bullish momentum, however we havent closed it yet. If tomorrow we are above the 20 level and we close the weekly above. That is great sign.
Conclusion:
The green highlighted area was a nice place to buy shares. If you did Kudos to you, my dad did as well to decrease his average cost. I would say however, don't be stingy. This could be an area to sell some. If i was holding i would absolutely take profit. As we must also consider overall macro situation and are still in a bear market.
This is not financial advice. I am not a financial advisor.
Hope this was insightful. Please do comment and let me know what you think. Please correct me also if theres any mistakes. As this is for educatinoal purpose. Thanks.

TSLA Re-Accumulation/DistributionTSLA price swings are signs of accumulation/distribution. Weakness in small time frame / Strength on Daily - this is either correction or liquidity grab into next move up
$190 support - Weakness under $188, $182 is LPS
*1hr support 21 EMA Resistance 8ema
*5ma Daily Support
Weekly anchored VWAP: $188
*1hr indicators are showing triple negative divergence
Powell could be the catalyst to push markets & Tesla into correction territory
*Options - $200 weekly Call Wall Wallstreet max pain will be between $188-$190 (this changes daily)
Weekly expected move: $207 high $197 low
Intraday: 2/7 (Bearish)
Trading between $198-$190 then $188-182
I was expecting an upthrust to $200-201 for a liquidity grab before correction... still possible, but 1 hr. bullishness is weakening
current bias is bearish for the short-term. *above 201.8 I can see this going to weekly highs
*Pay attention to Volume of Selling and Buying - Buying Volume is still larger* Low Volume Sell-off is a sign of re-accumulation

TSLA Opened above previous candle so I took a bullish tradeI moved my stop accordingly, the stock closed above the high from the previous candle, Got in at 10EMA bear candle closed above so i went long. I gave it the ‘newsome nudge’ after price almost hit my target but was not ‘paytient’ enough to have my holding muscle long enough. Glad i was green for the day :+1::skin-tone-4:.
2.57R:money_mouth_face: for the day.(‘if i held long enough’ i would have been up more). But I'm glad I my analysis was correct! The goal is to win more than you lose.
