$TSLA Tesla Bounced off the support line$TSLA
Has bounced off the support line and heading towards the ATH-Resistance line only if it breaks mid support.
Analysis:
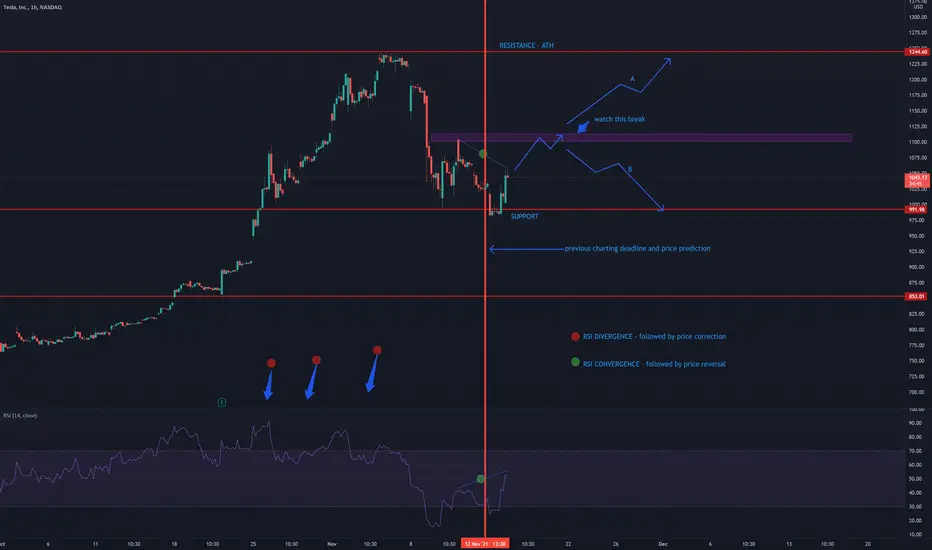
- AS PREVIOUSLY charted, by November 12th $TSLA has hit the $945 Support line.
- It has bounced off the Support line and trending higher.
- WATCH for a break. When BREAK occurs it will trend towards the ATH-Resistance levels.
- (A) IF $TSLA breaks the line it will trend higher
- (B) IF $TSLA tests the break and cannot break it will trend lower.
TAKE AWAY:
- Keep an eye for the break.
Tslaanalysis
TSLA matters a lot to the overall market Using Aspen Trading Support & Resistance Levels, a move below 978 is going to break the support and things can get ugly really quickly from that point for TSLA.
The overall market can also get impacted if the 1.2 trillion market cap of TSLA shrinks in size.
Please provide your feedback in comments if you like the analysis.
Note - Aspen Trading S/R levels are invite only. They can be accessed through my profile information.
Disclaimer: This analysis is for information purpose only and does not constitute any investment advice.

TSLA - New ATH in 3 Week or is a cold winter on tap?NASDAQ:TSLA has seen some explosive growth recently, but this week we’ve seen news of Elon selling affecting the stock along with some other events that have hurt the Nasdaq at times. What are we looking at for the foreseeable future?
Looking at the weekly chart, there are a few possible scenarios playing out:
1. A Brand New ATH
1. It looks like it could be possible that TSLA will rebound from it’s current downtrend. We’re currently sitting at what is a decision point for the asset and could see turn around as soon as next week open, or a further drop, with turn around in the $900-910 price range. A powerful bounce here could send us rocketing to a new ATH around the week of Nov 22nd. Some drop before pop would also help us in closing that window everyone is probably looking at.
2. We’re entering a cold winter
1. Will we see mass sell off? It looks like there is currently a lot of room to drop to test the main trend arc of our wave. A drop here could see us attempting to bring the RSI down to the bottom of our arc for a reset. There is a strong downward force that could see us under selling pressure well into the high $600s until late Feb. 2022. While drastic, this could be a very healthy move for the asset and allow it the space it needs to move up again properly. Keep an eye for pressure against the wall of the arcs for potential relief of further rejection down as time progresses. This scenario does align well with the Fibonacci time sequence of previous waves.
Overall trend is currently on an upwards trajectory
* This Content is for informational purposes only. You should not construe any such information or other material as investment, financial, or other advice.

TSLA Stock To Keep In Portfolio!Hello ladies and gentlemen, according to my graphical analysis of TSLA , I recommend for the moment to keep TSLA Stock in your portfolio because there is a great probability of reaching 1182$ in the next few weeks .


TSLA on CorrectionTSLA dropped after voting on twitter from MUSK, he also facing 15B tax so he planned to sell 10% stock.
By technical TSLA near support 900 for now.

#TSLA Tesla - What's next?Elon Musk is looking to sell a portion of his Tesla stock. So what will the stock look like for the upcoming days - months.
I took the prior fractal and matched it with the current market price. TSLA gets back into the channel it has been in since early 2020.
Yahoo Finance Article: finance.yahoo.com
CNBC Article: www.cnbc.com
What are your thoughts? Comment below, hit the like and follow me. Thank you!
Disclosure: This is just my opinion and not any type of financial advice. I enjoy charting and discussing technical analysis . Don't trade based on my advice. Do your own research! #cryptopickk #tesla #tsla #bitcoin #doge

Tesla to retest 1000$ for another longTesla is still bullish, and there are signs for that.
Volume is so high, and 5th wave could hit above 1400.

TSLA GAMMA SQUEEZE INITIATEDAfter nearly 6-7 months of consolidation, everything changed once TSLA broke past the critical resistance of 760 in late Sept. Targeting 1200-1250 before a pullback.
Very strong catalysts for TSLA. 1000 is a critical support leevel that could be visited again if MMs decide to take profits and drive the price down. Only other bearish factor I see is politics being involved somehow or something happens to global supply chain which is supposed to be easing up. Tesla has outperformed and managed this crisis well.

TESLA LONGTESLA looks super bullish long-term. I was surprised when premature earnings yesterday (29/04) caused 3% loss in value, however with today's daily candle it looks like TSLA is back on track. I'd wait for a break of the descending trend line for entry. Long-term outlook - 1100.
Share your thoughts!

Dude, Where's My Tesla?We touched Claire boners hoo-hoo we're on the hook for one thousand dollars to a stripper, and the car's gone.

$TSLATesla shares closed at an all-time high of $909.68 on Friday, two days after the company reported record revenue and profits in the third quarter.
The move marks the first time since January the company made an intraday record. Shares surged above $900 a share shortly after market open.
Tesla’s strong earnings results stemmed from improved gross margins of 30.5% on its automotive business and 26.6% overall. The stock dropped under 2% in after hours trading on Wednesday.
Tesla’s market cap stood at roughly $860 billion at market close.
There’s no question about it.
Tesla have an incredible future and I’m ridiculously bullish on TSLA long term but in the short term, if we’re trading we should see a slight pullback.
I think we see one more push up before shorts come in control.
It’s getting quite over extended here with it getting into the overbought territory.
I think this stock is one to watch going into next week for a swing.
Long term bullish.
Watchlist this.
- Factor Four

10/24/21 TSLATesla, Inc. ( NASDAQ:TSLA )
Sector: Consumer Durables (Motor Vehicles)
Current Price: $909.68
Breakout price trigger: $900.40 (hold above)
Buy Zone (Top/Bottom Range): $894.00-$834.00
Price Target: $1120.00-$1128.00
Estimated Duration to Target: 41-46d (1st)
Contract of Interest: $TSLA 12/17/21 1000c
Trade price as of publish date: $20.40/cnt

TSLA all time high$TSLA (TESLA) just reached all-time-high! Very bullish news especially for the stock that makes up the bulk of my portfolio. Congrats to those who followed me as well. My $TSLA portfolio is up by approximately 30% - with averaged price right below $700.
However, $TSLA is at $900 right now and RSI and bollinger bands is indicating that $TSLA is current very overbought right now. The rally came from their bullish earnings report that just got released recently: www.cnbc.com
Overall, i'm still very bullish on $TSLA and is holding it for the long run. Crypto gains might be hard to beat compared to equities but its very important to diversify and have both asset classes.

Starting of a TSLA interesting periodYesterday TSLA closed above 800$. It didn't happen since 21th february and this could mean that an interesting and volatile period is starting for it.
Since it is still moving within the channel drawn by the trend lines, this means there aren't any important daily resistances yet.
At this point the inverstor can surf this moment and make the symbol dance between the top daily trend line (like most of the times happens to the tiltes with a strong daily trend line) and the 800$ support level.

TSLA Ripping Your Face Off TSLA easy price action. If you were patient in shares don't ever sell them until it hts $3200. You can still buy shares here and be happy with a 4x. Over Fridays close we see 869. Look for some sort of cool down day. I would expect $900 by next week. BTFD in full effect now.

TSLA short soon readyHi there,
Tesla still looks bullish but price action is preparing a big bearish move to the downside, wait for wave 5 to complete to short it, or just go long with it till we near the top.
Target 400
Good luck

TSLA Stock Analysis and market prediction Hello everyone, as we all know the market action discounts everything :)
_________________________________Make sure to Like and Follow if you like the idea_________________________________
TSLA is currently trading in the upper part of its 52 week range. The S&P500 Index is also trading in the upper part of its 52 week range, so TSLA is performing more or less in line with the market.
TSLA has been doing really well for itself, The Bullish trend for the stock has started back in August and the stocks seems to be trending in a Rising wedge pattern which indicates a reversal soon but there are no signs for a breakout yet.
Both the short-term and long-term trends are positive. This is a very positive sign.
The stock is trading at 805.72 and it's nearing the resistance level located at 808.63 with a strong upward momentum which indicates a breakout of that resistance in the next day or so. This will lead the stock to have it focus on the resistance at 822.31 where the next target for the stock will be.
But we might see some pullback that could lead to a drop in value for the stock but it shouldn't be further than the support located at 784.54.
Technical indicators show :
1) The market is above the 5 10 20 50 100 and 200 MA and EMA (Strong Bullish Sign)
2) The STOCH has reached overbought zone which could indicate a small pullback. a positive crossover between %K (90.26) and %K (80.01) which indicates a Bullish move.
3) The RSI is at 68.32 showing Great strength in the market. With no divergence found between the indicator and the market
Support & Resistance points :
support Resistance
1) 770.15 1) 803.90
2) 754.81 2) 822.31
3) 736.40 3) 837.65
Fundamental point of view :
TSLA's Return On Assets of 3.90% is amongst the best of the industry. TSLA does better than the industry average Return On Assets of -0.34% and TSLA shows strong growth in Earnings Per Share. In the last year, the EPS has been growing by 172.10%, which is quite impressive.
New Caledonia's Prony Resources said on Wednesday Tesla (NASDAQ:TSLA) Inc had agreed to purchase more than 42,000 tonnes of nickel in a multi-year deal - a pact that is set to make it a key supplier of the metal to the U.S. electric car maker.
Electric vehicle makers have made securing sufficient supplies of nickel - a key ingredient in automotive batteries - a top priority and are particularly keen to seek out sustainable and low-carbon nickel supplies.
Tesla, which serves as an adviser on product and sustainability standards to Prony, also signed a deal to take supply from BHP's nickel operations in Australia earlier this year.
Prony did not disclose how many years the deal with Tesla will run for.
The automaker is expected to deploy around 30,000 tonnes of nickel in batteries this year and is likely to rapidly ramp up its nickel consumption in the coming years, said Steven Brown, a Sydney-based independent expert on battery minerals. According to Reuters
This is my personal opinion done with technical analysis of the market price and research online from Fundamental Analysts and News for The Fundamental point of view, not financial advice.
If you have any questions please ask and have a great day !!
Thank you for reading.

TSLA Short term rally targetWe have implemented the Wolfe Wave Zero-Lag indicator to Tradingview. Eighty Percent of the Waves that form and display on any time-frame we assume bullish. For example, in the chart on TSLA, there is a Bearish Wolfe Wave marked in red. So we assume a contrarian position and approach this trade as a bullish setup. If price takes out pivot 5 then tsla breaks out taking out it previous 5 day high. When using this over the weekend, the trade become easier to manage in terms of risk and reward. Holding TSLA long call positions over the weekend averages approx 58% probability of success with profit factor greater then 2.4. Our targets are usually determined using premarket gaps or fibonacci 1.272 extensions.

TESLA breaking resistance lines and moving upHello everyone, as we all know the market action discounts everything :)
_________________________________Make sure to Like and Follow if you like the idea_________________________________
TSLA has been doing great for the last couple of days the stock price jumped from 718.33 and reached 799.38 today. That is an 11% increase in 6 days.
The long and short term trends are both positive. and looking at the yearly performance, TSLA did better than 87% of all other stocks. We also observe that the gains produced by TSLA over the past year are nicely spread over this period.
Possible Scenarios for the market :
Scenario 1 :
The market is trading near 791.36 and nearing the resistance line located at 794.82 if this momentum continues then we will see a breakout from that level that will push the market up where the first stop will be at the 814.84 resistance where the Bears might step in an attempt to drop the price back to the 794.82 level. In case the Bulls were able to keep control over the trend we could be seeing the stock reaching the 849.43 level soon.
Scenario 2 :
When the market reaches the first resistance at 794.82 a battle will happen between the Bears and the Bulls to gain control over the market, In case the Bears were able to strip control from the Bulls then we will see a drop in price that will reach the first support level located at 754.36.
The bulls will step in at that level to take control again and keep the uptrend going which will lead to an increase in the stock value that will reach 794.82 again and from there breaking out and reaching the 814.84 level
Technical Indicators show :
1) The market is above the 5 10 20 50 100 and 200 MA and EMA (Strong Bullish Sign)
2) The RSI is at 69.25 showing Great strength in the market and almost reaching the overbought zone.
3) The MACD is above the 0 line indicating that the market is in a Bullish state, With a positive crossover between the MACD line and the Signal line.
Daily Support & Resistance points :
support Resistance
1) 754.36 1) 784.60
2) 734.34 2) 794.82
3) 724.12 3) 814.84
Weekly Support & Resistance points :
support Resistance
1) 737.08 1) 793.26
2) 699.76 2) 812.12
3) 680.90 3) 849.43
Fundamental point of view :
TSLA shows a strong growth in Earnings Per Share. In the last year, the EPS has been growing by 172.10%, which is quite impressive and the Altman-Z score of 16.91. This indicates that TSLA is financially healthy and has little risk of bankruptcy at the moment.
TSLA's Return On Assets of 3.90% is amongst the best of the industry. TSLA does better than the industry average Return On Assets of 0.02%.
The shift to electric vehicles will force huge changes in the auto industry and require EU backing for 'reskilling' programs to help workers prepare for a zero-emission future, according to a report published on Tuesday.
The Platform for Electromobility, an industry group, said a report by the Boston Consulting Group showed by 2030 European auto industry employment will drop by less than 1% from 5.7 million people today amid the transition to electric vehicles. according to Reuters
This is my personal opinion done with technical analysis of the market price and research online from Fundamental Analysts and News for The Fundamental point of view, not financial advice.
If you have any questions please ask and have a great day !!
Thank you for reading.

TSLA in a battle for directionToday may be the day NASDAQ:TSLA needs to make a decision. It's looking like we'll see a battle between the $820 price point and $725 with open putting us right on the 0.5 of the fib. Lets see how the day plays out!

TSLALooks short term bearish here. Would like to see daily EMA's be tested and continue to hold as support to start another 5 wave impulse towards the 1.618 around $1,000.

TSLA heavily shorted by Michael Burry!SCION ASSET MANAGEMENT, the hedge fund owned by Michael Burry - the man who bet against the housing market in 2008, if you are too young, you know him from "The Big Short", is now heavily betting against TSLA!
He owns puts on Tesla for 35% of his portfolio, with a market value of $731,017,000!
Besides the strong competition that TSLA has now in the EV sector, the U.S. National Transportation Safety Board would open an investigation into a fatal crash earlier this month involving a Tesla vehicle in Florida that led to the deaths of two people.
My first price target is 690, but it can drop even further, to 601usd.
