TESLA Potential BREAKOUT!Since the major breakout in November of last year, Tesla has been trading in a downward trend. Now we're on the verge of a possible bullish breakout. The price has been forming a triangle structure since the start of this year. As seen in the chart, TSLA has managed to break two resistance levels of the triangle pattern. We even see a re-test of the breakout on July 8th. Price also seems to be gaining momentum with three bullish candles since the re-test as well as a strong gain yesterday.
Tslaanalysis

$TSLA Does it break 700 or break down?It looks like TSLA is going to test resistance in the 689-700 range again today. This area has proven difficult to break before, but with good news yesterday does it have the power to break through? This chart contains some top level targets depending on the direction it chooses. On the 1hr chart, the MACD is showing that we may see increased bearish volume and the stoch rsi is showing to be very oversold. For these reasons i'd edge to the bearish side of things, but we'll need to see how things progress.

TSLA explodes higher into August 2021 with defined targetTSLA has been a trading like fud for the past few months and this was expected after a parabolic move in 2020. The monthly setup shows a high tight monthly darvas setup. The TOSOPTION algorithm on the monthly continues to trade long. If the upper channel of the darvas gets taken out then TSLA moves to 1126 which is our fibonacci 1.272 extension. With earnings around the corner, the price either reaches the target pre earnings run or post earnings. We have opened a series of directional contracts for July 23 800C. A close above 665.59 on July 9 would be ideal for tsla to push higher next week into July 13 and July 14.

TSLA - Gearing up for a massive bull run!-TSLA formed the 135 elliot wave and looks like we're gearing up for the wave 5 which is the next leg up.
-Gap was filled below and bounced perfectly on that .382 fib retracement
-We also have a gap above around 724 - 732 which could be the target
-Waiting for a TTM Squeeze to form on smaller timeframes.
-I'm looking at a month out expiration for options.

TSLA SIDEWAYS until August$TSLA is showing very strong support $600 levels and resistance around $700s. For my options brothers can trade Jade Alligator options strategy. try to trade next weeks expiry for max profit potential,
if you like the idea then please support by liking and sharing.
Thanks

TSLA How do you like the scenario of Tesla shares falling -80% ?Looking at the trading chart for TSLA shares, it seems to us that they are being sold.
Also, growth on falling volumes does not inspire confidence.
In the coming days, We would like to see a fall to $550 , then a rebound to the $670 area, where the further future of the price movement will be decided.
Fixing the price above $670 will pave the way for a rise to $1100.
But we are more inclined to assume that the TESLA share price wants to test the strength of the $340-350 zone first.
And after it, can be a scenario of fall down to $170-180 area for the retest. It was from there that the Covid fall of the market began in March 2020, a strong level that would be good to check for strength.

TSLA Stock To Keep In Portfolio!Hello ladies and gentlemen, according to my graphical analysis of TSLA , I recommend for the moment to keep TSLA Stock in your portfolio because there is a great probability of reaching 745$ in the next few weeks .

TSLA Is At It's Strongest Resistance!Tesla Stock came to a resistance if we look at a trend line (white line) which acted as a support/resistance since August 2020. On a daily timeframe, last candlestick showed as a rejection from the trend line and on RSI we do have a Hidden Divergence

TSLA (TESLA) TECHNICAL ANALYSIS (1DAY)CHART SHOWS A FULL BREAKDOWN OF PRICE ACTION & SCENARIOS TO BE AWARE OF
Period End Date TTM 12/31/2020 12/31/2019 12/31/2018 12/31/2017 12/31/2016 12/31/2015 12/31/2014
Period Length 12 Months 12 Months 12 Months 12 Months 12 Months 12 Months 12 Months 12 Months
Total Revenue- 35,940.00 31,536.00 24,578.00
Cost of Revenue- 28,329.00 24,906.00 20,509.00
Gross Profit- 7,611.00 6,630.00 4,069.00
Selling, General and Administrative- 3,574.00 3,145.00 2,646.00
Research and Development- 1,833.00 1,491.00 1,343.00
Unusual Expense/Income- -101.00 0.00 149.00
Total Operating Expense- 33,635.00 29,542.00 24,647.00
Operating Income- 2,305.00 1,994.00 -69.00
Interest Income Net- -779.00 -832.00 -593.00
Other Income Net- 91.00 -8.00 -3.00
Net Income Before Taxes- 1,617.00 1,154.00 -665.00
Provision for Income Taxes- 359.00 292.00 110.00
Net Income- 1,112.00 690.00 -870.00
Income Avail. to Common Excl. Extraord.- 1,112.00 690.00 -870.00
Income Avail. to Common Incl. Extraord.- 1,112.00 690.00 -870.00
Diluted Average Shares- 1,107.00 1,083.00 887.00
Diluted EPS Excl. Extraord.- 0.99232 0.63712 -0.98083
Diluted EPS Incl. Extraord.- 0.99232 0.63712 -0.9808
Insider Trading Relationship Date Transaction Cost #Shares Value ($) #Shares Total SEC Form 4
Baglino Andrew D SVP Powertrain and Energy Eng. Jun 07 Sale 587.83 903 530,814 18,997 Jun 08 08:13 PM
Taneja Vaibhav Chief Accounting Officer Jun 07 Sale 587.84 1,813 1,065,747 19,681 Jun 08 08:26 PM
Baglino Andrew D SVP Powertrain and Energy Eng. Jun 05 Option Exercise 0.00 1,786 0 19,900 Jun 08 08:13 PM
Taneja Vaibhav Chief Accounting Officer Jun 05 Option Exercise 0.00 3,668 0 21,494 Jun 08 08:26 PM
Baglino Andrew D SVP Powertrain and Energy Eng. May 27 Option Exercise 41.57 1,000 41,570 19,614 Jun 01 07:08 PM
Baglino Andrew D SVP Powertrain and Energy Eng. May 27 Sale 620.17 1,500 930,255 18,114 Jun 01 07:08 PM
Kirkhorn Zachary Chief Financial Officer May 17 Sale 575.34 1,250 719,175 54,734 May 19 07:08 PM
Guillen Jerome M President, Heavy Trucking May 10 Option Exercise 55.32 10,000 553,200 60,598 May 12 07:19 PM
Guillen Jerome M President, Heavy Trucking May 10 Sale 644.06 10,000 6,440,627 50,598 May 12 07:19 PM
Baglino Andrew D SVP Powertrain and Energy Eng. Apr 27 Option Exercise 41.57 1,000 41,570 20,114 Apr 29 08:20 PM
Baglino Andrew D SVP Powertrain and Energy Eng. Apr 27 Sale 717.17 1,500 1,075,755 18,614 Apr 29 08:20 PM
DENHOLM ROBYN M Director Apr 26 Option Exercise 52.38 62,500 3,273,750 67,500 Apr 28 09:41 PM
DENHOLM ROBYN M Director Apr 26 Sale 740.97 62,500 46,310,388 5,000 Apr 28 09:41 PM
Kirkhorn Zachary Chief Financial Officer Apr 19 Sale 718.00 1,250 897,500 55,984 Apr 21 08:23 PM
Guillen Jerome M President, Heavy Trucking Apr 12 Option Exercise 55.32 10,000 553,200 60,598 Apr 14 07:13 PM
Guillen Jerome M President, Heavy Trucking Apr 12 Sale 697.87 10,000 6,978,659 50,598 Apr 14 07:13 PM
Taneja Vaibhav Chief Accounting Officer Apr 05 Option Exercise 54.67 4,090 223,586 22,279 Apr 07 08:04 PM
Taneja Vaibhav Chief Accounting Officer Apr 05 Sale 696.57 4,453 3,101,831 17,826 Apr 07 08:04 PM
Musk Kimbal Director Apr 01 Option Exercise 74.17 12,000 890,040 611,740 Apr 05 07:51 PM
Musk Kimbal Director Apr 01 Sale 675.85 12,000 8,110,149 599,740 Apr 05 07:51 PM
Baglino Andrew D SVP Powertrain and Energy Eng. Mar 29 Option Exercise 41.57 1,000 41,570 20,614 Mar 31 07:59 PM
Baglino Andrew D SVP Powertrain and Energy Eng. Mar 29 Sale 615.75 1,500 923,625 19,114 Mar 31 07:59 PM
Kirkhorn Zachary Chief Financial Officer Mar 17 Sale 655.81 1,250 819,762 57,234 Mar 19 07:20 PM
Guillen Jerome M President, Automative Mar 10 Option Exercise 55.32 10,000 553,200 60,598 Mar 11 07:32 PM
Guillen Jerome M President, Automative Mar 10 Sale 711.30 600 426,778 50,598 Mar 11 07:47 PM
Guillen Jerome M President, Automative Mar 10 Sale 681.20 8,900 6,062,696 51,198 Mar 11 07:32 PM
Taneja Vaibhav Chief Accounting Officer Mar 08 Sale 595.08 1,844 1,097,328 18,189 Mar 09 09:05 PM
Kirkhorn Zachary Chief Financial Officer Mar 08 Sale 595.08 2,818 1,676,935 58,484 Mar 09 07:33 PM
Guillen Jerome M President, Automotive Mar 08 Sale 595.08 609 362,404 50,598 Mar 09 08:30 PM
Baglino Andrew D SVP Powertrain and Energy Eng. Mar 08 Sale 595.08 897 533,787 19,614 Mar 09 08:36 PM
Baglino Andrew D SVP Powertrain and Energy Eng. Mar 05 Option Exercise 0.00 1,785 0 20,511 Mar 09 08:36 PM
Guillen Jerome M President, Automotive Mar 05 Option Exercise 0.00 1,211 0 51,207 Mar 09 08:30 PM
Kirkhorn Zachary Chief Financial Officer Mar 05 Option Exercise 0.00 6,295 0 61,302 Mar 09 07:33 PM
Taneja Vaibhav Chief Accounting Officer Mar 05 Option Exercise 0.00 3,667 0 20,033 Mar 09 09:05 PM
Baglino Andrew D SVP Powertrain and Energy Eng. Mar 01 Option Exercise 41.57 1,000 41,570 20,226 Mar 03 08:20 PM
Baglino Andrew D SVP Powertrain and Energy Eng. Mar 01 Sale 690.11 1,500 1,035,165 18,726 Mar 03 08:20 PM
Kirkhorn Zachary Chief Financial Officer Feb 17 Sale 778.17 1,250 972,712 55,007 Feb 19 08:28 PM
Baglino Andrew D SVP Powertrain and Energy Eng. Feb 10 Option Exercise 51.64 4,000 206,560 23,226 Feb 12 09:10 PM
Guillen Jerome M President, Automotive Feb 10 Option Exercise 55.32 10,000 553,200 59,959 Feb 12 07:55 PM
Guillen Jerome M President, Automotive Feb 10 Sale 817.58 10,000 8,175,763 49,959 Feb 12 07:55 PM
Baglino Andrew D SVP Powertrain and Energy Eng. Feb 10 Sale 807.88 4,000 3,231,540 19,226 Feb 12 09:10 PM
Musk Kimbal Director Feb 09 Sale 852.12 30,000 25,563,510 599,740 Feb 10 08:20 PM
Gracias Antonio J. Director Feb 09 Sale 846.59 150,747 127,621,080 2,545 Feb 10 07:53 PM
Gracias Antonio J. Director Feb 08 Option Exercise 58.15 150,747 8,765,754 153,292 Feb 10 07:53 PM
Baglino Andrew D SVP Powertrain and Energy Eng. Jan 27 Option Exercise 41.57 1,000 41,570 20,726 Jan 28 09:15 PM
Baglino Andrew D SVP Powertrain and Energy Eng. Jan 27 Sale 870.35 1,500 1,305,525 19,226 Jan 28 09:15 PM
Kirkhorn Zachary Chief Financial Officer Jan 19 Sale 837.74 1,250 1,047,175 56,257 Jan 21 08:43 PM
Guillen Jerome M President, Automative Jan 11 Option Exercise 55.32 10,000 553,200 59,959 Jan 14 06:14 PM
Guillen Jerome M President, Automative Jan 11 Sale 833.75 10,000 8,337,533 49,959 Jan 14 07:30 PM
Taneja Vaibhav Chief Accounting Officer Jan 06 Option Exercise 54.67 4,100 224,139 20,778 Jan 08 09:56 PM
Taneja Vaibhav Chief Accounting Officer Jan 06 Sale 762.99 4,463 3,405,242 16,315 Jan 08 09:56 PM
Wilson-Thompson Kathleen Director Dec 31 Option Exercise 44.95 13,885 624,131 15,685 Jan 05 08:49 PM
Wilson-Thompson Kathleen Director Dec 31 Sale 697.57 13,885 9,685,703 1,800 Jan 05 08:49 PM
Baglino Andrew D SVP Powertrain and Energy Eng. Dec 28 Option Exercise 41.57 1,000 41,570 21,226 Dec 30 08:58 PM
Baglino Andrew D SVP Powertrain and Energy Eng. Dec 28 Sale 674.68 1,500 1,012,020 19,726 Dec 30 08:58 PM
Kirkhorn Zachary Chief Financial Officer Dec 17 Sale 628.59 1,250 785,738 57,507 Dec 21 09:12 PM
Guillen Jerome M President, Automotive Dec 10 Option Exercise 55.32 10,000 553,200 59,959 Dec 14 08:05 PM
Guillen Jerome M President, Automotive Dec 10 Sale 613.48 10,000 6,134,794 49,959 Dec 14 08:05 PM
DENHOLM ROBYN M Director Dec 07 Option Exercise 51.99 43,610 2,267,284 48,610 Dec 09 09:36 PM
DENHOLM ROBYN M Director Dec 07 Sale 609.55 43,610 26,582,465 5,000 Dec 09 09:36 PM
Kirkhorn Zachary Chief Financial Officer Dec 05 Option Exercise 0.00 6,296 0 61,920 Dec 08 07:53 PM
Guillen Jerome M President, Automotive Dec 05 Option Exercise 0.00 1,211 0 50,568 Dec 08 09:40 PM
Taneja Vaibhav Chief Accounting Officer Dec 05 Option Exercise 0.00 3,667 0 18,521 Dec 08 08:30 PM
Baglino Andrew D SVP Powertrain and Energy Eng. Dec 05 Option Exercise 0.00 1,786 0 21,123 Dec 08 08:57 PM
Wilson-Thompson Kathleen Director Nov 30 Option Exercise 44.95 12,500 561,875 14,300 Dec 02 08:51 PM
Gracias Antonio J. Director Nov 30 Buy 567.60 10 5,676 1,304,390 Apr 05 08:06 PM
Wilson-Thompson Kathleen Director Nov 30 Sale 592.99 12,500 7,412,426 1,800 Dec 02 08:51 PM
Kirkhorn Zachary Chief Financial Officer Nov 17 Sale 460.26 1,250 575,325 55,624 Nov 19 08:23 PM
DENHOLM ROBYN M Director Nov 16 Option Exercise 51.99 43,610 2,267,284 48,610 Nov 18 09:18 PM
DENHOLM ROBYN M Director Nov 16 Sale 408. 01 43,610 17,793,506 5,000 Nov 18 09:18 PM
Baglino Andrew D SVP Powertrain and Energy Eng. Nov 10 Option Exercise 48.39 600 29,034 20,437 Nov 12 09:13 PM
Baglino Andrew D SVP Powertrain and Energy Eng. Nov 10 Sale 420.00 1,100 462,000 19,337 Nov 12 09:13 PM
Wilson-Thompson Kathleen Director Oct 30 Option Exercise 44.95 12,500 561,875 14,300 Nov 03 08:56 PM
Wilson-Thompson Kathleen Director Oct 30 Sale 399.99 12,500 4,999,815 1,800 Nov 03 08:56 PM
Kirkhorn Zachary Chief Financial Officer Oct 27 Option Exercise 5.69 10,000 56,900 66,874 Oct 29 08:38 PM
Baglino Andrew D SVP Powertrain and Energy Eng. Oct 27 Option Exercise 48.39 10,000 483,900 29,837 Oct 29 09:17 PM
Baglino Andrew D SVP Powertrain and Energy Eng. Oct 27 Sale 424.60 10,000 4,245,980 19,837 Oct 29 09:17 PM
Kirkhorn Zachary Chief Financial Officer Oct 27 Sale 427.13 10,000 4,271,350 56,874 Oct 29 08:38 PM
Gracias Antonio J. Director Oct 27 Sale 424.41 155,000 65,784,227 2,545 Oct 28 08:37 PM
DENHOLM ROBYN M Director Oct 26 Option Exercise 51.99 43,610 2,267,284 48,610 Oct 28 09:12 PM
Gracias Antonio J. Director Oct 26 Option Exercise 50.54 155,000 7,833,300 157,545 Oct 28 08:37 PM
DENHOLM ROBYN M Director Oct 26 Sale 417.98 43,610 18,228,306 5,000 Oct 28 09:12 PM
Kirkhorn Zachary Chief Financial Officer Oct 19 Sale 446.24 1,250 557,800 56,874 Oct 21 08:51 PM
Baglino Andrew D SVP Powertrain and Energy Eng. Oct 12 Option Exercise 48.39 1,000 48,390 21,337 Oct 14 08:04 PM
Baglino Andrew D SVP Powertrain and Energy Eng. Oct 12 Sale 442.00 1,500 663,000 19,837 Oct 14 08:04 PM
Taneja Vaibhav Chief Accounting Officer Oct 05 Option Exercise 54.67 4,105 224,416 19,203 Oct 07 08:26 PM
Taneja Vaibhav Chief Accounting Officer Oct 05 Sale 425.17 4,404 1,872,444 14,799 Oct 07 08:26 PM
Guillen Jerome M President, Automotive Oct 01 Option Exercise 51.64 15,000 774,600 64,357 Oct 05 09:10 PM
Guillen Jerome M President, Automotive Oct 01 Sale 442.43 15,000 6,636,511 49,357 Oct 05 09:10 PM
Wilson-Thompson Kathleen Director Sep 30 Option Exercise 44.95 12,500 561,875 14,300 Oct 05 08:45 PM
Wilson-Thompson Kathleen Director Sep 30 Sale 426.97 12,500 5,337,111 1,800 Oct 05 08:45 PM
Kirkhorn Zachary Chief Financial Officer Sep 17 Sale 416.15 1,250 520,188 58,124 Sep 18 08:16 PM
Baglino Andrew D SVP Powertrain and Energy Eng. Sep 10 Option Exercise 48.39 1,000 48,390 21,837 Sep 14 08:26 PM
Baglino Andrew D SVP Powertrain and Energy Eng. Sep 10 Sale 387.44 1,500 581,160 20,337 Sep 14 08:26 PM
Taneja Vaibhav Chief Accounting Officer Sep 05 Option Exercise 0.00 3,666 0 17,324 Sep 09 08:07 PM
Baglino Andrew D SVP Powertrain and Energy Eng. Sep 05 Option Exercise 0.00 1,784 0 21,894 Sep 09 07:48 PM
Kirkhorn Zachary Chief Financial Officer Sep 05 Option Exercise 0.00 6,664 0 63,319 Sep 09 09:18 PM
Guillen Jerome M President, Automotive Sep 05 Option Exercise 0.00 1,211 0 50,074 Sep 09 09:43 PM
Musk Kimbal Director Sep 03 Option Exercise 74.17 20,375 1,511,214 638,240 Sep 03 09:26 PM
Guillen Jerome M President, Automotive Sep 01 Option Exercise 51.64 15,000 774,600


TSLA LONG on the Daily algorithmTSLA S3XY algorithm initiated a long position on the daily time-frame on June 23. The weekly signal remains neutral and if both daily and weekly are long then we have a potential price explosion for tsla that could retest and break thru $1000. Daily Long position is very bullish and likely the early signs of TSLA making another attempt to run up to $1000. Before $1000, there are three psychological levels - 700, 800 and 900. There are two time aggregation periods that suggest the price level of 700 will be taken out this week based on the famous BLT candlestick combination. These combo candlestick setup can be viewed on the 2D and 3D aggregation period. We have opened two positions and likely to continue to add more for July and august monthlies. S3XY on the 30min time frame is long and we also have a full position using common shares.


TSLA Stock To Keep In Portfolio! Hello ladies and gentlemen, according to my graphical analysis of TSLA, I recommend for the moment to keep TSLA Stock in your portfolio because there is a great probability of reaching 745$ in the next few weeks .


TSLA wedge breakout attempt on dailyI have been watching and trading TSLA for a long time and this wedge breakout is finally coming, if you take this it will move fast one way or the other, My target is at least 770 because a major peak is there, but I am very bullish on this, you can also take profit at the levels I marked in red if you want to exit before 770, this is not financial advice. I do have a position, a very big one. #tsla

TESLA- Will the Rebound be Complete?Will TESLA's supercomputer be enough to push the price back up into it's ascending channel?
We will find out soon but my chart shows great resistance coming up.
Let's see what happens.
Tell me your opinions.
the FXPROFESSOR

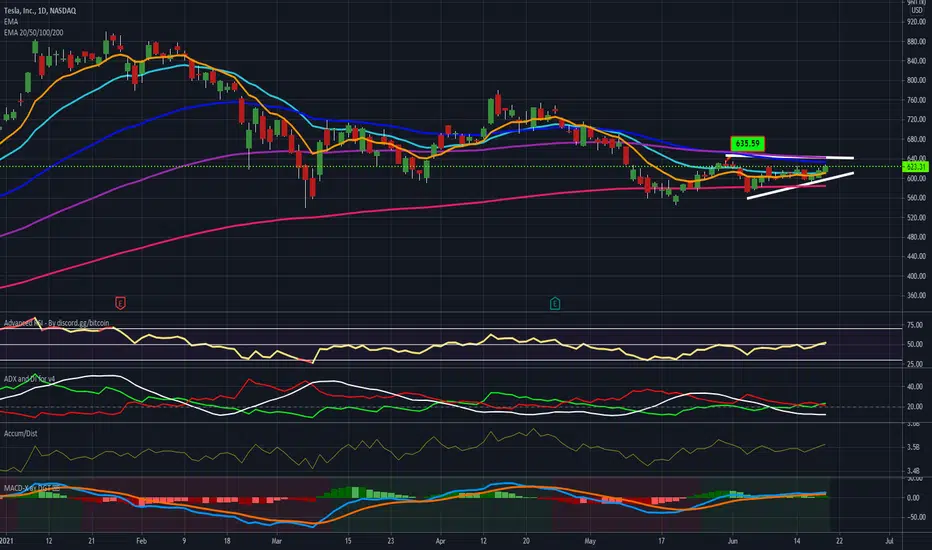
TSLATesla, Inc. (NASDAQ:TSLA) started the day negative but turned things around to close up nicely on decent volume. Keep an eye to see if it can break out above the $635.59 level next week. The stock shows signs of a trend reversal. Trajectories of momentum indicators on daily charts also suggest uptrend for the stock. Long setup on watch.
TESLA TO THE 'EARTH'S CORE' INSTEAD!With a bearish pressure despite economic recoveries ,Tesla has formed a somewhat Bearish Pennant with it's recent dip despite indexes hitting ATHs. with a level of confluence at price $621 having 38.2% retracement and 61.8% expansion ,with price $600.00 holding onto 23.6% of the retracement level ,thus giving more confidence and validation to the bearish pennant that should break out around the $575 zone and forecasts price to hit $345 price which is slightly (not entirely) below support at $400.00 also being 161.8% expansion level and not only being a classical support but numerically being the psychological price level (hence i say psychological support).
Disclaimer: All views ,opinion ,analysis shared by FX PRODiGY should not be considered as financial advice but rather a recommendation or perspective regarding financial instruments. Note that trading levaraged instruments involves risk of losing your investments

$TSLA bounce hereWhats up everyone, first time posting here. Had to get confident enough to pretend like I know what I am talking about. 🤪
So Tesla has been on a continuous downtrend since its last peak of $850-885. Many factors have played into this; including Elon Musks negative tweets on (Bitcion/Doge) overall the crypto space, and due to precious materials like lithium and the data chips inflating due to less supply... This In my opinion dropped the price, with the help of downtrend pressure, bad news just adds as a catalyst.
As of June 10th, Elon is about to surprise his awaiting investors/customers with the new car trim "Plaid" this with the addition of weekly support both vertical and horizontal on the (W) chart (red colored lines), can be a juicy catalyst setup for a good bull rally.
I am personally longing 2 contract calls expiring next Friday the 18th. What signaled me to buy in was rejection of both the weekly uptrend being used as support still and the fact that the 50 EMA was used as support as well.
Now personally I've noticed in my years of studying, that Weekly and Daily have to sing to each other and be tuned perfectly for a breakout of either side from PA if not it will range which can be way worse than just being wrong on a trend trade. As you see, Daily uptrend/downtrend are in orange, and currently we have broken out of the short term downtrend and now made a new short term uptrend. Daily has also taken back EMA 8 20 and 50 showing short term uptrend has strong momentum along with the MACD flipping green I believe we might have some space for more upside movement.
My entry for my options currently are @ $599 strike, my SL will be if any Daily lands under $590 and my TP is the 200 EMA for the (D) $635+ which on the (W) chart shows it is currently the 20 EMA and the top range of the downtrend.
This is not financial advice, just my TA on my bias for Tesla🦬
❗IMPORTANT❗
(W) Red Lines
(D) Orange Lines
(EMA 8) Blue
(EMA 20) Green
(EMA 50) Yellow
(EMA 200) Red
If you understood my TA and liked it, please give me a fat thumb and drop a comment, would really give me insight on how I'm doing, and it would really help me out alot by adding to my strategy. Markets are consistently changing its behavior so learning is abundant in this sector!

TSLA Up or Down?TSLA looks on track to reach around 660.
however, i would question whether it will break above that upper trendline.
WE have a long term reverse wedge on TSLA, which typically is a reversal signal.
If TSLA break its support, expect it to fall further to the 61% FIB level in the coming months.
TSLA TWO DAY SWING SETUPTSLA algorithm on the daily is still in a sell short position. On the 30 min time-frame, the algorithm is neutral. Last Friday, the TSLA daily candle closed green - up 4.5%. This candle is a potential setup for BLT. Friday Bacon, Monday slight green and close flat as a doji. Tuesday we expect a 5% move within the first 60mins from the open. So the ideal entry would be open a position on Monday end of day. The setup would be invalidated if the price gaps down or if the price of TSLA does not form a Doji on Monday. There is always a possibility that TSLA can run on Monday but the probability is less than 50%.
TSLA is still in a downtrend and the short term bounce is limited and we still expect TSLA to trade lower down to the gap fill at 566 and then fill the gap at 400 sometime in the month of June either Tuesday 2 hours after the open or Wednesday. Triple witching week is generally bullish but post witching week the probabilities of TSLA dropping down to 400, especially if the underlying is not trading above 566, will increase exponentially.

The Path of Least Resistance is Currently DownHello Fellow Traders,
The look of the current TSLA chart has me thinking more downside is likely. After the plunge through my $577 support line, it came back up to test that level and rejected it as resistance. Based on my S/R lines, there doesn’t look like there is much price support until the $557 level.
We saw a break of the $577 level in early March, and we dropped quickly to around $540.
We saw a break of the $577 level three times in May, each time testing and finding support around the $557 or $547 area.
I will be looking for another test of the $577 area tomorrow. If it rejects again, the $557 level will likely be in play. If there is a test and break of the $577 area, I’ll be looking toward the $596 level next to reevaluate.

TESLA INC - THE NEXT GREAT BUY OPPORTUNITY (BELOW)Technical Overview: TSLA
Simple, we want to see price sell off into our buy zone and add to our position
that's it :)
Our analysis is a sentiment for the upcoming week, month.
Use this as a weather forecast, you are the person that has to put on a jacket when it’s raining.
Trade this sentiment based off your own entry strategy at the right time.
Flow with the Devil 😈
Trade with the manipulation👾
