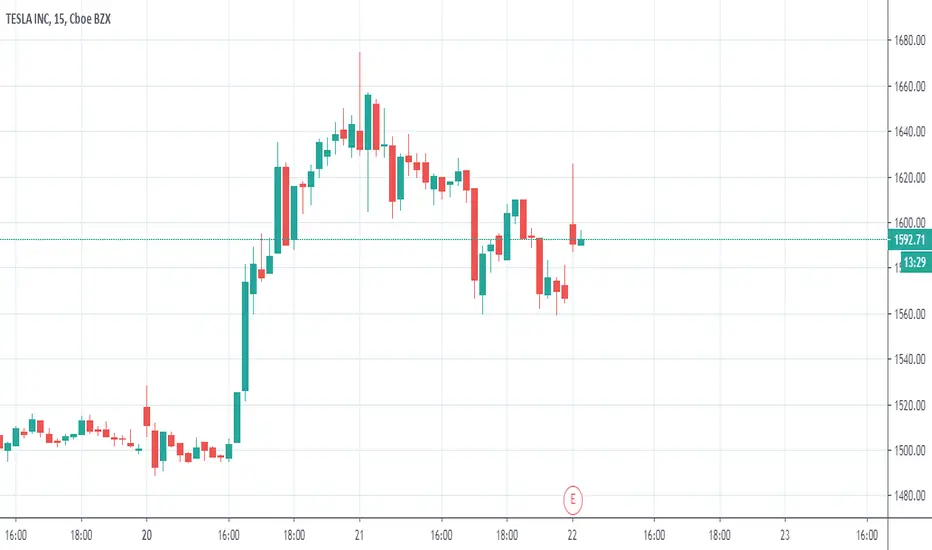
Don't Make Your Tesla Play Just Yet...3day tight compression on price after massive price impulse.
What we look for next is for the ema dots to all align red, which only the top indicator has started showing signs.
The candles are stabilizing as we approach our next move.
Neutral.
Tslaanalysis

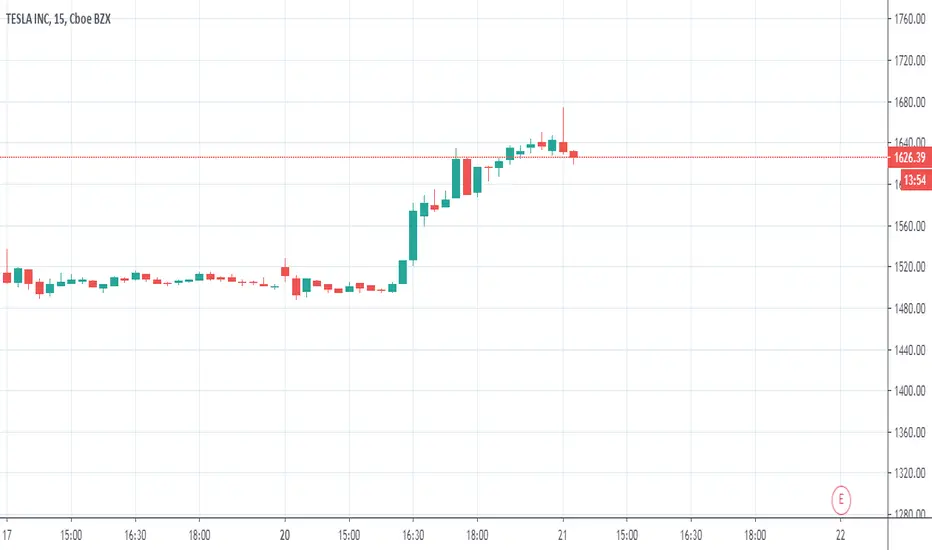
🍻 Focus In On The Next Longterm Tesla Play!2 day chart showing doji compression after an overextended move.
If you know me, you know these are the type of opportunities when I look for the next long term investment.
Daily red a cross the board on all indicators, 2 day is shifting red on the ema dots. The 15 ema dots on the bottom still trying to make its transition.
I currently have a lot of size sitting in on dow jones index short as it is playing off previous high.
The name of the game. Find the trend reversals and play with good risk management.
I believe 1432 is a good level to keep an eye on for a breakout to see how exhausted this move really is.
Best of luck.

You Choose To Make Trading Complicated... Why?You will never control where the market goes next... unless you are a market maker with very deep pockets.
Stop trying to predict where something will be in 6 months and focus on what's happening now.
Your objective as a trader is to manage risk at Distribution/Accumulation points in the markets.
Here we have a chart of tesla.
Custom Candles, Ema Dots Indicator and The Custom RSI
We leverage the candles as confirmation of what price action wants to do as of right now.
If we have strong engulfing candles we NEVER chase.
You need to manage your risk on these compression points.
What we do is focus on the compression points of doji candles as they can shift signs of indecision and potential market exhaustion.
Then we align with the ema dots and rsi for correlation to leave overbought/oversold territory to identify the next major trend.
If you can manage a tight risk on capital on the trend turning points, that is how you win.
You have to risk a little to win big.
If you enter a trend shift and don't set a stoploss and the trend goes against you... that is how a large amount of traders blow their accounts.
You need to understand to manage risk and have the correct setup to identify the best trends in the markets.
It is inevitable that you will catch the next big trend if you play the trends correctly.
Filter out most of the noise and utilize a larger timeframe. Smart money let's their assets work for them over time.


TESLA will be included in SnP500 (Bullish breakout expected)Tesla reported its fourth quarterly profit in a row Wednesday, positioning the electric-car maker as a leader in an auto sector that has struggled during the pandemic, and clearing the way for the stock to join the S&P 500. For the second quarter of 2020, Tesla made $104 million in net income on more than $6 billion in revenues. That beat forecasts by Wall Street analysts who had anticipated a loss of nearly $250 million and revenues of $5.4 billion.
Based on some calculations, approximately 20% of the outstanding Tesla stocks will have to be purchased by those index funds trailing SnP500 and they can purchase it anytime before or after SnP announces that Tesla will be included in the index.
There is also quite alot of shorts opened (people betting against Tesla) against Tesla (approx $20 billion) which means if market pumps today, those shorts trader will have to buy back some Tesla shares to exit their positions.
Therefore, i'm quite bullish on Tesla for this short period time and although it is overvalued if you look at their market cap compared to their profits, market forces in the trading market will push this stock up for the time being.

TESLA One More High & a quick reversal expected 4hrs Chart TSLATESLA - One More High and a quick reversal expected - only above 1800 it is bullish -

Scared of heights? TESLATesla up to 6k a share
Seems to be obeying Gann
Don't think its justified but speculation is a hell of a thing

Long live the king - TESLA FOR LONG - Buy Buy It's pretty clear that the market might go up to touch the target point,
And it's obvious that the TSLA activity will never stop,
Buy and feel comfortable,
Have a good golf!


DO YOU HAVE THE B#LLS TO BET AGAINST TESLA?✅In this video, we talked about Tesla.
I see a great potential in this short trade.
Take it easy.
~Bo Bugra Sukas
✌️

Analysis on Tesla Stock RallyMany people are looking at Tesla's stock currently because from March till now, within a period of 4 months, it went up approximately 5x which is rarely seen in the stock market.
Tesla is a huge company but it has never yet made profits for four quarters in a row, and thus isn’t eligible for inclusion in the S&P 500, the world’s most tracked index. If it manages to show a profit for the second quarter, then it will have passed that threshold, and the committee that oversees the S&P 500 would probably add it to the index sooner rather than later.
Tesla's market cap is currently at $275 billion. With only having less than 10% of Toyota's revenue, Tesla market cap is currently approx $50 billion higher than Toyota's. I feel Tesla is probably overvalued now and is primed for a crash soon. Think it will hit support at around $1,000 price point.


ridethepig | Tesla Island Reversal!📍 In the realm of Tesla, patience is sustained courage although the struggle for valuation is evident. The overstretched manoeuvre is identical to the struggle which we traded earlier in the year.
It is obvious for any of those that have studied the Tesla supply chain that outlooks and expectations at current valuations are unrealistic. What is surprising, is to see how the economy is coughing badly via covid, both corporates and consumers are becoming increasingly defensive in capital allocation...yet markets are pricing a mass adoption of overpriced cars.
With that recognition behind us, let us look at the deliveries for Q220 :
Model S/X 10,600
Model 3/Y 80,050
Total 90,650
============================
"While our main factory in Fremont was shut down for much of the quarter, we have successfully ramped production back to prior levels."
"Our net income and cash flow results will be announced along with the rest of our financial performance when we announce Q2 earnings. Our delivery count should be viewed as slightly conservative, as we only count a car as delivered if it is transferred to the customer and all paperwork is correct. Final numbers could vary by up to 0.5% or more. Tesla vehicle deliveries represent only one measure of the company’s financial performance and should not be relied on as an indicator of quarterly financial results, which depend on a variety of factors, including the cost of sales, foreign exchange movements and mix of directly leased vehicles."
============================
📌 This press release demonstrates how and where you can advance on expectations that are skewed the wrong way, and how complacency should be punished.
=> The lust for Tesla bulls is to expand above $1,000 ... that leaves them with another +/- 300k deliveries needed for Q3 and Q4 to keep things fundamentally interesting for the game.
=> With a second wave now a done-deal, risk is threatening to storm the battlefield. The previous Tesla crash which we traded live had sufficient preparation, here we have a long weekend and theoretically a delay in virus numbers till Tuesday of next week. Sellers can plan the attack and what makes the flows fundamentally interesting is that operations and valuations are based on no competition.
=> This powerful flow which is starting at $1,200 can be considered the starting point of the waterfall. A bold call that can be protected with stops above $1,500 while looking for another visit of the $425 fair value target.
As usual thanks for keeping the feedback coming 👍 or 👎 ... let's see if we get another home run!

TSLA SignalTSLA broke out today and is already past my goal, I took my profits, and am going to be re entering, I think TSLA will have to come back down sometime soon, because no stock only goes up... except TSLA apparently. I called my target out to the paid group chat on discord, if you would like to join, all you have to do is DM me, if you have any questions what so ever, again, just DM me.
I called this out at 1,095. And have made bank on this call.


Tesla DOWNTREND (short-term)NASDAQ:TSLA
Tesla is doing a great job delivering and producing its car during this crisys and it showed already its strenght but I think we will see a mid-term sell until the support I spotted. This should happen becouse of the too fast short-term growth of the shares of this company. I think it is a sell until it does touch the orizontal green line I spotted as a support. The Stocastic is also supporting that at this price tesla action are overbought. I personally like the way Tesla applied industry 3.0 and mecanical robot arms and even the internal production facilities but in my tecnical point of view I should wait to another support touch(will be the 3rd one) due to the too fast price growht of last weeks and due to the actual covid situation in US too and as we know Tesla is even in China and right now there is high tension between China and US. Let me know what you think about this analisys, have a good trading day!

TESLA growth analysisHello traders,
As the TESLA stock price chart shows, TSLA is taking an upward trend, the support S1 confirms that.
Since 18 Mars increase to a specific maximum point (Point A, B, and C), and then take a break to prepare for another one.
Right now, we have another increasing trend of TESLA. Two scenarios:
-- Either, it will continue to reach a new maximum, and go back down as a break. That break will be decreasing and must not be below the level “L”, in that case, we can say it’s going up again.
-- Either, it will go down below that level “L”, and in that case, we can say that this trend is ending.
Generally, we expect that it will go up, take a break by going down to bounce on a level that is higher than “L”, and go again in an increasing trend.

TSLA Call OutAlright everyone, TSLA is still in the weekly trend line, it got scary for a bit but its back on track, its showing bullish movements macd is a buy signal, RSI looks a little high, but thats alright. Also there was a good bit of Flow coming into TSLA, so that's also good.
I think we will be seeing TSLA hit $1,050 very soon, unless the feds release more bad news, then it will take a little longer.
Once again, DM me if you want to know about the trading group, or if you have any questions.
