Tesla-TSLAExcellent chance to sell. The price break of the trend, according to my analysis, you can find the entrance area by checking further, although I also marked the zone in the following picture. To notify the analysis, follow me and contact me if you have any comments or questions.
Tslaforecast

Tesla Analysis 04.12.2022Hello Traders,
welcome to this free and educational analysis.
I am going to explain where I think this asset is going to go over the next few days and weeks and where I would look for trading opportunities.
If you have any questions or suggestions which asset I should analyse tomorrow, please leave a comment below.
I will personally reply to every single comment!
If you enjoyed this analysis, I would definitely appreciate it, if you smash that like button and maybe consider following my channel.
Thank you for watching and I will see you tomorrow!
You can also check out my previous analysis:

3D daily wolfe wave setup in TESLA$TSLA The wolfe wave indicator is increasing in popularity as we continue to see more people using it and enjoying the results. There is a massive setup for a gap fill 261 which it left open in September 2022. This setup is identified in the previous post using the 2D time-frame and it is also appearing on the 3D time-frame.
The weekly setup was triggered the last week of November 25. The projected target is calculated by extending a linear line between pivot 1 and 4 and projecting the line. This is represented as the green perforated line, as shown in the chart. The projected target is around 600 with estimated time of arrival sometime last week of March 2024. Short term wise, look to target the 261 gap or 200 day ma. Long term wise, dollar cost averaging on the dips would not be a bad investment for child's education fund.

TSLA 2D wolfe wave setup into January Run up$TSLA The wolfe wave indicator is increasing in popularity as we continue to see more people using it and enjoying the results. There is a massive setup for a gap fill 261 which it left open in September 2022.
The weekly setup was triggered the last week of November 25. The projected target is calculated by extending a linear line between pivot 1 and 4 and projecting the line. This is represented as the green perforated line, as shown in the chart. The projected target is around 524 with estimated time of arrival sometime last week of January 2024. Short term wise, look to target the 261 gap or 200 day ma. Long term wise, dollar cost averaging on the dips would not be a bad investment for child's education fund.

Tesla Analysis 28.11.2022Hello Traders,
welcome to this free and educational analysis.
I am going to explain where I think this asset is going to go over the next few days and weeks and where I would look for trading opportunities.
If you have any questions or suggestions which asset I should analyse tomorrow, please leave a comment below.
I will personally reply to every single comment!
If you enjoyed this analysis, I would definitely appreciate it, if you smash that like button and maybe consider following my channel.
Thank you for watching and I will see you tomorrow!

Tsla Ive been busy with world cup :)
Ok , i think tesla is in a perfect buying area , despite the overall talk about going more down .
Its almost oversold and this maybe the last day ,
All indicators show over sold .
I DONT SELL THIS AREA AT ALL , its life opportunity to me
GOOD LUCK

Tesla Chief Twit bringing down the company to $102.85Head and Shoulders has formed on the Daily chart with Moving averages all looking down 200 > 21 > 7 .
The first target from the last analysis (ongoing) is $102.85
Bearish
Has Elon Musk Bitten off more than he can chew or are there signs he is slowly getting out of Tesla and focussing more on Twitter, Neuralink and SpaceX?
Only time will tell.

What if you could see into $tsla future? $TSLA The wolfe wave indicator is increasing in popularity as we continue to see more people using it and enjoying the results. In this monthly chart of TESLA, there was a bearish wolfe wave that started developing on November 1,2021. Last year, tesla was a very popular ticker to trade due to it's beta relationship with the market index. Moreover, hundreds if not thousands of new youtubers or existing tesla followers started covering tesla as if they actually owned or worked at the company. Even to this day, as tesla trades -58% from it's high, we continue to witness irrational exuberance in the tesla stock with recommendations of dollar cost averaging ideas floating around and long term price targets upwards of $3500 to $10,000?? Wolfe waves are great in detecting when a stock enters in bull or bear markets. It removes irrational exuberance and allows the trader to focus price and volume which are the main ingredients in determining momentum. And until the stock price reclaims at least the 6 month moving average, the price of the tsla stock will continue to sell into strength and eventually fill all the gaps it left open back in 2021 and 2020. As tesla continues to sell off and extend lower, there will be intra-day opportunities for option traders to position into long calls as shorts cover. At this point, strong volume and price action induced by positive news reports is the only thing that will get tesla out of this bear market.

TSLA Bearish Wolfe Wave lower time frame Wolfe waves are great because they help traders identify profit targets with respect to entry. They are especially useful when there is binary event such as earnings, cpi or ppi. Last week, I posted a bullish daily entry for tsla for an over the weekend tgif trade. Although TSLA dipped on monday, we were still able to buy the dip and offset some losses from Friday's entry. Post PPI, TSLA gapped approx 3% and rallied another 2% tuesday morning. Typically gaps contrarian in nature, they are bearish/bullish depending on the direction of the gap . Gaps introduce another variable which can counter trend any trade idea sooner than later. Tuesday's price action for TSLA was generally weak with respect to other tech names. Moreover, there is a bearish 78 min wolve wave + 78 ttm squeeze that has just triggered with a projected target of 175. Bullish or bearish waves on daily time frames can produce giant returns; however, the trader should take into consideration other macro events such as economic data, fed speakers , earnings and the worst of them all Jerome Powell FOMC. If the bearish wolfe wave does fails to move tsla price stock lower to 180 to 175, then the setup will likely turn into a short squeeze where the horizontal line representing the bearish stop loss will be the breakout level target.

TSLA Daily Wolfe Wave Setup and entrySimilar to SNOW, there is a daily wolfe wave setup that triggered on November 11 on the day of CPI . The projected target is calculated by extending a linear line between pivot 1 and 4 and projecting the line. This is represented as the green perforated line, as shown in the chart. Projected targets are defined by identifying the apex of the wolfe wave and projecting a vertical line toward the green perforated projection tgt which is extending from left to right. The apex of the wolfe wave extends out to 2023 but in the short term expect TSLA to move more than 10% before November 15 for a quick move to the 21 day ma.

Tesla Analysis 15.11.2022Welcome to the BasicTrading channel.
My name is Philip and in todays analysis I quickly go over the situation which we currently have on Tesla.
I will analyse the asset both from a weekly and daily timeframe to show you the best possible trading opportunities.
If you enjoyed this analysis, let me know in the comment section which asset I should analyse tomorrow.
I will personally reply to every single comment.
Dont forget to smash that rocket and I will see you tomorrow with a new analysis.

TSLA Local Short! TSLA is trading in a downtrend
Below a falling resistance
And now is going up
To retest the Resistance cluster
From where a local move down is likely

Strong Sell Signal On Tesla For Swing TradingI analyze on daily and weekly chart. Here are the list of indicators that Tesla is going down:
1. 100 SMA and 25 SMA crossover on weekly timeframe. SMA crossover is the first indicator I look for because it is the first indicator to show up.
2. Support line is being break by today's candle from the consolidation in the past month and the support from past few months. You can see my support line in color white in my chart.
3. -DI is above the ADX and the +DI is below the ADX which means it is very bearish. The slope of the ADX also counts. The higher the slope, the stronger the signal.
I'm currently looking for 130-150 for possible support. My first signal to close the position is when the -DI goes under the ADX but I will still wait for further indicators of reversal before taking profit.

TSLA Long From Support!TSLA has retested a horizontal support AT 213.00
From where we are already seeing
A bullish rebound and I think
That the move up will continue
Towards the target above !!


Tsla Its sitting at low weekly , daily , hourly
Furthermore , it has a natural earning .
I dont expect a pull run to be fair . But it can go up to 265-290 maybe test the 275
I think its in a good buying range
GOOD LUCK

I like long contracts here maybe 90 days out TSLA looked strong Scalped this am hit targets under 210. Upon seeing the strength at eod i also
picked several more for next week exp. Please feel free to express any thoughts.
📈⚡TSLA is in Buying situation!!! TSLA is in Buying situation!!!
It is searching for its previous resistance (SURELY), 80% of Probability.
And it is searching for the previous resistance (MAYBE).
The Market will show us in next days what will be happening.
So we have now at least an easy money to earn by buying now at 222.03 and taking profit at 257.10
We-are-making-money-TSLA


TSLA - Triple top formed 15 % drop (NEW)The price formed a triple top pattern.
How to trade:
- enter short only if /when the price breaks the neckline (support) with the volume increase.
- target and stop loss are shown in the chart
Last daily candle shows that sellers are still in control and more downside is likely.
Macro is bearish overall, nothing changed.
Good luck

TSLA EASY SCALPING IDEA (little risky) $$$TSLA is oversold on the RSI, and we may see a lot of buying pressure this week to close the gap we made today. Looking at previous RSI bounces, we bounced off levels 29-30 twice recently, so it is possible we bounce back when the RSI reaches around 29 - 30. Please keep in mind that my outlook on TSLA remains bearish, but it is more likely that we may see bullish price action in the short term

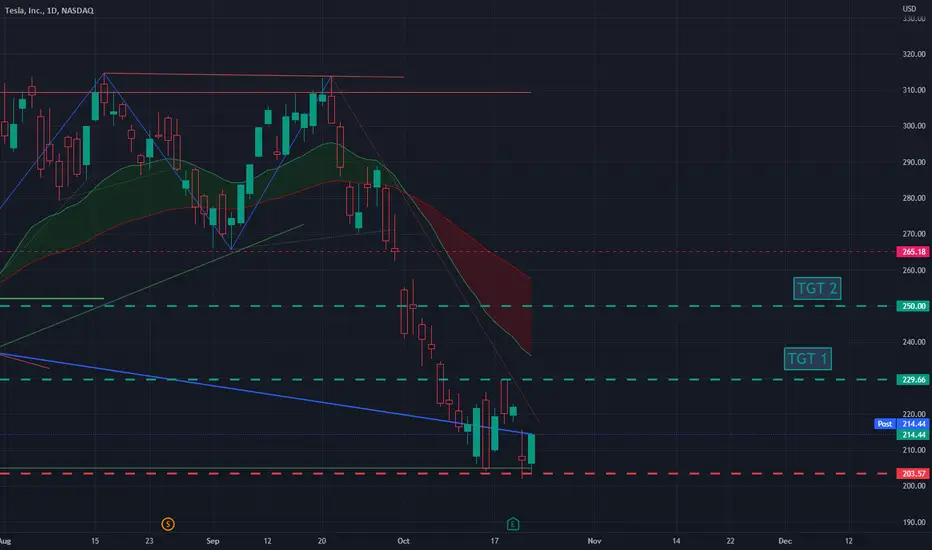
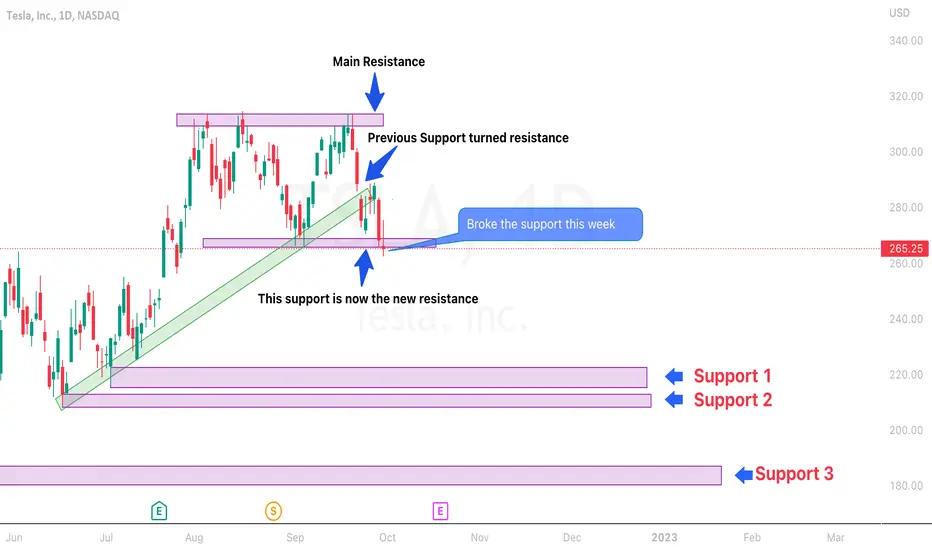
TSLA INCOMING BLOODBATH $$$As I said in my prior analysis, breaking this main support will be quite negative for TSLA, but this week we ended up finishing just below the key support that had been holding TSLA for so long, but now that we have broken it. Expect a bearish October in which we will test the next levels of support shown on the chart.
TSLA BULLISH AND BEARISH CASE SCENARIO $$$I've highlighted the critical support and resistance levels, where we see more volatility and volume. If we are able to break through that resistance, we will see bullish price action, and if we retest and see a pullback, we will see bearish price action. In both cases, you can use the support and resistance to your advantage.
