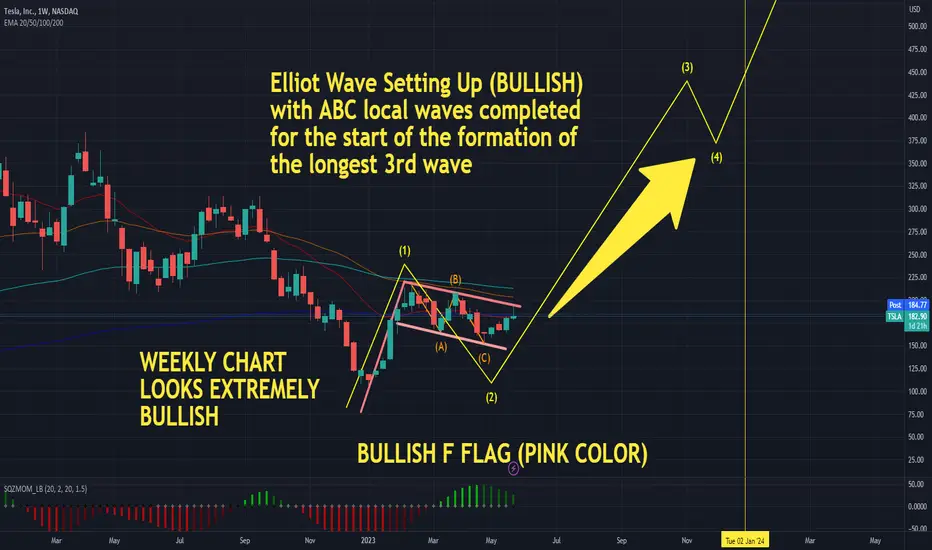
$TSLA - ELLIOT WAVE SETTING UP W/ Bull Flag Setting up This is a weekly chart of Tesla setting up with a very bullish F Flag. I applied an Elliot Wave on top which shows that its 2nd Wave is completed with ABC local waves also completed. This marks the start of a 3rd wave which is also the longest wave.
Tslalong
Tesla -> Bullish Continuation PatternHello Traders,
welcome to this free and educational multi-timeframe technical analysis .
On the weekly timeframe you can see that Tesla just recently retested and rejected a quite nice support zone at the psychological $100 area which was acting as support.
You can also see that over the past couple of weeks, Tesla has been forming a quite obvious weekly bullish flag, which is normally a continuation pattern, so I am now just waiting for a break above the resistance trendline and then I do expect another bullish rally.
On the daily timeframe you can see that Tesla yesterday retested and rejected a quite obvious previous structure level at the $190 area which was acting as resistance - I am now just waiting for a break and retest of this level before I then do expect also a daily rally towards the upside.
Thank you for watching and I will see you tomorrow!
You can also check out my previous analysis of this asset:

TSLA are you rdy for short after long?Tesla company, fraudster, man of history
A note for American shareholders, the stock of this company is on the rise, but it will see only two targets, then it will fall, and I will announce the targets.
The first target is $237.40 after the failure of this area, which will be broken because the crypto market will be bullish and Elon Musk's company's shares are in line with this market, he will see the next target and then the fall of $313.80.
After the second target, my suggestion to American shareholders is to sell Tesla shares because the price of this company is not the numbers you see.

bull flag on 2hr Chart of $tsla target $200reviewing the 2hr time frame I have a Bull Flag set up with a price target of $200.00
there is a bullish cypher set up w/ price action currently near B leg, which is currently acting as resistances. I anticipate price action to return to C leg of the bullish cypher which I have at $200.00
I've already done a weekly Technical Analysis on Tesla with a projection of $310.00, the $200.00 price target is for short term trading, but this is also a good entry point for a long term hold.
On the weekly chart, there is a Cup/handle pattern that needs to breakout above $215.. See below the weekly chart for $tsla

TSLA: Respecting FibThe past year has been so clean for TSLA in terms of respecting the fib retracement levels. The 1M and 1W MAs have also been respected.
Using the fib retracement levels starting from the bull run back in 2019 until the high in late 2021, we can easily find TSLA's support and resistance levels.
I am currently bullish on TSLA for these reasons:
- We are currently sitting at the base of 0.618 as support, moving up towards 0.5.
- The RSI has recently touched the green support Bollinger band.
- The price has gone above the 1W MA.
- There is a bull flag forming, waiting to be broken.
Technically, this is enough support for me to go long.
My price target is at 200 by June 9th, but 212 is also possible.
This is not financial advice. Please trade and invest at your own discretion. Do your own research before making investment decisions.

TSLA Support & Resistance Guide | Looking to gap fill |- TSLA looking to fill its upper gap
- if we do fill gap looking back to test 186 resistance level
- if QQQ can break to new recent highs than it TSLA will have a good chance to test 186


TSLA 65m: Intraday LevelsTSLA 65m: Intraday Levels// Higher vol and GEX in consideration leading into key econ events. Acute Bias: Neutral to risk on//KLs marked accordingly // Invalidated <158.75// Beta: 1.94, IV: 53.82%, ATR: 7.54// Price at time of publish: 164.10

Tesla -> There Is Still HopeHello Traders,
welcome to this free and educational multi-timeframe technical analysis .
On the weekly timeframe you can see that Tesla stock just recently perfectly retested and already rejected a quite obvious previous weekly structure area exactly at the HKEX:200 level.
You can also see that weekly market structure is now bearish, we are currently retesting weekly support though and there might just be a chance that we will see another bounce towards the upside from the current levels to then retest once again the resistance at the HKEX:200 area.
On the daily timeframe you can clearly see that market structure on Tesla is currently still bearish so I am now just waiting for some bullish rejection at the current support zone before we could then definitely see a daily short term rejection towards the upside.
Thank you for watching and I will see you tomorrow!
You can also check out my previous analysis of this asset:

TSLA Weekly Outlook Which Gap to Fill | NASDAQ at Key Resistance- TSLA trading in between 2 large gaps
- which gap it will fill will likely be determine by which way NASDAQ will move to
- NASDAQ & SPX closed right under Key Resistance
- if we fill the above gap then we are looking back at 186 resistance

TSLA Is Very Close To BounceTechnical Analysis:
- Tesla(TSLA) is now doing a WXY correction in blue. We expect it to be completed the wave ((2)) in the next 1~2 days
- TSLA must find the strong buyers at around HKEX:150 - $155 where we like to buy
- TSLA can't cross the green validation level in order to support higher bounce in wave 3
Tesla Right Side
- H1 right side is turning down
- H4 right side is turning up
Technical Information:
- Don't sell TSLA now
- Wait for wave ((2)) to be completed in 1~2 days to buy

$310 Target near the .618 extension reviewing TSLA weekly Chart, I can see a price target of $310.
1) First $tsla needs to get over $215
2) there was a bearish Harmonic Bat pattern that sold off from D leg, and retrace to the 1.618 fib level extension. Notice price action bounced off from that level, and formed a based untl it hit resistances .382 fb level, and currently is resting at the .236 fib level.
3) If market rallies over the next few months, and tesla closes above $215, price action is likely to retest D leg which is above the .618 extension. which I have as my target $310 area.
4) the .618 extension which is a resistances level (D leg sold off) would then become future support if the overall market is still bullish
5) there is a base formed on the weekly, the handle isn't true or confirmed. It wont be until a breakout above $215.. Many experience traders will attempt to get in front of this trade, but expect volatility
Also there is an apex forming by the AD, however it will take a few months to complete likely near end of 2023 or early 2024

$TSLA Weekly Downtrend Confirmed, $QQQ S&R Analysis - NASDAQ:TSLA broke weekly support confirmed weekly downtrend
- TSLA gap could be filled if we broke todays low of support
- NASDAQ:QQQ bounced off of megaphone pattern support still trading within
- QQQ likely break out of the range next week Tuesday 25th after big tech & MSFT reports earnings.
- Still holding onto my SOXS position
- check out my video from yesterday for big tech analysis key resistance

Tesla -> Last Chance For BullsHello Traders,
welcome to this free and educational multi-timeframe technical analysis .
On the weekly timeframe you can see that Tesla stock is actually currently rejecting a quite obvious weekly previous support/resistance area towards the downside exactly at the HKEX:200 level.
You can also see that the next major support zone is at the psychological $100 area from which we already had a strong rally a couple of weeks ago so I am now just waiting for another retest of the support zone and then I do expect another rejection towards the upside from there.
On the daily timeframe you can see that Tesla stock is retesting previous daily support at the HKEX:165 area, market structure is currently still bearish so I am just waiting for some bullish confirmation inside this zone before we could then see a short term rally towards the upside.
Thank you for watching and I will see you tomorrow!
You can also check out my previous analysis of this asset:

TSLA Earnings Report Price Action breakdown | Weekly Support |- NASDAQ:TSLA Weekly support $163.91
- currently a 15m bear flag after hours after earnings.
- now in a daily down trend
- next strong support zone in the $166s
- im currently not in the stock my after breaking out of the equilibrium (teal looking wedge) its favoring the bears at the moment.

TSLA Price Action Outlook into Earnings Wednesday AH- NASDAQ:TSLA likely trading sideways into earnings
- 186.19 area is key resistance, need to close above it.
- NASDAQ:QQQ also near resistance if it reject it will likely drag TSLA down and vice versa

Tesla -> Ready For The PumpHello Traders,
welcome to this free and educational multi-timeframe technical analysis .
On the weekly timeframe you can see that Tesla stock is about to once again retest a previous weekly support zone exactly at the HKEX:175 area.
You can also see that weekly market structure is bullish again so I am now just waiting for a deeper retest of the area before I then do expect a pump away from the support zone to retest the next resistance at $195.
On the daily timeframe you can see that Tesla stock already had a first initial rejection away from the zone, showing that there is definitely some buying pressure at the support area, so I am just waiting for a daily retest and then a rejection towards the upside.
Thank you for watching and I will see you tomorrow!
You can also check out my previous analysis of this asset:

TSLA Future Outlook | Technical Analysis | Support & Resistance - TSLA is currently in a neutral trend, sitting close to support but also right under 186.5 range resistance
- TSLA has been performing relatively weaker than QQQ as of this week.
- Earnings seasons are coming up and there's fear of earnings recession so either earnings come in normal and the fear alleviated and we get bull moves or vice versa.
- QQQ also closed right at resistance on Friday, if QQQ dont continue moving higher its going to drag TSLA down as well.

TSLA daily end of wave 5 downtrendTSLA daily end of wave 5 downtrend if we break above this bearish volume lot's of bears get trapped

THE BEAST HAS AWAKEN??NASDAQ:TSLA
When TSLA catches momentum, it really catches momentum!
- Inverse Head and Shoulders on the daily (bullish pattern)
- Clean break of psych level at 200 and held.
- Breaking above neckline around 210-211 could fuel more upside targeting resistances above: 217.65 - 223.80
- Playing long side on TSLA is valid above 200. If TSLA starts getting candle closes below 200, expect some retracements with a solid support at 187.00
Contract Suggestions:
TSLA 4/28 240 CALL (covers earnings)
TSLA 4/21 230 CALL

Tesla WEEKLY BULLISH Inverse H&S, 217.65 Key level- Bullish inverse H&S weekly time frame
- Bullish cup and handle pattern
- 217.65 break of that level will form weekly and monthly uptrend for the bulls
- delivery number will be key (i mentioned the wrong date its not this weekend)
- QQQ is very extended might see some consolidation next week which may effect TSLA as well

TSLA Break-Out & Fake-Out?Tsla has been consolidating and broke-out of a bullish bullish flag today with weak conviction ...
Bulls need to see a big volume break-out tomorrow and regain $200 as support.
*Call Wall Options may have prevented Tsla from advancing with a strong break-out
$197 is strong resistance + weekly resistance line just above @ $198 $198.84
If Tsla does not open above $198 we may see a drop to test bull flag break-out & gap-fill.
Close below $195 Tsla will consolidate until re-testing highs.
*Bulls: Tsla is above 8 ema, 20 ma & 50 ma -Cup & Handle on Daily w/ Bullish Flag Break-Out....
Dips are being bought up *APRIL is STRONG Month for Growth & Tech
Bears- Weakness compared to overall Bull Run in Tech & Markets - Selling volume has been larger on 1 hr, 4hr, daily. Markets are feeling pretty Frothy
Possible Bearish Wedge Pattern...this could be wave a of c in Correction Pattern - lack of testing or either Strong Rejection at $200 could begin wave b.
Bearish Divergence on MACD & RSI 1hr & likely forming on Daily if we see the move past $200.66
This could go Bullish or Bearish *Key Points of interest: Key Close above $198.84 / Ability to Test $200.66 & Rection off of that will give us a better Idea of where TSLA Plans to go for the next 3 weeks until next Earnings
Current Bias: Neutral to Slightly Bearish

TSLAUpdate! I gave you the bottom of TSLA at 100, but we're in need of an update. TSLA's gigarange, from its 420 highs to 100 lows has a 258 mid, which is confluent with a variety of open (unfilled) gaps in that vicinity. So long as it holds above its first quartile retracement of the gigarange (180-190 area) then I'd anticipate that it makes its way to range mid 258s.
