TSLA- MONTHLY ANALYSISFollowing the trend, I'd buy Tesla if breaks the latest high
Stop Loss - Below the latest low
1st Target - R/R = 1,00 - 1/3 Position
2nd Target - R/R = 2,00 - 1/3 Position
3rd Target - R/R = 3,00 - 1/3 Position
Tslalong

TSLA = 50 Point Day IncomingLooking for a drop tomorrow into a buy zone of 780-792 to see if we can get a nice lotto and possibly add to our current swings for March 18. Break back over and hold or a daily close over 802 looks like a test of 850 this week!

"Tsla" Weekly Cup/Handle on the Weekly?Weekly Hammer back into support - could be a cup/handle
RSI LOW - MACD in the dirt

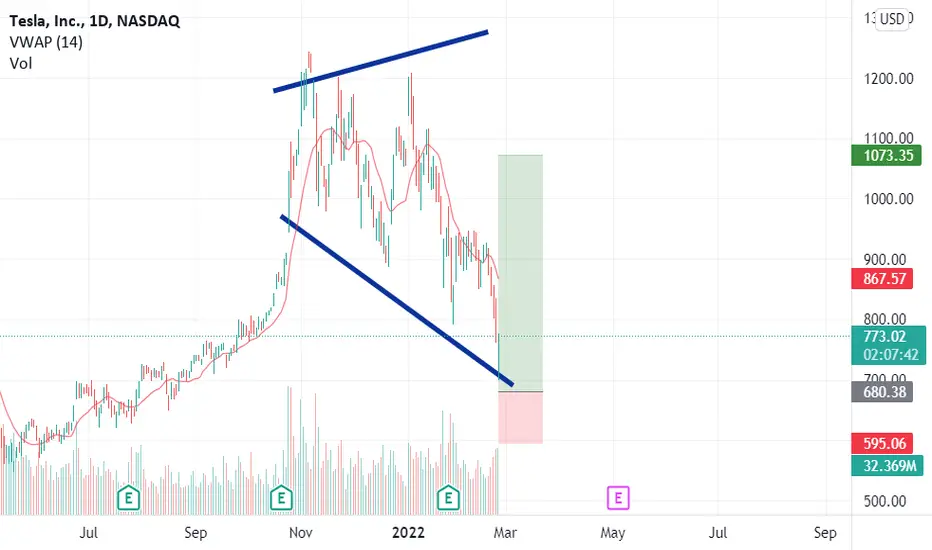
GOOD DAY TO BUY "TESLA"after the downward trend in the last 4 days today there is a big green volume and although it's so far under the VWAP and the candles is under the resistance but there is a broadening triangle and a few wedges and I think it's the end of the broadening triangle and there is an upward tendency and I think it's good time to buy although the war between the Russia and Ukraine
TSLA ALMOST DONE WITH CORRECTIONNASDAQ:TSLA
Correct me if i'm wrong but I see a flat correction soon ending into another impulse

TSLA at the edge of it's seat!TSLA's price has spent the last week whiting a range between 817-942.
The break of 817 on Friday came as the bulls exhausted gave way to Bears and rumors of War.
TSLA began its upward rally on Monday and pushed forward above the 915 resistance/support.
Will TSLA have enough to break the 950 resistance?
And even then it should not be considered completely Bullish until it claims the 980 mark.
The Bears might pile on the price if the see a clear rejection at 950 and if so they might be encouraged by the gap left behind on Tuesday premarket form 873-891.
One thing is for sure as long as TSLA continues to trade sideways above 950 the Bulls can give themselves a brief pat in the back, below 950 the Bears remain in control with an opportunity to hold the position for sometime.

TSLA: Defined Level - Watch to See It! TSLA has a defined level for this week! Watch our video to see where it is!

Tesla (TSLA) | A great opportunity to invest🎯Hello traders, Tesla in daily timeframe , this analysis has been prepared in daily timeframe but has been published for a better view in 2 day timeframe.
We preferred to do the logarithmic wave counting, but we left it out because the structure of the previous waves was not known.
Based on the count that was done and according to the channeling, we realized that the main waves 1, 2, 3 and 4 have been formed and now we are inside the 5 main wave.
From the main 5 wave, waves 1, 2 and 3 have ended, and now we are inside wave 4. At first we thought that wave 4 was zigzag, but then we reached the triangle.
This triangle corrected wave 3 more than usual and the correction continued to Fibo 0.78 and the channel floor.
We assume that this recent ascent was related to wave 1 of the main wave 5 because it has changed in terms of slope compared to the previous wave, and this trend was the correction side of wave 1, after which we will wait for the ascending trend.
If the specified limit is broken downwards, the impulse structure is probably over and we are in a higher level correction.
🙏If you have an idea that helps me provide a better analysis, I will be happy to write in the comments🙏
❤️Please, support this idea with a like and comment!❤️

TSLA to Break 1K (1030PT)TSLA is looking good for a 1K break. Perfect acceding triangle. That should push up the same height of the wedge. Price Target $1030.

TSLA LONG
945 long using 1000c near $1
980 TGT
925 STOP
Possible bear trap.
Inverse H&S 4hr.
5m held 200ema all day.
1hr testing 200ema for a breakout.
Everything is depending on CPI.

TSLA Stock Is set to EXPLODE Soon? | Must Watch Options/TAHi everyone, Technical Analysis can often be associated along with options strike analysis to help justify large moves in the markets. TSLA is currently coiling between a tight range and when it moves we have some great ideas of the next target prices.

TSLA TrendDespite the sales result in China tonight, and considering that Tesla's fundamental data is solid, and beyond the possibility of a slowdown in demand at some point, there is no doubt that this company is in financial and innovation terms super solid.
The sale of Evs is a unit in the business universe of TSLA. With this said, the technical analysis shows a clear upward trend since March 2020.
The volatility and its swing range perhaps did not allow it to be seen clearly for a moment, but now, and due to the time that has elapsed, with its financials results and congruent volume the trend It's clear, and it's on the upside.
Price zone to observe might be 880 usd, for a double reason: a) it is an important support and technical buying zone, and b) could be the limit of the upward trend.
If it loses this zone, we would be facing another scenario.
It seems to be the ideal technical chart, as the volume confirms this potential rise that is observed. That is, the price has dropped, but nobody wants to get rid of Tesla Stock, which could make it an even stronger long-term holding.
Hope you have enjoy this analysis!
This analysis is not a recommendation to buy or sell. It is based on published financial data and technical analysis. Trade at your own risk and responsibility. Namaste

Day trading idea bull case scenario Tsla has a beautiful inside candle on the daily and weekly. 15 mins makes an excellent bull case for it as well. A break of the trendline and a retest of it on the 15 mins makes me even more convinced this could hit target.

TSLA: Defined Range and Consolidating for a Bigger MoveTSLA we see is consolidating nicely in this chop and have the levels I'm watching in the video!

TSLABroke out of a downward channel and now consolidating in a diamond. Expecting a move to the upside on breakout.

Tesla - Cup and HandleTesla is a trading in a Cup and Handle pattern, bullish as long as it continues to trade within the current channel. Institutions shaking out retail to buy shares at lower price.

TSLA - Looking Forward to OPEXTSLA is basing between 800 - 1000 and is looking good for a play to the upside in the coming weeks. Buying between 800-850 is ideal for both shares and options (with time into OPEX) it is starting to look like from our perpsective. Looking for another test of 800 next week where it may be a good idea to long at this juncture.

Tesla reversal to over 1100 soonwill move up to reach 1100 if it keeps the momentum
or down to 800 support level then head back up to 1100.

Tesla: Earnings Coming! Tesla - Short Term - We look to Buy at 900 (stop at 847)
Posted a Bullish Hammer Bottom on the Daily chart. Previous support located at 900. Trading within a Bullish Channel formation. Expect trading to remain mixed and volatile. 900 continues to hold back the bears. Offers ample risk/reward to buy at the market.
Our profit targets will be 1112 and 1190
Resistance: 1000 / 1100 / 1200
Support: 900 / 850 / 800
Telsa is due to report earnings on the 26th January 2022. Trading over earnings releases carries additional risk and volatility is expected.
Disclaimer – Saxo Bank Group. Please be reminded – you alone are responsible for your trading – both gains and losses. There is a very high degree of risk involved in trading. The technical analysis, like any and all indicators, strategies, columns, articles and other features accessible on/though this site (including those from Signal Centre) are for informational purposes only and should not be construed as investment advice by you. Such technical analysis are believed to be obtained from sources believed to be reliable, but not warrant their respective completeness or accuracy, or warrant any results from the use of the information. Your use of the technical analysis, as would also your use of any and all mentioned indicators, strategies, columns, articles and all other features, is entirely at your own risk and it is your sole responsibility to evaluate the accuracy, completeness and usefulness (including suitability) of the information. You should assess the risk of any trade with your financial adviser and make your own independent decision(s) regarding any tradable products which may be the subject matter of the technical analysis or any of the said indicators, strategies, columns, articles and all other features.
Please also be reminded that if despite the above, any of the said technical analysis (or any of the said indicators, strategies, columns, articles and other features accessible on/through this site) is found to be advisory or a recommendation; and not merely informational in nature, the same is in any event provided with the intention of being for general circulation and availability only. As such it is not intended to and does not form part of any offer or recommendation directed at you specifically, or have any regard to the investment objectives, financial situation or needs of yourself or any other specific person. Before committing to a trade or investment therefore, please seek advice from a financial or other professional adviser regarding the suitability of the product for you and (where available) read the relevant product offer/description documents, including the risk disclosures. If you do not wish to seek such financial advice, please still exercise your mind and consider carefully whether the product is suitable for you because you alone remain responsible for your trading – both gains and losses.

$TSLA PRICE REVERSAL AREASwe bounced from our ascending line , if the market continue to correct , the next support shoals be at 777$, if we didn't hold above our current ascending line .

$TSLA - Bullish Pennant Inverse Head and ShoulderChart looks like a pennant is forming with a bullish Inverse Head and Shoulder. Right Shoulder is forming to an imminent breakout.

Tesla (TSLA) | A great opportunity to invest🎯Hello traders, Tesla in daily timeframe , this analysis has been prepared in daily timeframe but has been published for a better view in 2 day timeframe.
We preferred to do the wave counting logarithmically, but because the structure of the previous waves was not clear, we left it out.
Based on the count that was done and according to the channeling, we realized that waves 1, 2, 3 and 4 have been completed and now we are inside wave 5.
Wave 5 created its first microwave by breaking the purple channel ceiling, and now the correction is related to wave 2.
And Wave 2 will probably have a lower descent than its previous floor.
Wave 2 is expected to correct wave 2 more than the 980 range, at least around this price, and after wave 2, wave 3 will move as much as wave 1.
It can be said that due to the motion of wave 1, wave 4 will do more correction than the end of wave 1, so wave 5 will probably form a leading triangle.
If the 980 price is completely broken, the structure will change.
🙏If you have an idea that helps me provide a better analysis, I will be happy to write in the comments🙏
❤️Please, support this idea with a like and comment!❤️

TSLA: All Eyez On MeWatching the 50EMA for a bounce tomorrow and a generally green day for the market. If no bounce, short back to 1000 and then let the market take it below 980 if it wants. Any hold/open above the 50D is a long for me. Target 1116 if scenario plays out.
