A bright spot in a sea of red$TSLA continues to act extremely well despite the overall weakness in the markets. It announces delivery numbers on Friday. For today, see if ti can build above 780 before reaching the next resistance spots at 795 and 799. 765 should provide ample support. We are long $780 calls for this week. If $TSLA gets sold as well, expect the selling pressure to intensify in the markets.
Tslalong

TESLA breaking resistance lines and moving upHello everyone, as we all know the market action discounts everything :)
_________________________________Make sure to Like and Follow if you like the idea_________________________________
TSLA has been doing great for the last couple of days the stock price jumped from 718.33 and reached 799.38 today. That is an 11% increase in 6 days.
The long and short term trends are both positive. and looking at the yearly performance, TSLA did better than 87% of all other stocks. We also observe that the gains produced by TSLA over the past year are nicely spread over this period.
Possible Scenarios for the market :
Scenario 1 :
The market is trading near 791.36 and nearing the resistance line located at 794.82 if this momentum continues then we will see a breakout from that level that will push the market up where the first stop will be at the 814.84 resistance where the Bears might step in an attempt to drop the price back to the 794.82 level. In case the Bulls were able to keep control over the trend we could be seeing the stock reaching the 849.43 level soon.
Scenario 2 :
When the market reaches the first resistance at 794.82 a battle will happen between the Bears and the Bulls to gain control over the market, In case the Bears were able to strip control from the Bulls then we will see a drop in price that will reach the first support level located at 754.36.
The bulls will step in at that level to take control again and keep the uptrend going which will lead to an increase in the stock value that will reach 794.82 again and from there breaking out and reaching the 814.84 level
Technical Indicators show :
1) The market is above the 5 10 20 50 100 and 200 MA and EMA (Strong Bullish Sign)
2) The RSI is at 69.25 showing Great strength in the market and almost reaching the overbought zone.
3) The MACD is above the 0 line indicating that the market is in a Bullish state, With a positive crossover between the MACD line and the Signal line.
Daily Support & Resistance points :
support Resistance
1) 754.36 1) 784.60
2) 734.34 2) 794.82
3) 724.12 3) 814.84
Weekly Support & Resistance points :
support Resistance
1) 737.08 1) 793.26
2) 699.76 2) 812.12
3) 680.90 3) 849.43
Fundamental point of view :
TSLA shows a strong growth in Earnings Per Share. In the last year, the EPS has been growing by 172.10%, which is quite impressive and the Altman-Z score of 16.91. This indicates that TSLA is financially healthy and has little risk of bankruptcy at the moment.
TSLA's Return On Assets of 3.90% is amongst the best of the industry. TSLA does better than the industry average Return On Assets of 0.02%.
The shift to electric vehicles will force huge changes in the auto industry and require EU backing for 'reskilling' programs to help workers prepare for a zero-emission future, according to a report published on Tuesday.
The Platform for Electromobility, an industry group, said a report by the Boston Consulting Group showed by 2030 European auto industry employment will drop by less than 1% from 5.7 million people today amid the transition to electric vehicles. according to Reuters
This is my personal opinion done with technical analysis of the market price and research online from Fundamental Analysts and News for The Fundamental point of view, not financial advice.
If you have any questions please ask and have a great day !!
Thank you for reading.

TSLA aka TESLA Trading IdeaG'day Guys
Another week of trading.
Today we going to start our week with STOCK trading. TESLA stock is one of the favourite stocks worldwide. Since the recent release of CyberTruck, this stock gaining a lot of attention and investor have started to pumping their cash.
Technically, I see healthy uptrend momentum created. Perhaps we going to see some profit-taking taking place which is normal for investors to liquidate their investment into hard cash. I expecting a price to form a correction to complete the market structure between 765.40 and 721.15 before the uptrend rally continued.
As everyone sees on the chart, the crucial support level at 721.15 is considered as a decision level to step out or making another buy order to leverage the previous order. This is my personal overview of this stock, the decision in your hand. Managing a risk combine with your trading plan will create consistency in the trading world.
Let's see what gonna happens next. Dance with the Market mate. Cheers

TESLA a break above 775Shares closed 2.75% higher to 774.39 in stock market trading Friday, breaking out past a 764.55 buy point in a cup-with-handle base.
Shares have found support near their 21-day exponential moving average. Its relative strength line is trending upward, as its 50-day line is also sloping up again.
Tesla's RS Rating is 85 out of a possible 99. Its EPS Rating is 72.
Among U.S. automakers with a growing slate of EVs, General Motors (GM) and Ford (F) each rose 0.5%. Recent IPO Lucid Motors (LCID) fell 3%.
Tesla's China-based rivals Nio (NIO) declined 1.5%, Xpeng (XPEV) dipped 2.5% and Li Auto (LI) ended the day mostly flat.
For more info check out my bio.

$TSLA’s igniting candle$TSLA has been acting better than most stocks throughout the week amid weakness in the overall market. It finally pushed above 765 in order to open up the chart for higher prices. We were long the $750 calls which returned 300% profit. The next move higher should take the stock in the 780-820 area. Most dips should provide a good buying opportunity as long as it holds above 765. October deliveries at the end of next week might be an important catalyst in either direction. From a technical perspective, Friday’s action was just the beginning of a new active sequence for the EV maker.

TSLALooks short term bearish here. Would like to see daily EMA's be tested and continue to hold as support to start another 5 wave impulse towards the 1.618 around $1,000.

TSLA Observationit is dropping alongside the whole market, yet we might discover a few motivations to not freeze in any event. In the first place, in the 8h graph, we have uptrends and the market is currently bullish notwithstanding the correction made.

TSLA buy at 650Tesla is a buy at or above 630. moving forward there Is a chance of the last pullback before bullish continuation.

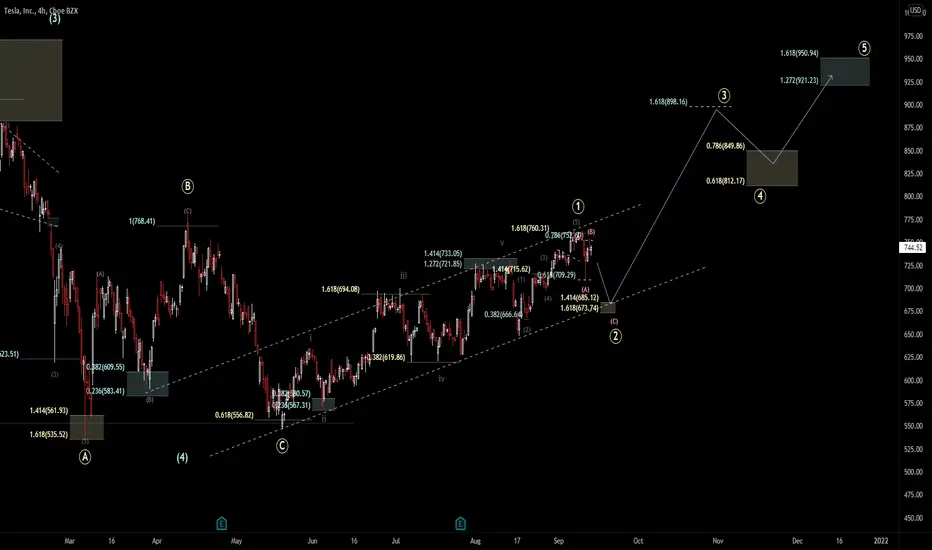
TSLA Potential EW Count: BTD at 680?TSLA could be making its way back down under 700 very soon...but that might be the last time you'll see it under 700 for a very very long time!
Be mindful TSLA is also in an upwards channel, once the wave (c) completes from 752 to ~675...we could see a monster run for a primary Wave 3 up to 898 eventually! (Longer term)
Please examine chart
For now, you can try trading the wave (c) down to 675 with a hard stop loss over 752!
These are just my ideas, I am not a financial advisor nor am I professional EW trader!
Happy Trading
TSLATSLA
........................................................................................................
.....................................................................................................
........................................................................................................
....................................................................................................
........................................................................................................
....................................................................................................
..........................................................................................................
....................................................................................................
............................................................................................................
.......................................................................................................
vsdvsdvdsssssssssssssssssssssssssssssssssssssssssssssssssssssssssssssssssssssssssssssssssssss
sssssssssssssssssssssssssssssssssssssssssssssssssssssssssssssssssssssssssssssssssssssssssssssss
sssssssssssssssssssssssssssssssssssssssssssssssssssssssssssssssssssssssssssssssssssssssssssssss
sssssssssssssssssssssssssssssssssssssssssssssssssssssssssssssssssssssssssssssssssssssssssssssss
sssssssssssssssssssssssssssssssssssssssssssssssssssssssssssssssssssssssssssssssssssssssssssssssss
ssssssssssssssssssssssssssssssssssssssssssssssssssssssssssssssssssssssssssssssssssssssssssssssss
dddddddddddddddddddddddddddddddddddddddddddddddddddddddddddddddddddddd
ddddddddddddddddddddddddddddddddddddddddddddddddddddddddddddddddddddddd
eeeeeeeeeeeeeeeeeeeeeeeeeeeeeeeeeeeeeeeeeeeeeeeeeeeeeeeeeeeeeeeeeeeeeeee
eeeeeeeeeeeeeeeeeeeeeeeeeeeeeeeeeeeeeeeeeeeeeeeeeeeeeeeeeeeeeeeeeeeeee

TSLA, the 5th elliott wave has been started. 150% gain ahead.elliott waves are drawn on the chart . the fifth wave's target is also in the chart . it's the zone between 38.20% of Fibonacci extension and 261.80% of Fibonacci retracement.

Waiting Game TESLA (TSLA):Bulling long term scenarioHello traders and investors!
Today we are considering the idea that Tesla (TSLA) can reach a target between $1,400 and $2,600.
As far as I can see we are in a corrective structure. I consider it as a simple (and relatively) shallow zigzag to complete primary wave 4 and "follow" the guideline of alternation with primary 2 (complex and deep WXY correction). If this structure will eventually unfold as zigzag (with a B wave as a triangle) we should also see market geometry respected:
a) wave 4 = 38.4% of Wave 3 at the middle line of pitchfork connected between cycle 1 and cycle 2
b) primary wave 4 completion in the region of intermediate 4 of lower degree
Targets:
$1,400 if primary wave 5 = 61.8% of primary wave 1
$2,600 if primary wave 5 = 100% of primary wave 1
Let's see what happens next.... as usual no rush to buy the dip

TSLA 4H BUY AND SUPPORTTSLA 4H support is at ~$680
Also try to set some buy orders near the support zone
If TSLA holds above the trendline,
the Take-Profit target would be $710, $738 and $755

Tesla on it's way to 770TSLA next resistance (targets) 750 and 770.
Must hold 728 or at last 720 to keep momentum going. Close below 712, upside move stalled.
Other support / resistance levels as marked.

TSLA Bullish LineupTSLA has been consolidating since our explosive run early this year, I believe a breakout to the upside is imminent for the following reasons:
We're riding a support line that has held up since the March '20 COVID-19 crash
Bulls have gained control over the 50 MA, which is providing reinforcing support to the major support mentioned prior
We had a major Symmetrical Triangle pattern breakout to the upside early August, showing bullish strength
Finally, on a more technical view, RSI is showing a comfortable position while we dance against the upper side of our resistance. As well as MACD is turning over to a bullish momentum.
In red I have identified our resistance, and in green is support.
The bottom green parallel channel represents our major support and buyer interest zone, while our upper red channel shows our major resistance zone, one which I believe we will bounce off of after a breakout, before finding support around $720, and continuing upward.
Best wishes, Good luck.
Comment your ideas!


$TSLATesla’s looking very nice here.
Price broke out of the descending triangle to the upside and has currently retested previous resistance on the daily which ended up closing on a hammer.
Keep this on your watchlist.

Update- see previous chartsTSLA is forming quite a large rising wedge (Bearish) on its yearly chart after breaking out of the symmetrical triangle (see previous chart), which was preceded by TSLA breaking below the bear flag above. While TSLA did close on Friday sitting right on its 50-day EMA there is also a Bearish Gartley harmonic on the 4-hour timeframe (not pictured). Definitely will be keeping a close eye on TSLA in the coming weeks for potential long-term entries- just an updated chart with some support and resistance levels along with some RSI-based supply and demand zones to keep an eye on
-----------
TSLA closed on Friday sitting right on its 200-day SMA. It previously broke below the bear flag to test a long-term uptrend line, while simultaneously forming what appears to be another bear flag / rising wedge ( bearish ) going into earnings on 7/26'. If this long-term uptrend line is broken, TSLA could see sub $600 especially if the broader markets continue pulling back. Will be keeping a close eye on TSLA here for potential long entries.

Tesla ( $TSLA ) Potential Monumental BreakoutHow do you ignore this setup? $TSLA breaking out of a triangle to the upside with a BULLISH MACD crossover on the weekly & daily charts. Look for a monumental move in the coming week(s).

$TSLA - Diamond Reversal?Are we going to see a Diamond Bottom reversal on NASDAQ:TSLA ?
Right now, TSLA is riding its way up the price scale on an uptrend but is currently experiencing a local down wave which has brought us down past the current up channels 0.382 Fibonacci line. This lower 0.5 line of this upwards channel may save the day and help get things back on track. It looks like $TSLA is entering into a diamond pattern which could - if successful - help with the journey towards the $750 target before AI Day (Aug 19th), which people seem to have in mind.
If not currently holding $TSLA and looking to pick it up as a trade, it would be possible to pick up a safe entry just above the 0.618 in the $710 area , or a slightly riskier play may be to try and catch a wick down past the 0.5 @ $706.91.
A few points worth mentioning:
Volume is forming a U shape on the 15min chart where the possible Diamond Pattern occurs.
RSI nearing neutral territory
So far, candles are respecting the lower 0.618 & 0.5 of the upward channel and 0.382 & 1 Fibonacci lines of the downward channel (area highlighted in yellow)
$750 price range aligns with the 2.618 of the local fractal we are working through
* This Content is for informational purposes only. You should not construe any such information or other material as investment, financial, or other advice.

TSLA $750 IncomingTSLA consolidating nicely. Flipped resistance into support. I think a push to 750 is possible in the next few weeks.

Tesla (Update) : 1D TFAccording to the previous analysis of Tesla, the price is still moving towards our target and we will continue to expect it to grow.

TSLA: An impending 10% up side move?Broke out of a down trendline.
Had a 10+% surge up at end of July.
And price is not consolidating.
Anticipating another 10+% burst up soon. Perhaps a better time to enter is when the 20MA catches up.
Target profit also coincides with a resistance at about $780.
Disclaimer: I'm not giving any trading and investing advice. I'm just sharing my chart observations.
If you have any symbols that you'd like me to analyze, feel free to drop me a comment.
