We are LONG on TSLA. PT: 1200We are hyper bullish on TSLA for the rest of the year.
Some pointers:
After failing to meet EPS numbers, we remain confident that TSLAs growth has only begun.
Listening in on their earnings call, we are happy to hear that their growth will materially grow by more than 50% for many years to come.
With PiperSandler coming out with a $1200 PT yesterday and ARK Invests Cathie Wood saying they will come out with an updated analysis on tesla next month, we see this as very good news for TSLAs price action in the coming months.
With Elon stating that FSD and their auto business being worth $1T in market cap alone, that in and of itself is great for TSLA.
Their energy storage deployed doubled from Q3 to Q4.
TSLA is building 2 gigafactories (Berlin and Texas) and is outgrowing all of its competitors in every space.
Bidens EV plan will incentivize people to switch to EVs. It's only a matter of time.
Charting Patterns
Historically, TSLA has traded in many wedge patterns and this is no different. We believe this dip will be bought and the recovery will be rather quick.
Tslalong

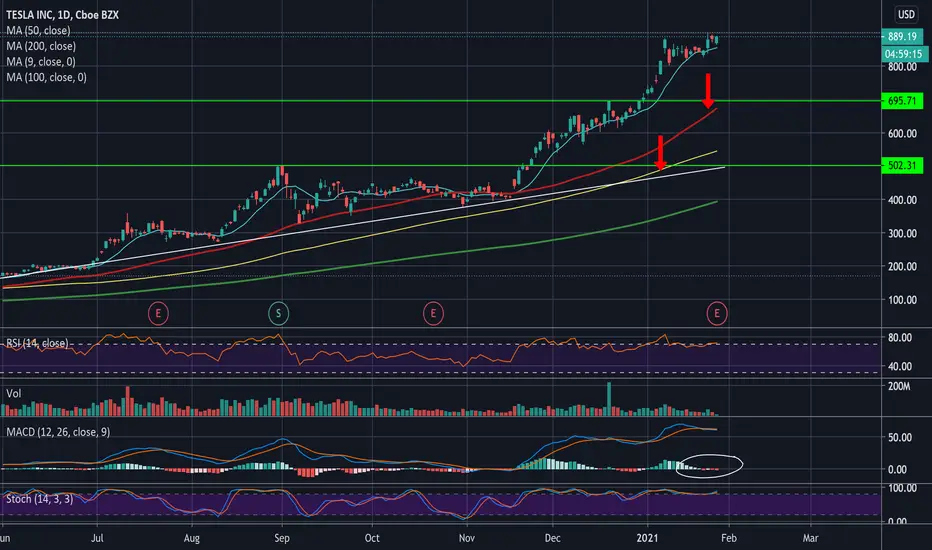
Short TESLA today. Who is the big shorts Micheal Burry?Ok so with trading timing is everything. Lets face it that Micheal Burry from the film "the big short" got really lucky with his housing market short in 2007-8. It's one thing knowing a market will sell off, it's another thing timing it. Fair enough he had to get all those swabs sorted as there wasn't even an instrument to short sub prime back then. Micheal was so early with his trade though that it nearly costs him dearly.
Here he is again lining up his Tesla shorts for ages now as the market has been going higher and higher.
markets.businessinsider.com
I've been trading TESLA the other way adding to longs again and again while most trader said it cant go no higher! Now we are at a point though that the MACDH on the daily chart has finally trigged an extremely bearish divergence. These extreme divergences work out 80-90% of the time. The Dow had one a couple of days ago and selling has been hard down a 1000 points or so the last day. We have also had Yellen saying "we don't see a lower dollar" last week which has caused the Dollar to strengthen, gold to sell off and equites with it. This is actually the first time Tesla has put in a major divergence like this in several years. Looks like a low risk high reward short to me ahead of the fed this afternoon. Everything depends on them and how much Yellen can really do to stop the plummeting dollar.
I think we can trade short TESLA down to at least the $700 dollar region. Stop at the high of around $902.
Let's see if we can outsmart Micheal Burry a little anyway with our TESlA short timing today.

Tsla Buy the dipSafe to say tesla will break out soon. the inflow is insane today exceeds all sells for the week just fyi.

Workhorse - finished accumulation, is the stock headed to 30$ ?Workhorse is one of our favorite EV stocks, one of the reasons for that is because it's been around for a while (started in 2007) and they are not just dealing with EV and EV batteries but also with Drone technology. Drone technology is expected to grow its use widely in the USA and following the announcement of the FAA that drones need to remotely identify themselves while in flight 2 weeks ago, made us the investors understand drones are getting into the mainstream technology space. It's worth mentioning here that Boeing (BA) got several contracts from the US Army to build advanced drones with minimum human supervision and a high level of AI and automation that will make drones the perfect tool for espionage and other covert missions. One last thing to mention on WKHS is their big contracts for delivery trucks with united states post office service (USPS) which we were a bit hesitant about till a few weeks ago when they announced it is going as planned.
Let’s talk about the important part – Technical:
So, this is pretty easy to understand – WKHS has been trading sideways from the beginning of December from 20$ to 23$. The stock broke resistance level on Jan 5th and the 23$ line is now our new support level, although it needs to be tested again. After the rally stock went down back to the 23$ line and now we are facing two possibilities :
1. Stock breaks through 27$ line and starts accumulating there and then touch 30$
2. Stock drops to the 20$ line and from there we will see a sideways trend for several weeks to months.
If we see the second option happening this will be a great time to do more ‘dollar cost averaging’ and buy the stock at a low price. We do not have a doubt that WKHS is crossing the 50$ line before the end of 2021 – I believe way before…
One main thing we need to watch is the volume of the stock:
avg volume last 3 months is: 14.7M
avg volume last 1 month is: 17.5M
avg volume last week is: 9M
We can see a decrease in volume meaning a lower sentiment (“Buzz”) around the stock. But I will use a quote here directly from InsiderMonkey: “WKHS has seen an increase in hedge fund interest lately. Workhorse Group, Inc. (NASDAQ: WKHS) was in 13 hedge funds’ portfolios at the end of the third quarter of 2020. The all-time high for this statistic is 10. This means the bullish number of hedge fund positions in this stock currently sits at its all-time high.” This is big news for the stock and it means we are looking at an accumulation stage before a mark-up phase which will cause the stock to rally up again!!!
We are long on the stock and we will keep buying more in our portfolio.
Trade safe and be safe!!
FDGT Academy.

BUY $TSLA PT1 880, PT2 900, SL 819.34 Rationale
Volume shelf
Earnings Wednesday After Close, enthusiasm will create positive pressure
Potential EV Credits from Biden Admin
Exit Wednesday afternoon
I almost never touch TSLA, (to my detriment) but this looks amazing.


TESLA Bullish Pennant Will Go UP! BUY!
Hello, Traders!
TESLA car company is incredibly bullish at the moment
And the bullish pennant pattern that the stock formed
Implies a bullish continuation after breakout UP
Thus, I propose a long trade using stock options
To limit the downside to the known and manageable size
BUY!
Like, comment and subscribe to boost your trading!
See other ideas below too!

TSLA completed WXYXZ correction (Wave 4 on 1H) ready for Wave 5?We have had a complex WXYXZ correction on TSLA since January 8th and I believe may have completed its course finally with a ABCDE Triangle Correction in extended trading on January 20th. In this 15M view I map out each of the correction waves. WY and Z are counter impulse. X and X track with the impulse. Wave 4 correction should be .318 to .5 of the timeframe of Wave 3. Given that we are right in ideal timeframe to begin Wave 5.
TSLA tends to have an equal length Wave 1 and 3 impulses. based on that I see a price target of 960-1000 for Jan 26


Tesla is still bullishThe cycle and wave analysis of tesla shows that it is still bullish. When the correction is over it will jump another small wave to beyond 1000 to the possible 1600-1800-2000 targets.

TSLA. Don't exit your longs just yet!TSLA has reached the target we set last week, but that's not all. There are many factors that suggest we should not exit our longs, at least not completely. But before I list those factors, let me first clarify that I'm talking about leveraged longs, not stock. If you own shares in Tesla, then I would not advise selling them, even if the stock price went down 50%. I'm talking about your trading position, not your long-term investment.
Positive Indicators:
Price gapping up for the past two days is a strong signal for bullish momentum.
The shape of the last candle is bullish.
The candle body is fully above the major resistance trend line in black.
RSI still has more room to go up before it hits record high.
Despite negative indicators which I will list below, TSLA is one of the safest stocks to hold when the whole market is red.
Even though the entire market was struggling in the past two days, TSLA was going up very strongly, which suggests that if the market was doing well in general, we would've seen even more gains. This is a sign of strength and real demand.
Negative Indicators:
TD Sequential on the daily shows that the last candle is a green 9, which is a sign of reversal. The way to trade it is you take profit, and wait until you can identify the direction of the next momentum. However, historically, TSLA has not responded well to such reversal signals.
On the weekly, TD Sequential shows the last candle as a green 8, which means there is one more week to the bullish momentum to go before it is exhausted. The problem is we can't tell whether the 9 candle will be green or red. Combined with the daily signal, the way it could play out is that we get a red weekly candle that completes the 9 count.
We see general weakness in TVC:SPX and signs of the start of a bullish momentum in TVC:DXY . Now when DXY is going up, it means that the dollar is becoming more valuable, so people start cashing out of their positions, which affects the stock market negatively. However, like I said earlier, TSLA has proven to be one of the safest stocks to hold when fearing a market drop or correction.
The last candle stopped at exactly the crossing of two Fib lines that I drew a long time ago. One is horizontal, and the other is descending. So I feel like there are too many resistance points there.
The Trade:
In my chart, I have a big black thick broadening wedge.
I have a small ascending parallel channel that starts from Nov 2020 and has already been broken upwards.
I have a descending Fibonacci retracement just above the last candle. This line has not been tested so we cannot be confident that it will resist the price. I'm assuming that it will resist it, together with the broadening wedge.
I also assume that the top of the parallel channel can hold the price if it drops.
I'm also assuming that the bottom will come after four daily candles. That is the typical correction time expected after a TD sell setup completes on a 9 candle. The correction could finish sooner of course.
I picked my stop loss to be the bottom of the last full green candle. That is at $722.90, which also crosses the top of the parallel channel.
A lower stop loss is at the bottom of the parallel channel and is below all the gaps. If gap-filling OCD is your thing.
My target is the next descending Fib line, so it is around $1050.
I've drawn two paths that are conservative, in my opinion, on where price might be heading based on my trend lines.
Notice the similarity of this candle to Friday 10 July 2020. It was also a green 9. RSI was at a similar level. It was followed by a red candle, some sideways movement for a month, which calmed down the RSI, and then of course a new bullish momentum followed.
The conclusion is that even though a small pullback is expected, it will be very hard to trade, very hard to call the bottom of the swing, and it's a much better option to hold your longs, or simply move your stop loss higher; because after all, TSLA might just do what it's been doing for the past year, ignore all the reversal signals and gap up!

TSLA - Gap Fill Up, Bull Pennant Breakout - Hi Ho Hi Ho Up We GoRound Two of Riding That TESLA Electric Train!
Gap fill up to high $870s today - drop below $832 ($835 really) it's a bust. Potential for decent gap up overnight if we finish the day >+3.5%

TSLA further increase.TSLA further increase. The analysis shows that the price movement of TSLA builds an accumulation area. Its width is 760-889usd. The accumulation area is symmetric to the wave axis of the wave sequence of price movement. I look forward to continuing up from this area, with a rising wave sequence with a target price of 1196usd

Still bullish on Tesla (TSLA) to 1000.00I have been bullish on Tesla (TSLA) Stock since summer 2020. I have predicted many moves for Tesla (TSLA) before the inclusion of S&P. My bias is a continuation of bullish momentum, right now we are at a consolidation level which we could continue to break out to the upside or a possible retracement to the 800.00 level which lines up with a 50% retracement Fibonacci level, physiological level, and QP. Let’s see if we can get to 1000.00

TESLA LONG position entry levels TSLATSLA stocks experienced a huge BULLish run. But be aware because we have a GAP at Tesla chart that should be closed. This could cause good possibilities for BUYERS. I still hope for a bigger correction.
Here you have entry levels to jump in:
$814
$780
$653
If TSLA stock breaks $900, then buy with pullback with $1000 target. Volumes are still solid.

TSLA -- looking for pullbackIt's Tesla so it's always crazy, but I always just look for putting as much odds in my favor as I can.
One count I have shows potential pretty good resistance around $850 - 855 area. Premium is always high with Tesla so I'll be looking for potential call credit spreads on this one.
After hours it edged up higher, and, if tomorrow it holds and pushes up, I'll watch to see if we tag 850 and watch price action as I'll look to sell premium on this one in a bearish play.
Couple zones below, notably the $750 area, to watch as well. If price does pull back, signifying a potential wave iii is put in around 855, the 750 area aligns well with a standard wave iv pullback right within a demand buying zone.
My game plan: if price opens up, will watch for it to push to 850 area. Once there, I'll look to enter a call credit spread to sell some premium. If price does reject around 850, I'll look for it to go test back down around 800 and 750. But, it's Tesla, hence why I'm not saying just outright short it. Doing a credit spread gives you an edge due to premium in Tesla's options. As always, know your risk level and know when to take a stop loss. For me, after a potential pull back which I will play, will not surprise me at all for Tesla to reach $1,000...

TSLA stock target price before 20 Jan 2021 : 1080$ ~ 1256$.It's possible that TSLA drop down at magic numbers like 888$ or 999$.
That's easy TSLA rally to 900$ on 12 Jan 2021.
It's a good idea that buy some really cheap options to hedge TSLA meltdown, ex. TSLA put Jun 21 at strike 270$ ~ 495$.
Short some TSLA CFD with little stop-loss order when TSLA diving.
The market could reach a incredible high level before 20 Jan 2021.
be careful when TSLA higher than 1080$.
Double-Tops pattern
fuzzy range 12xx$~13xx$
270$ is a potential bottom price.
However, everything is
possible. The most optimistic scenarios
for TSLA is 2295$ at end of the year 2021.
stock analysis by Jiucai334

US Stock In Play: $TSLA (Tesla Inc)$TSLA was the top trending ticker symbol over at Twitter ($TWTR) in the last 12 hours, after closing with a +7.94% rally intraday. This is a new all time high attained by $TSLA at $816.04, post split. The breakout have also fully negate the Bearish Wedge chart pattern highlighted in the previous week, with $TSLA breaking above the upper boundary of the chart formation in less than 5 trading session.
Current price volatility is observed to be at a significant range of $35/day ATR-14 (an approximate 4.35%/day). A continuous follow through of momentum tonight (bullish) with pre-market trading beyond $817, is likely to see TSLA trade beyond its limit range of 4.5% to close the week at $860.

TSLA - short scalp opportunityTesla usually sees late day profit taking and stop loss scalping. Usually occurs mid-late afternoon, and if sentiment is overwhelmingly positive, the MM's will typically do a late day spring that will rocket the stock into tomorrow. This trade idea is a short term scalp.
The $830 put option exp 1/8 has a time value of only $3-4/ea. Retracement to the high $790s would yield a $8-12/contract return.


$TSLA about to see 720-750 levels$TSLA about to see 720-750 levels
$TSLA 680/700 calls for Dec 18th can work best

TSLA - Gap Fill Up, Bull Pennant Breakout - Hi Ho Hi Ho Up We GoChart speaks for itself...If gap lasts to 9:30, we fill. Key Levels listed on chart. South of $715 is stop loss and trade is a bust.
Picking up some calls shortly after open. Will double the position once we see a hard bottom.
