Tslalong

TESLA growth analysisHello traders,
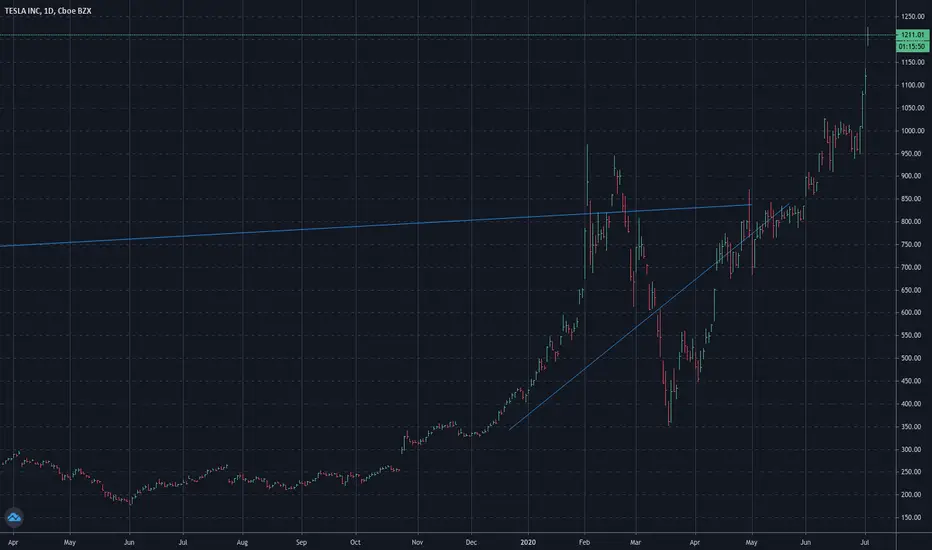
As the TESLA stock price chart shows, TSLA is taking an upward trend, the support S1 confirms that.
Since 18 Mars increase to a specific maximum point (Point A, B, and C), and then take a break to prepare for another one.
Right now, we have another increasing trend of TESLA. Two scenarios:
-- Either, it will continue to reach a new maximum, and go back down as a break. That break will be decreasing and must not be below the level “L”, in that case, we can say it’s going up again.
-- Either, it will go down below that level “L”, and in that case, we can say that this trend is ending.
Generally, we expect that it will go up, take a break by going down to bounce on a level that is higher than “L”, and go again in an increasing trend.

TESLA: Earnings Expectancy is Postive + Covid19 Vaccine?Tesla (as I stated prior), seems to be a gift that keeps on giving. Elon Musk is meeting production quotas for Tesla, and now Tesla is even working on being manufacturing partners for Covid19 Vaccine drug makers. This may potentially be a first step into upgrading Tesla into either a large holding company or industrial conglomerate. Either way, it is definitely good news and reasons to be quite bullish on the future of the automaker (who now has alot of brand equity value as well). I am upgrading my level 2 target to be $1.5k by September. As always, this is on an opinion based basis and not meant to be taken as actionable financial advice. Pursue at your own risk.
TESLA (BUY OR LONG TSLA ) TP UP TO $ .1335The sixth session TSLA showed its strength and increased 3% in the last hour of the US session.
And Now :
BUY TSLA : When breack out at : $.860.
PATTERN : "SHS" has S' .
TARGET : $ .1330 - $. 1335.
STOP LOSS : $.793 for investing long term .
STOP LOSS : $. 830 for margin .

TSLA temporary short and long setup on the daily chartTSLA is testing $954. The overall market has been slowly correcting and is likely to pull TSLA down with it. Short target 1 would be around $833 and that could also be used to start a long position. Short target 2 would be around $673 and that could be used to start a long a position as well. 50% Fib retracement is at $673 so we could possibly test this area and take a long position.
Also, take note at $833 and $673 there is a lot of support and these almost perfectly line up with Fib retracement of 78.60% and 50% respectively.

LONG TSLABroke below the triangle but held at the 20 DMA and then bounced up. Still within Bullish Channel (Green Lines)
I suspect we hit ATH in a few weeks given a few factors:
1) TSLA Delivery numbers are good
2) Updates to Giga Berlin
3) Update on Fremont Battery Line

TSLA Long Call !Update!If TSLA Drops below $954 then we could see some trouble, tomorrow we will be shown the corona cases, gdp, job report so it will be a very interesting day tomorrow.
MACD is still Bullish, RSI is in a supply zone so It will most likely drop a little more tomorrow until it hits a demand zone again, as long as it holds weekly support you won't need to worry.
Any questions about the signal, or if your interested in the paid trading groups DM me.

Tesla Play of the month | Options CallTESLA MARKET BREAKDOWN:
Tesla has now over 650,000 reservations for the Cybertruck electric pickup, according to a new report from Wedbush.
Tesla $1070 call 7/17.. Will wait for a cofirmation. Looks like Tesla will move sideways for the next few days.
This will pay pretty big, but don't trade this you will lose money...
DotcomJack

🤣 Yo! Elon! Whatchu Wanna Do? (TSLA)💰 LET'S GET INTO SOME TESLA ANALYSIS!💰
1️⃣ First off SMASH that LIKE BUTTON & Give us a FOLLOW for DAILY ANALYSIS! ❤❤❤
- Most of the market is bleeding currently. Zoning in on a 2 day chart for tesla entry.
- Look for the compression on the Crossover strategy and align the red ema dots for a long term play.
- No confirmation just yet.
Best of luck to you and all of your trades this week! 🤜
Drop your charts and comments down below, share with us what you think is going on in the markets! ❤❤❤
Thanks for checking out our analysis! ✌😁✌
🥇MLT | MAJOR LEAGUE TRADER

Long TSLAConsolidation Zone. PT: 1150-1200
Giga Berlin being built faster than Giga Shanghai lol. 650k plus cyber truck preorders.
1k is strong psychological level. Already broke past 1k a few times... only a matter of time before we see more upside.
Do your own research :)

🤔 Compression Shows signs Of Potential Tesla Selloff. (TSLA)💰 LET'S GET INTO SOME TESLA ANALYSIS!💰
1️⃣ First off SMASH that LIKE BUTTON & Give us a FOLLOW for DAILY ANALYSIS! ❤❤❤
(Overall Market Sentiment) 🤷♂️ Neutral
- We are seeing 2 compression candles known as dojis relativity towards the top of previous Resistance. This is where we would like to look for distribution. We do not have 100% Crossover confirmation on the Crossover strategy. It's not a confirmed play just yet. Need a little more time.
- Only 1/3 ema dots are firing red as of now. This also does not show a trade confirmation.
- We are playing in a nice size range, if we get a Crossover and selloff we could play a short for up to 10% for a potential test on support. If we were to collapse and break old support, chances are that this break to the upside was just a fakeout.
Thanks for checking out our analysis! ✌😁✌
🥇MLT | MAJOR LEAGUE TRADER

💥 The Highs Are On High Alert! (TSLA)🤔 Just looked at amazon, facebook and now tesla all show correlation to testing the highs.
Look for it to play the red upward support and squeeze in the compression point. Break below look for a short back down. I think we are still evaluating if the breakout at 902 to the new highs is a fakeout or going to see if support can hold. You see that we did drop all the way back down but bounced right back up off that old major Resistance level.
The larger timeframe like the daily and 3 day are still green so I don't have that long term confirmation yet.
My main concern is how I'm seeing the Resistance levels across the board be tested right now.
Have an awesome trading day and weekend. ❤❤
🥇MLT | MAJOR LEAGUE TRADER

$TSLA ready to rocketTesla is ready for a big move up, taking a swing position on $TSLA
Long Entry: $885
Stop Loss: $785
Price Target: $1200

1.618 Fib on TSLAWill momentum carry it to 1200-1250? What a crazy rip to the upside.
I think we will see 1200 sooner rather than later... Possibly within 1-2 months.
New Software Updates for self-driving, bullish battery news, gigafactory updates and more... so many good catalysts.
Long TSLA.

Tesla Searching For Support. (TSLA)🚨 Very critical price action move for the next big tesla play.
We did get our breakout to attempt to push up, but fakeouts can happen.
You're going to look for 926-930 to test for support. We are pretty much testing it now!
If this was a fakeout expect a big selloff. You can play aggressive here if you wanted to catch this as a level support only if the Crossover strategy plays and the ema dots line up for a curl back up. Otherwise for a longterm position you will want to look for 1024 to breach to shoot for a new bull trend.
Good luck! 🎲🎲
🥇MLT | MAJOR LEAGUE TRADER

For all of You that was Bullish on TeslaFirst off, please don't take anything I say seriously or as financial advice. As always, this is on an opinion based basis. That being said, how does it feel to have been bullish on Tesla? I was very positive on the company and hoping it would hit $1k by few months. At the $835 mark I said, still room to grow at least +25% soon. Tesla crushed targets faster than expected, and now Elon Musk wants to release semis on the road. If I were you, I would wait before a re-entry as it is likely gonna go down from people wanting to cash out at this price. However, now I'm moving my target to $1.25k+ by the end of September, early October. Elon Musk seems to have had a great week for himself. That being said, I'm having fun just being the guy analyzing or watching from the side lines.

Told You Play $910 Level, Look What Happened. (TSLA)June 7th , we approached a very key level of $910 and I alerted you to play this edge on breakout. Now Tesla has printed around a %12 gain in just 3 days! 💰💰 Congratulations if you played it.
All indicators from the ema dots to the Crossover strategy candles showing strong green pressure.
Best of luck,
🥇MLT | PRO TRADERS


TESLA - Fresh Record Closing High - $1000 per share in reachTSLA shares have been among those driving the gains in the Nasdaq- having reached a record 'close' on Monday
A New All-time high above 968.85 then $1000 per share are next upside targets

TSLA to 1050-1100Taking profit around there. See yah.
Oh, and buy TSLA on every dip. Thank me in 3-5 years lol.

Fun Time Approaching For Tesla! (TSLA)I am highly interested on tesla as we approach an edge play at all time highs!
Followed by the massive market crash tesla has ran non stop on the larger timeframes to the current position of 885.66, that is a lot of rocket fuel! 👨🚀
BEAR SCENARIO:
What your going to want to look at on the daily timeframe is to watch for the Crossover strategy take place. We want to see the green candles compress for a red doji crossover for interest on a potential massive short position. Once we ge the cross confirmation the next step is to start to see the red candles cross over the green line that it has been trending above since the bottom. That is how we will spot the Resistance pressure.
We notice on the ema dots below we have one confirmation of red dots printing, we need to see them all line up and follow. Your strongest confirmation is when the candles and the ema dots align. That is the money shot. Like we say in say in our course we always use tight stip loss in case of a reversal! 1-3%
BULL SCENARIO:
We already have green candles in motion but the current Resistance level we are watching is 910.04.
As we approach this edge we want to look for a breakout to fire long. So if we can get price to break we will fire long and apply our stoploss and continue to track tesla based off the ema dots and the Crossover strategy. Our stoploss will become 1% on a break back low then to reverse to a short and play this level till we get pull on the new long term trend. (Tight risk management on breakouts) A breakout like this your going to see a pullback to test it to see if the highs are a new level of support or just a fakeout. If bull pressure can snap it and really kick in you should be solid. If it hesitates then you know something is up.
All time highs are a great spot to look for a very long term position. 910.04 is your money level. Play the strategy to the book. We will be using the daily and the 3 day charts for this one. Will stay updated on tesla as I scout it.
Best of luck, enjoy your sunday and have a blessed day! 😁❤✌😁❤✌
⬇️ Drop some comments and let us know what you think will happen next! ⬇️
🥇MLT | MAJOR LEAGUE TRADER

TSLA Swing CallsAnother triangle broke through and didn't post... my bad
My goal for TSLA could possible hit 1,000 by the end of this week, they've been having great news, uptrend, Elon isnt and idiot, and the charts look good.
Again message me if you would like to know more about the trading group.

Daily:- TSLA (Solid Long)Looking at how it make the last test to became its support, the next possible up will break mid 900.
Support:- 863
Resistance:- 967
Till then the battery day we might possibly see this chart fly rocket high.
Trade safe and Stay healthy
