Sell TSLA. Clear head and shoulders. Sell it. It's painfully obvious.
Don't know if we'll get the chance to short but short $180 if it bounces. Could only get to $167.5 or just continue straight down. Sell now if holding any spot.
Tslashort

TSLA Double Top Tesla looks to play out double top Pattern. $150 area first bounce
$134 area area is target move

TSLA - A complete trade plan!I have mentioned all the technical tools which are indicating a strong bias towards selling the stock.

TSLA 1H BUYTSLA 1H support is at ~$186
Enter 50% at the current price
and try to set some BUY orders near the support zone
If TSLA stays above the trendline,
the Take-Profit target would be 5%, 10%, and 15% from your entry
Cheers

TSLA BULL TRAP Immediate BEARISH IDEA : Distribution Pattern
Look for drop then *UT to 198-200 area then failure with bearish divergence confirmation on RSI & MACD
Close below 178 cancels inverse H&S pattern to fill gap at 170 (we may find support at 173 for false rally and rejection at 178
Bullish then Fail set-up - Push up to 208-213 to grab liquidity then major rejection to complete 5th wave down with Bullish Weekly Divergence.
Resistance: 201 210 222
My Targets:
tP1 $160 -
tp2 $130
tp3 $120 Begin Accumulating
Just Ideas, Let me know if you have different idea or Bullish setup to share.

12/2/22: TSLA READY TO FALL OFF A CLIFFNot much to say here about TSLA but negative. It is possible we can push to $207, but I don't think we reach that. I believe we are close to the top of TSLA's rally and should continue to decline.

3D daily wolfe wave setup in TESLA$TSLA The wolfe wave indicator is increasing in popularity as we continue to see more people using it and enjoying the results. There is a massive setup for a gap fill 261 which it left open in September 2022. This setup is identified in the previous post using the 2D time-frame and it is also appearing on the 3D time-frame.
The weekly setup was triggered the last week of November 25. The projected target is calculated by extending a linear line between pivot 1 and 4 and projecting the line. This is represented as the green perforated line, as shown in the chart. The projected target is around 600 with estimated time of arrival sometime last week of March 2024. Short term wise, look to target the 261 gap or 200 day ma. Long term wise, dollar cost averaging on the dips would not be a bad investment for child's education fund.

TSLA 2D wolfe wave setup into January Run up$TSLA The wolfe wave indicator is increasing in popularity as we continue to see more people using it and enjoying the results. There is a massive setup for a gap fill 261 which it left open in September 2022.
The weekly setup was triggered the last week of November 25. The projected target is calculated by extending a linear line between pivot 1 and 4 and projecting the line. This is represented as the green perforated line, as shown in the chart. The projected target is around 524 with estimated time of arrival sometime last week of January 2024. Short term wise, look to target the 261 gap or 200 day ma. Long term wise, dollar cost averaging on the dips would not be a bad investment for child's education fund.

TSLA - Going ShortThe stock shows great respect for the AB=CD harmonics pattern. The short-sell indication is further strengthened by formation of a lower high in the hourly timeframe.

Tsla Ive been busy with world cup :)
Ok , i think tesla is in a perfect buying area , despite the overall talk about going more down .
Its almost oversold and this maybe the last day ,
All indicators show over sold .
I DONT SELL THIS AREA AT ALL , its life opportunity to me
GOOD LUCK

Tesla, Inc. (TSLA) Headed For $125No waiting.
No delays... It has already started going down.
You can click/tap the image below to see the full analysis on my previous trade idea: Tesla | Chart Spells Doom! (Nov. 19)
Everything is about to speed up... The market crash, that is.
Thank you for reading.
Namaste.

Tesla Chief Twit bringing down the company to $102.85Head and Shoulders has formed on the Daily chart with Moving averages all looking down 200 > 21 > 7 .
The first target from the last analysis (ongoing) is $102.85
Bearish
Has Elon Musk Bitten off more than he can chew or are there signs he is slowly getting out of Tesla and focussing more on Twitter, Neuralink and SpaceX?
Only time will tell.

TSLA to continue slideAfter a definitive rejection of the $200 price.
Sellers took control of the TSLA price and are trying to get it below $191 once again.
if Buyers here are exhausted $187 is the next target and verification of another leg down with targets at $182 and $177
In the event of increased buyers confidence if they are able to hold $191 then a possible retest of the $200 could be in sight with $204

What if you could see into $tsla future? $TSLA The wolfe wave indicator is increasing in popularity as we continue to see more people using it and enjoying the results. In this monthly chart of TESLA, there was a bearish wolfe wave that started developing on November 1,2021. Last year, tesla was a very popular ticker to trade due to it's beta relationship with the market index. Moreover, hundreds if not thousands of new youtubers or existing tesla followers started covering tesla as if they actually owned or worked at the company. Even to this day, as tesla trades -58% from it's high, we continue to witness irrational exuberance in the tesla stock with recommendations of dollar cost averaging ideas floating around and long term price targets upwards of $3500 to $10,000?? Wolfe waves are great in detecting when a stock enters in bull or bear markets. It removes irrational exuberance and allows the trader to focus price and volume which are the main ingredients in determining momentum. And until the stock price reclaims at least the 6 month moving average, the price of the tsla stock will continue to sell into strength and eventually fill all the gaps it left open back in 2021 and 2020. As tesla continues to sell off and extend lower, there will be intra-day opportunities for option traders to position into long calls as shorts cover. At this point, strong volume and price action induced by positive news reports is the only thing that will get tesla out of this bear market.

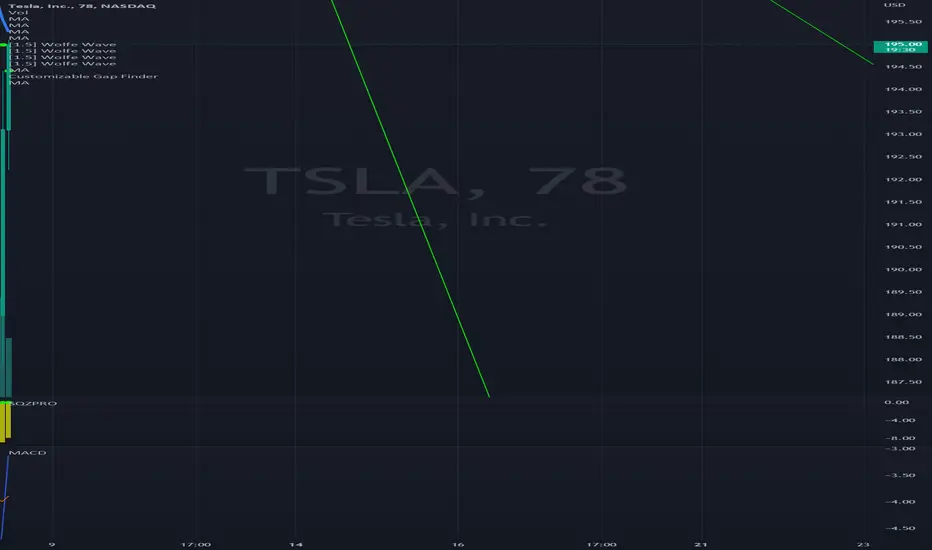
TSLA Bearish Wolfe Wave lower time frame Wolfe waves are great because they help traders identify profit targets with respect to entry. They are especially useful when there is binary event such as earnings, cpi or ppi. Last week, I posted a bullish daily entry for tsla for an over the weekend tgif trade. Although TSLA dipped on monday, we were still able to buy the dip and offset some losses from Friday's entry. Post PPI, TSLA gapped approx 3% and rallied another 2% tuesday morning. Typically gaps contrarian in nature, they are bearish/bullish depending on the direction of the gap . Gaps introduce another variable which can counter trend any trade idea sooner than later. Tuesday's price action for TSLA was generally weak with respect to other tech names. Moreover, there is a bearish 78 min wolve wave + 78 ttm squeeze that has just triggered with a projected target of 175. Bullish or bearish waves on daily time frames can produce giant returns; however, the trader should take into consideration other macro events such as economic data, fed speakers , earnings and the worst of them all Jerome Powell FOMC. If the bearish wolfe wave does fails to move tsla price stock lower to 180 to 175, then the setup will likely turn into a short squeeze where the horizontal line representing the bearish stop loss will be the breakout level target.

Tesla Dropping By 35% to 60% Max (The Laws Of Nature)TSLA lost its support last week and is looking fully bearish.
We see a 35% drop incoming in the months ahead and up to 60% RED if things get really ugly.
It won't matter to Mr. Musk as he sold at the TOP back in November (Genius).
The market cycles are part of nature and will continue to manifest themselves regardless of any one person, group of person, governments or institutions.
Market cycles can be delayed, retarded, artificially manipulated but this can only happen momentarily...
At one point, all the participants will have to go back to basics and re-learn all of Nature's Laws.
Namaste.

TSLA Local Short! TSLA is trading in a downtrend
Below a falling resistance
And now is going up
To retest the Resistance cluster
From where a local move down is likely

$TSLA heading to $200 and beyond? -- FOMC bull run rejected$TSLA rejected after hitting previous PT of $235 tanks to JPow being extra hawkish today at the FOMC meeting. That being said it's clear now that there's a dead cat bounce building. We might have had an over correction on 11/02, so potential expect the week to be contested between $210-220 as the bulls won't want to give up their premiums, but keep in mind there is HEAVY support at $200 for the next few weeks on all expiries.
Look for a movement to the downside within the next few weeks towards the 11/18 option expiry, or about 11 daily bars / 15 days.
That being said, the extension is showing a potential break down towards a 100% fib extension of $178.49 (-17.11%) move to the downside if completed.
I'm not particularly sure if we will hit that target 100% but we are most likely going to be peaking over 200 in the short term considering we've flashed over a few times in the last impulse (read: $198.59 on 10/24).
This is super early to call out since we only have 1 or 2 daily candle sticks to chart off of without any confirmations of trends so this is as real time raw as you get. Looks like a new downward channel forming from the top of yesterdays action with the bottom support being the previous downward wedge support line. With today's FOMC candle we can draw the middle trend line between this big channel.
Fib extension resistances:
0.5 $207.95 (-7.4 pts, -3.43%)
0.618 $200.99 (-14.61 pts, -6.78%)
0.786 $191.10 (-24.42 pts, -11.33%)
1 $178.49 (-36.81 pts, -17.11%)
Also keep in mind the 200w MA is moving up (slowly) and the current price is $158.88. A drop to this level is -56.61 pts (-26.26%).
One thing to note is that we have been within a stones throw of a larger downward channel in purple for several months now and we've skirted with this line of support in the past in mid October. At this point this bottom line support of this bigger channel lines up nicely to the $200 support zone. However keep in mind the volume profile at this level is VERY weak on the daily time scale. We have to move into weekly volume profile supports to get any meaningful views and again we see a weekly volume profile support at $200 as well as $185.50.
For what I think will happen: Peek out of the purple channel support and flash over to the 0.786 fib resistance and reject as wave #2 on the impulse. Bounce back up to the 0.5 on the extension and reject and continue downward motion. Ultimately I see this somewhere between $190-200 with enough bullish momentum but there's a possibility given the volume profile is so thin here that we can start seeing a harsher trend down to the other diagonal bearish channel support below in green, which coincides with the 200w MA.
PT1: $200~201 (-6.78%)
PT2: $190~191 (-11.33%)
Max profit: $185 (-13.58%) -- This coincides with a weekly volume support shelf of $185. I would hope this support holds, but if it does not then look out for $150 max support below (gulp!)
Stop loss: Breach of $220/225 double resistance supports would break this trend completely.
Note: There is a possibility that this trend could not pan out since we literally are fresh off the print, so there's a decent chance that $TSLA stays range bound between $200-215 as well. Which would still print for bearish positions theta farming.

TSLA bearishI think #tsla will keep faling until dec. I would like to hear your thoughts on this.
-------------------------------------------------------
Not an investment advice, just my thoughts.

2X $TSLA TP1 HIT for -20%TSLA weekly analysis was the head and shoulders forming on the weekly timeframe we played the break of bearish confirmation down to the neckline of the formation and we will continue to play the pattern out

TESLA not looking good BRUhHello, I am a NiceCat, Sir and Nice to meet you.
TSLA is not looking good after the H&S top formation and breakdown, now testing last support that is not that strong.
This probably will be lost with fake reclaim, followed by a clean retest that is a nice opportunity for a short term short position.
Or when in doubt better wait and place some bids in the area below, 100-120 USD.
Good luck.

Short term to long term entry on TSLA we LoadedThere is a 78min wolfe wave setup that triggered on today Nov 8. The projected target is calculated by extending a linear line between pivot 1 and 4 and projecting the line. This is represented as the green perforated line, as shown in the chart. The projected target is 234 which is expected to reach this price target within 3 to 9 days. Projected targets are defined by identifying the apex of the wolfe wave and projecting a vertical line toward the green perforated projection tgt which is extending from left to right. Using the customizable gap finder indicator there are sets of gaps along the way so these gaps will be levels to take and manage profits. Dec 16 220C locked and loaded with 190 contracts.
Strong Sell Signal On Tesla For Swing TradingI analyze on daily and weekly chart. Here are the list of indicators that Tesla is going down:
1. 100 SMA and 25 SMA crossover on weekly timeframe. SMA crossover is the first indicator I look for because it is the first indicator to show up.
2. Support line is being break by today's candle from the consolidation in the past month and the support from past few months. You can see my support line in color white in my chart.
3. -DI is above the ADX and the +DI is below the ADX which means it is very bearish. The slope of the ADX also counts. The higher the slope, the stronger the signal.
I'm currently looking for 130-150 for possible support. My first signal to close the position is when the -DI goes under the ADX but I will still wait for further indicators of reversal before taking profit.
