Tsla down continuationJust 2 days ago I publish about tesla to reach 255$ first target and yes we are exaclty in the middle of the way
Tslashort

TSLA Time To sellafter the rejection of the price several times at the level of a supply zone with a divergence of the Rsi we will see a drop in the price

TSLA Looking Ugly (Setup Update)And here we go… posted this yesterday and we are now getting follow through price action to the down side. Bearish Divergence is now in the works, as price action will drive down to the projected areas… OUCH for the market, Horray for the trade setup…. Buckle up.

As i prefect exactly Tsla in daily going hard now watch how aggressive breaking all supports and going to 255$ first target for daily move

TSLA SHORTTSLA showing bearish divergence on MACD, RSI. Looking at a breakdown when market opens. Bearish pennate will force breakdown to its local low levels

Tsla going down I announce in the morning we are IN OVER BOUGHT AREA , so yes it dump now and the road is dumpy. Over bought in 4 hours , day , week
Remember 200-160$ to buy as much

TSLA CAN MAKE A BIG CORRECTIONAccording to the available data, it seems that a diametric is currently forming, which is finally wave C.

Sell-off Exhausted | TeslaUS markets (S&P 500 Index +0.3%) ended Wednesday in the green after a choppy session, perhaps exhausting the extreme sell-off sentiment from the previous day. The unexpected result from the US inflation report released on Tuesday had prompted speculation that stocks could start to head back to their June lows in reaction to a more aggressive Federal Reserve.
Tesla (+3.4%) was one of NASDAQ’s best performers on Wednesday.
TSLA’s rise places it back above $300 per share, a territory the stock fell below after Tuesday’s broad-market rout.
Helping TSLA fend off broad investor pessimism is the company’s improving supply chains.
On Monday, Tesla’s vice president of investor relations Martin Viecha spoke at the invite-only Goldman Sachs tech conference. Viecha noted that the company’s battery supply chains are the best they have ever been, and Tesla can now buy all the cells it needs, for both its vehicles and energy-storage products.

Tesla road to 150If September 20-21 Fed meeting will have 100 BPS raise and regarding to Global Macro environment, stops of Tesla factory developments around the world including Germany there will be nothing left to fuel this stock and the crash gap is wild. Close to 50%

Tsla Tsla still in down trend , despite the split , hype , news
We are in 40 years inflation high
First target on daily 285 , weekly 260
Second target on weekly frame 206
Good luck - please dont hype

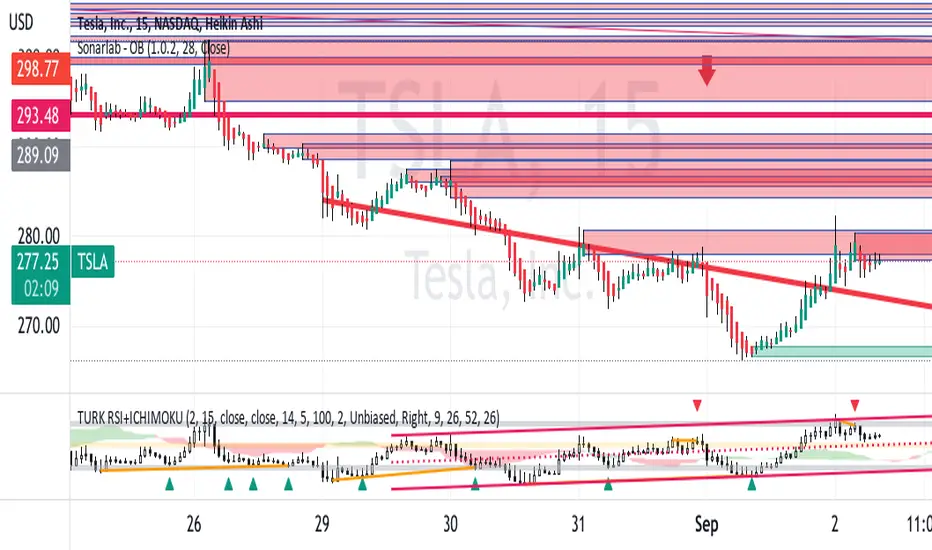
$TSLA poised to drop🔸️Ticker Symbol: $TSLA timeframe: 15M 🔸️Bearish Pattern 🔸️Investment Strategy: Short
TECHNICAL ANALYSIS: After poorer then expected CPI data this morning, a sharp decline in the market has led us to believe that there is still some red left in Sept. As we come into Friday; which we have OpEX, stocks are set up to drop even more.. as smart money has been loading up on put options. My entry will be $296.32, about the .5 retracement of the order block from the marked Order Block/ Supply level. I will have my stop set up just a little higher than the supply level; and will target the C wave/ swing low that was set today. This is a 10:1 risk to reward, and about a $8 dollar drop in TSLA.
Looking at Trendsi Dashboard, it's easy to assume that this rise to our entry level will put us at the upper red band of our regression channel; money flow will be in our upper red band; and as we continue to back test these indicators, they have been spot on when determining future price movement. Using technical analysis and these very powerful indicators; I will be buying ITM options, for next weeks exp date.
🔔 Follow for daily stock, crypto and forex technical analysis .
⚠️ Trading is risky, and I understand nothing is guaranteed. Proper risk management should be in place at all times to minimize losses. Please consult a financial advisor before trading. All Inclusive Trading LLC is not a financial advisor and may not be held liable for any losses which may occur.

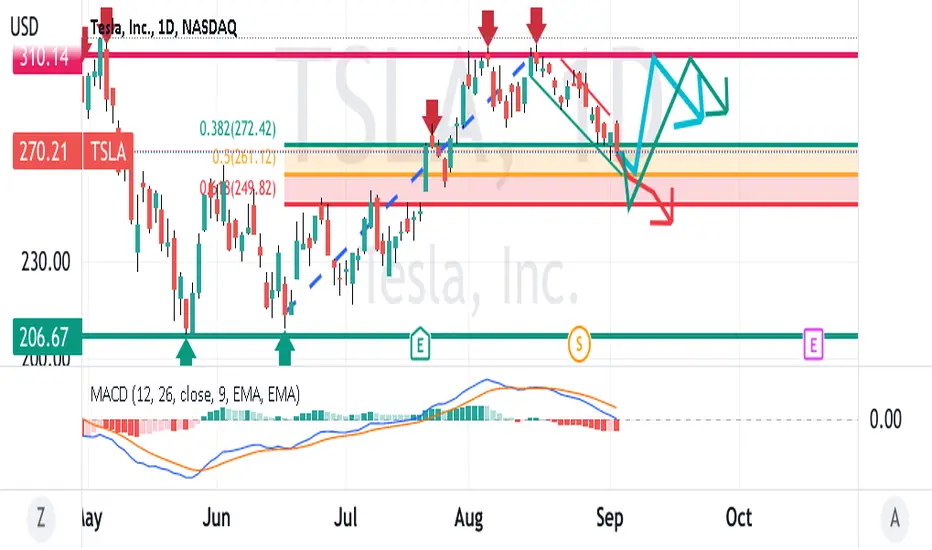
TSLA heading lower or bouncing up from support ?NASDAQ:TSLA
TSLA on the daily chart has mid-Fibonacci levels on the retracement of the uptrend serving
as support. The MACD has the K/D lines with a crossover above the low amplitude histogram.
So the question is wil TSLA break those supports and head lower or instead
will it bounce off of one or the other and uptrend towards overhead resistance.
What is your optinion?
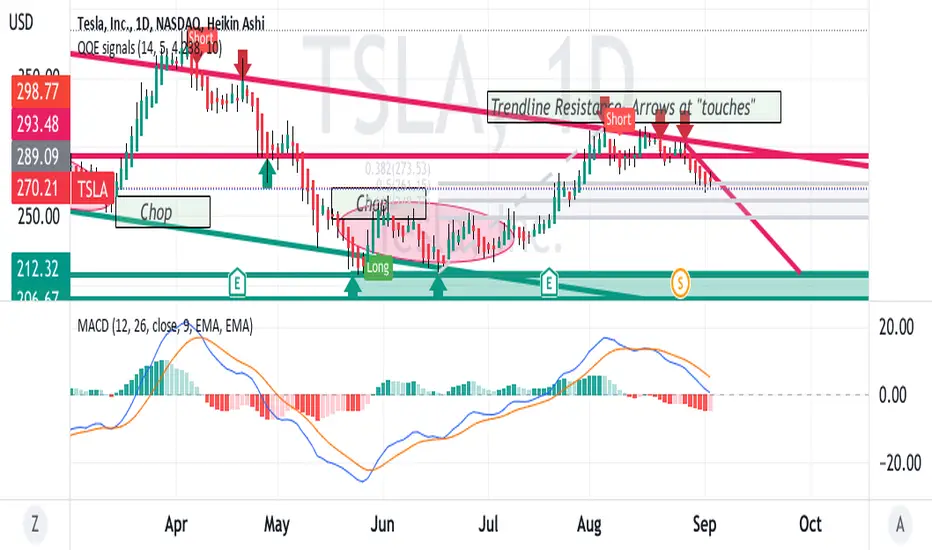
Tesla down trend !Tesla broke the uptrend before 2 months and more .
We still under selling pressure .
The green line is the uptrend , the yellow is printed new down trend .
Our top target is 296 maximum
Our down target is 206 and i will study it again after we reach there .
I spoke before that we will have a sort of pull ups due the over sold in RSI DAILY.
Weekly we still high enough to go down more than 206 .
WE ARE IN RESCISSION , Dont FOMO
Good luck all

TSLA Slide ContinuesEarly in the Week: TSLA & IXIC, along w/ the market as a whole have performed poorly the week after Labor Day. With the current market, I expect things to get very ugly this month. I see all kinds of resistance above TSLA's current stock price of $269 and very few things to stop a freefall to $253-$251, which is my current price target where some more serious long term and consequential levels will come into play.
Late in the Week: Watch for option strike pinning later in the week - thursday (9/8) and especially friday (9/9)
Current Option Open Interest Key Levels
Calls:
<265 - 821 or less - very weak
265 - 4,817 SOFT PIN > 265
266.67 - 4,387
270 - 3,941
275 - 3,034
280 - 3,844 HEAVY PIN > 280
285 - 4,473
290 - 5,298
295 - 3,296
300 - 8,994
Puts:
250 - 8,119
255 - 3,259
260 - 3,924
265 - 6,376
270 - 4,235

TSLA Strategy 05-Sep-2022 @ 1 HR Bias: BearishTSLA Strategy 05-Sep-2022 @ 1 HR Bias: Bearish
Bulls:
1. Bullish Divergence at Klinger
Bears:
1. LH, LL
2. Came back from strong resistance at 313
3. Created double top @ 313
4. Broke Trend Line
5. Bearish trend continued for min. 90 Days
Bias: Bearish
Plan A:
Sell @ 263.5
SL: 304
TP1: 247
TP2: 229
Plan B:
Buy @ 290
SL: 264
TP1: 315
TP2: 340

I expect the same here Since all trader think we going to fall this month its normal that the market flip up for two weeks or more then drop
So in daily we are in over sold area
We can flip a little to monthly high then fall and do break all resistance with “no merci “
Good luck

TSLA looking weak SHORTTSLA is continuing to trend downward while China is melting down
and the TSLA giga factory is underproductive.
The chart shows a fall from the upper trendline of resistance
confirmed by the MACD lines flipping above the histogram.
Targets for the trade are the mid-range Fibonacci levels in the
retracted of the up trend so about 258 and final take
profit heading towards all earnings where the current trendline
hits the horizontal support at about 205 about October 1st.
Stop Loss nominally at $10 above the current market price.
Accordingly expecting a reward to risk of more than 5 to 1.
All in all, the short setup or put options appear to be
an excellent setup,
The best question is whether others in the sector are
following the market leader and dropping even faster or
instead, are they holding up better because they have
less China exposure
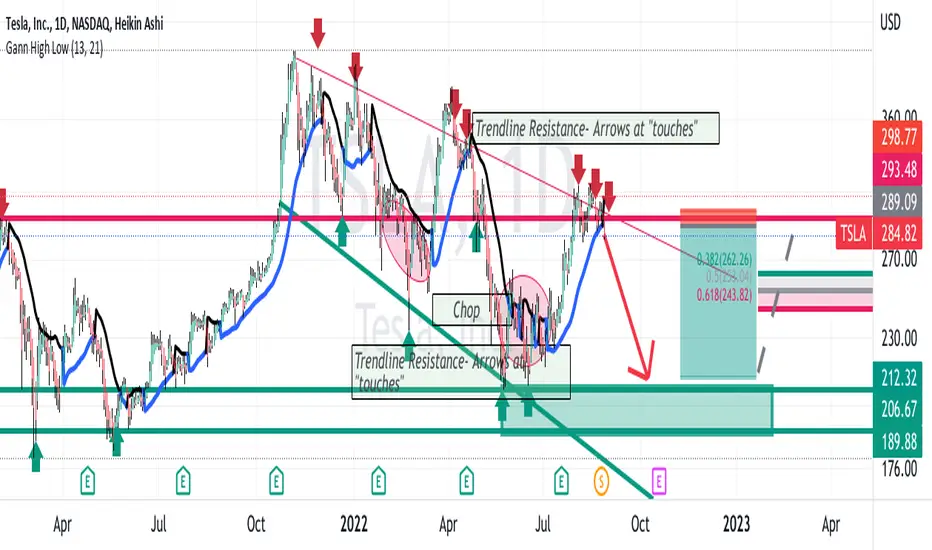
TSLA descending widening channel MEGAPHONE SHORT NASDAQ:TSLA
TSLA on the daily chart has a megaphone pattern showing increasing volatility as the price action is downward.
Supportive and resistance trendlines are touched multiple times. At present, the price is also at a horizontal S/R line being the 2021 year high.
Another horizontal line is the double bottom of Spring 2021 forming a support zone.
My analysis is that TLSA will downtrend from here heading down until the mid-Fibonacci
retracement levels and perhaps further to support zone at 188-208 and potentially lower
if short sellers aggressively gain directional momentum.
I have taken an out-of-the-money put option with a strike of $ 200 for October 21st mindful of the earnings date.
TSLA SHORTAs on the chart, TSLA is hitting heavy resistance and appears
to be setup to short. The whole China economic meltdown
and the NVDA issue with regard to China is weighing heavily.
Thus, TSLA has technical and fundamental headwinds.
Accordingly, this may be a good entry to short or get some
put options.
As an asidem the inverse ETF for TSLA, TSLQ is sitting
on horixontal support and looks ready to head upward
making it a low cost TLSA play.
Tesla stalling? Tesla
Short Term
We look to Sell at 282.85 (stop at 294.03)
Previous support level of 280.00 broken. Posted a Double Top formation. The bias remains mildly bearish but there is scope for a move in either direction at the open. Further downside is expected although we prefer to sell into rallies close to the 282.00 level.
Our profit targets will be 249.72 and 216.00
Resistance: 280.00 / 313.00 / 383.00
Support: 249.00 / 217.00 / 207.00
Disclaimer – Saxo Bank Group. Please be reminded – you alone are responsible for your trading – both gains and losses. There is a very high degree of risk involved in trading. The technical analysis, like any and all indicators, strategies, columns, articles and other features accessible on/though this site (including those from Signal Centre) are for informational purposes only and should not be construed as investment advice by you. Such technical analysis are believed to be obtained from sources believed to be reliable, but not warrant their respective completeness or accuracy, or warrant any results from the use of the information. Your use of the technical analysis, as would also your use of any and all mentioned indicators, strategies, columns, articles and all other features, is entirely at your own risk and it is your sole responsibility to evaluate the accuracy, completeness and usefulness (including suitability) of the information. You should assess the risk of any trade with your financial adviser and make your own independent decision(s) regarding any tradable products which may be the subject matter of the technical analysis or any of the said indicators, strategies, columns, articles and all other features.
Please also be reminded that if despite the above, any of the said technical analysis (or any of the said indicators, strategies, columns, articles and other features accessible on/through this site) is found to be advisory or a recommendation; and not merely informational in nature, the same is in any event provided with the intention of being for general circulation and availability only. As such it is not intended to and does not form part of any offer or recommendation directed at you specifically, or have any regard to the investment objectives, financial situation or needs of yourself or any other specific person. Before committing to a trade or investment therefore, please seek advice from a financial or other professional adviser regarding the suitability of the product for you and (where available) read the relevant product offer/description documents, including the risk disclosures. If you do not wish to seek such financial advice, please still exercise your mind and consider carefully whether the product is suitable for you because you alone remain responsible for your trading – both gains and losses.

TSLA Bears with another attempt towards the downsideShorts in full effect this Friday.
Bears have taken hold and are now eyeing $280 and $256 as their next possible target now that buyers seen exhausted.

TSLA 7D chart UPDATE POST SPLIT / FED NEWSTSLA as shown on the weekly chart
has hit the top of a megaphone pattern ( increasing volatility)
where it printed a Doji candle to demarcate a reversal
while the relative strength topped out testing its Ichimoku Cloud
but failing.
The ADX has little magnitude ( distance from zero) nor rate
of change ( momentum) and is now pointing downward.
All in all, TSLA on the weekly chart is at a bearish inflection
in the context that TESLA has put out more news about impending
layoffs.

TSLA SHORT NASDAQ:TSLA
TSLA on the 4 hour chart appears to be in a downtrending parallel
channel and presently at the upper resistance boundary of
the channel. This could also be a megaphone pattern as the channel
is widening a bit as it descends. I see the horizontal resistance of February 2021
market high as resisting any breakout to higher prices.
I see horizontal support below at 190 from the market lows in March and May this year.
The MACD oscillator is in mid-range as is the RSI oscillator. The latter shows
some bearish divergence suggesting an impending reversal.
I see this as a short setup to synergize with the general market
the downturn from the current market price to 190 or until just before
the earnings report in mid-October. This is about $100 of profit
I will set a stop loss of $5 above the current market price Thid
is a great reward-to-risk ratio even if the price gets jammed up
at Fibonacci retracement levels on its way down. The low-costTR bearish ETF
is a consideration as are out of the money put options.
