TSLA Descending Triangle Break Weekly Options PlayDescription
This idea originates from a different idea in which I interpreted the chart as a Symmetrical Triangle.
I believe this interpretation was incorrect due to the consideration I put on the beginning of the gap up into the pattern. The opening price of the first candle following the gap is a technically irrelevant fact, unlike the support found after TSLA falls from the high, in this case the ATH, where it bounced three additional times, each time producing a lower high (a Descending Triangle).
The Descending Triangle is bearish in purport, displaying a lower demand zone, and a descending liquidation zone, representing a growing overhead supply vs a stationary demand zone, until the sellers become stronger than the buyers (or buyers reverse), overtaking the lower boundary.
Historically speaking, it is common for the lower boundary of the preceding pattern to become a new resistance, where once-buyers will be happy to liquidate, having been "made whole".
The price target implied by the pattern is between 320 and 670 or less than 670.
As a take from contrarian traders, such as Brent Donnelly, there is an application of the Magazine Cover Bias today, as TSLA CEO, Elon Musk, has been chosen as "Person of the Year" in time magazine.
This is very reminiscent of 99', when AMZN CEO, Jeff Bezos, was chosen as "Person of the Year", shortly before the beginning of AMZN's two-year bear market.
(Related idea linked)
Using long puts to maintain a positive vega ahead of FOMC this week.
Long Put
Levels on Chart
SL > 1000
PT : 700
*Stops based off underlying stock price, not mark to market loss
The Trade
BUY
12/31 850P
R/R & Breakevens vary on fill.
The price target set with the idea is higher than the pattern implied price target due to the expiration of the position.
This position is updated in the linked Related Idea, where there is a better explanation of alternate short strategies.
Manage Risk
Only invest what you are willing to lose
Tslashort

TSLA Symmetrical Triangle Break Weekly Options PlayDescription
TSLA Began the formation of this Symmetrical Triangle after achieving an ATH @ 1243.49.
The Symmetrical Triangle is a common congestion pattern, typically indicative of continuations, accompanied by descending volume (on chart) and a heavy volume on the breakout.
My point of contention with this pattern is okay volume on the breakout. It is only slightly above average when calculated on a 60 day period, or slightly below on a 30 day period.
Although there is generally no advance indication of breakout direction, an indication can be what other stocks are doing - making bearish breaks through major trendlines and support levels since FEB - MAR of this year.
The resulting price move implied by the pattern is equal to price move that preceded the pattern.
So depending on where the measurement starts, the breakout, once confirmed, implies a 330 point minimum to a 680 point maximum move to the downside.
Intermediate price targets: 900, 775 and throwbacks to the triangle's apex are common @ ~1100.
My intermediate price targets are above the pattern-implied price targets due to the expiration of the position.
Long Put
Levels on Chart
SL is a daily close back in the triangle
PT : 900
*Stops based off underlying stock price, not mark to market loss
The Trade
BUY
12/23 900P
R/R & Breakevens vary on fill.
The price target is the support at 900, which is above the break-even at expiration, so the primary objective of the position is to capitalize on a quick downward move in TSLA stock price and profit on the increase in time value premium.
For those who didn't short @ 1200:
An ATM, further dated Long Put would serve the objective of the position better if it is within your risk tolerance.
Or an ATM synthetic short if you have the ability to sell naked options.
And without the ability to short effectively or sell naked options, an ITM put would serve best, if within your risk tolerance.
If you want me to build these positions, just ask.
Manage Risk
Only invest what you are willing to lose

TSLA: Pullback before the run-up? Quite the run on Friday as Alpha Traders members banked 400% twice! If TSLA opens over Fridays highs $1121.82 most likely comes. If we stall at $1100, it may end up being a great short into 1032 area. Keeping on watch.

TSLA overbought + retest at previous resistanceTSLA just spiked up after a bullish divergence and is overbought as you can see at the RSI. It will probably go down and retest the previouse resistance at 1007-1016 dollars and go further up.

TSLAHello. Due to the negative divergence in the weekly time frame and the formation of the weekly candle, it is predicted that the correction will continue

This is my first prediction post. TSLABy looking at the Average True Range I saw that the pip jumped by 1 whole #. so I think that it'll go up in the next couple of hours. FEEDBACK IS APPRECIATED GOOD & BAD.

$TSLA Potential gap fill play further sell off?looking to see if we get a further sell off on tsla, 950.50 is a double bottom on the 4hr and 1 day, if that breaks we can might be able to get into the gap that looks like starts at 944.20

TESLA STOCK TSLA CORRECTION LEVELSTSLA stock is fighting for the price level around $1000. When we close lower, we can test the support around $880.

Elon Musk dumps another $1 Billion TSLA StockIf you haven`t sold when he got the answer "yes" on twitter for selling his shares:
Then you should know that Elon Musk sold another 934,091 TSLA shares, according to filings with the SEC published on Thursday.
The shares are worth $963.2 million.
Ark Invest also sold TSLA shares.
What is your next move?
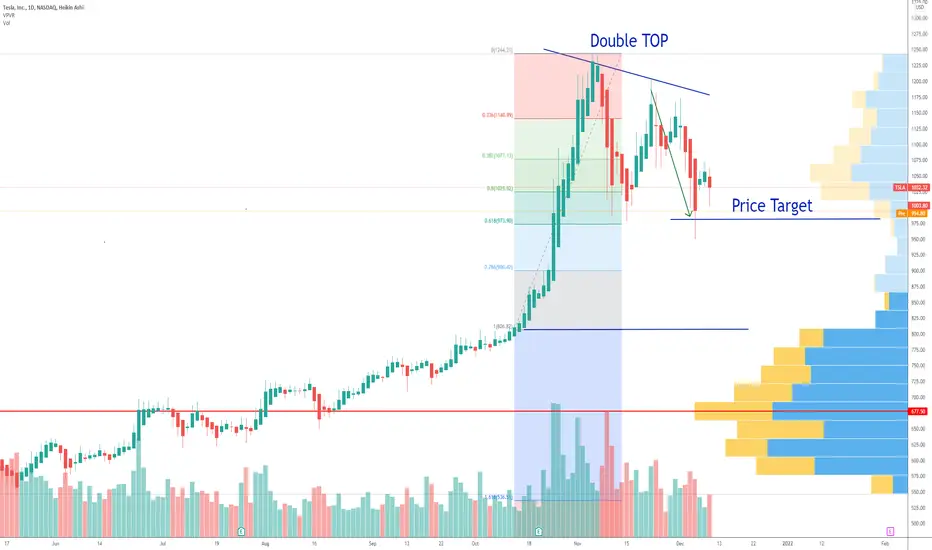
TSLA Analysis, Double Top !!Hello everyone, as we all know the market action discounts everything :)
_________________________________Make sure to Like and Follow if you like the idea_________________________________
TSLA is currently trading in the upper part of its 52-week range. The S&P500 Index is also trading in the upper part of its 52-week range, so TSLA is performing more or less in line with the market.
The long-term trend is positive and the short-term trend is neutral. The long-term trend may just continue or reversal may be around the corner!
A double top pattern has been spotted on the daily chart which could lead the TSLA stock back to the $850 levels.
Possible Scenario for the market :
The market is trading at $1014.97 and it's nearing the neckline of the double top pattern located at the $1001 range, if a breakout happens of that line we could be seeing the TSLA stock drop to the $850 level. and a lot of the indicators are showing Bearish signs that would support the double top pattern.
In case the support line held strong then we could be seeing a Bullish movement that will lead the TSLA stock price back to the resistance level located at $1112.85
Technical indicators show :
1) The market is below the 5 10 20 MA and EMA indicating a Bearish short-term trend, But still above the 50 100 and 200 MA and EMA (Bullish long-term trend)
2) The RSI is at 44.20 showing some weakness in the market.
3) The MACD is below the 0 line indicating a bearish state in the market with a negative crossover between the Signal line and the MACD line.
Support & Resistance points :
support Resistance
1) 1029.10 1) 1168.14
2) 976.28 2) 1254.36
3) 890.06 3) 1307.18
Fundamental point of view :
Tesla Inc has asked a U.S. court to affirm an arbitrator's recent decision dismissing a former engineer's claims that the automaker fired and defamed her for raising concerns about defective floormats and contracting practices.
TSLA has a Return On Assets of 6.00%. This is better than the industry average of -1.33% and The Earnings Per Share has grown by an impressive 174.51% over the past year.
Looking at the last year, TSLA shows a very strong growth in Revenue. The Revenue has grown by 66.27% and based on estimates for the next 5 years, TSLA will show a very strong growth in Revenue. The Revenue will grow by 35.52% on average per year.
This is my personal opinion done with technical analysis of the market price and research online from Fundamental Analysts and News for The Fundamental point of view, not financial advice.
If you have any questions please ask and have a great day !!
Thank you for reading.

TSLA - SELL on BREAK TSLA has a triple top formation, and the neck line is $ 1,000.
The break of neckline places the objective of $ 700 in play.

TSLA (TSLA) - SELL SELL LONG-TERMI find it difficult to change my mind on this one.
the monthly chart has extremely high RSI, and further negative divergence clearly established.
we have an EVENING STAR candle, and this also signals a TOP in place.
My LONG-TERM view is $ 650.00.

TESLA (TSLA) - SHORT strategyI love the weekly pattern in the candle sticks and the level right into the HIGH BB area.
The time is to be short, and similarly Elon Musk sold his $ 1BN worth of TSLA stocks for taxes reasons (really?). He is cashing in on the height of the share price and so should we.
Sell now $ 1,116n - $ 1,150 range (no stop) and take profit medium-term $ 850 area.

TSLA Tesla Double Top Chart Pattern ??A double top is an extremely bearish technical reversal pattern that forms after an asset reaches a high price two consecutive times with a moderate decline between the two highs.
ARK Invest sold 141069 shares of TSLA yesterday, so more than 155Mil dollars!
My price target for the retracement is the 982usd support, close to the Fibonacci 0.618 support.
Looking forward to read your opinion about it.

TSLA 4H NEAR FUTURE PREDICTIONTechnical Analysis Summary
TSLA/USD
TREND ANALYSIS
We have 1 down trend which is currently active in red
We have1 down trend in red that has already been broken and thus the reversal
FUTURE PREDICTIONS
We have many resistanse and support levels that I have mentioned above.
I use thickness as an indicator of stregth of levels (ONLY FOR VISUALS).
Good luck everyone, stay safe!
If you need help don't hesitate to send me a message or comment
Trading Involves High Risk
Not Financial Advice
Exercise Proper Risk Management

TSLA - RANGING Tesla INC shares move from the highs $ 1,200 reaching low $ 1,000. It appears we are slightly positive short-term, and we may see $ 1,175 once again. However, I prefer SELL in rally for the move towards $ 700.
the Donchian channel is too wide, and the RSI still shows negative divergence medium term.
Strategy SELL $ 1,125 - $ 1,175 and take profit $ 750. Stop-loss placed at 10% of entry level of share price for now.

TSLA Weekly Options PlayDescription
TSLA has to stop at some point, right? Risk here is limited by time, 1 DTE to make a couple points.
Call Credit Spread
Levels on Chart
SL > 1250
*Stops based off underlying stock price, not mark to market loss
The Trade
BUY
11/05 1260C
SELL
11/05 1250C
R/R & Breakevens vary on fill, super tight trade though, risking 1000 to make ~200-300.
The short call is placed close to the money for higher profit.
The long call is placed 10 points away based off of collateral requirements and risk tolerance.
Manage Risk
Only invest what you are willing to lose

TESLA ( TSLA )TESLA STOCK PRICE has crashed after elon musk has announced that he would sell 10% of his tesla shares , tsla stock reached 1000$ level with a strong potential of reaching 900 $ level
the chart shows a correctional wave after the strong bearish movement , and this could be a great position to short tsla stock

TSLA look Bearish in corrective waveTsla is making big ABC corrective wave.. Wave A completed and wave B going to complete and more downside after this

TESLA "TSLA" ShortBig shot opportunity is waiting you 😊
Shot Area 1300/50
Target 🎯 890
All the best!

TSLA - Down Before Up??All this Elon drama selling shares, followed by Jeffries with a huge upgrade on it. Ultimately 3500 is within reach in a couple of year. $1700 isn't far off. I think a pit stop to fill that gap below at $910 will happen before both. Not saying it happens this week, but I do think 1120 area prints tomorrow. Can go either way with all the news surrounding it.

Tesla to retest 1000$ for another longTesla is still bullish, and there are signs for that.
Volume is so high, and 5th wave could hit above 1400.
