You Choose To Make Trading Complicated... Why?You will never control where the market goes next... unless you are a market maker with very deep pockets.
Stop trying to predict where something will be in 6 months and focus on what's happening now.
Your objective as a trader is to manage risk at Distribution/Accumulation points in the markets.
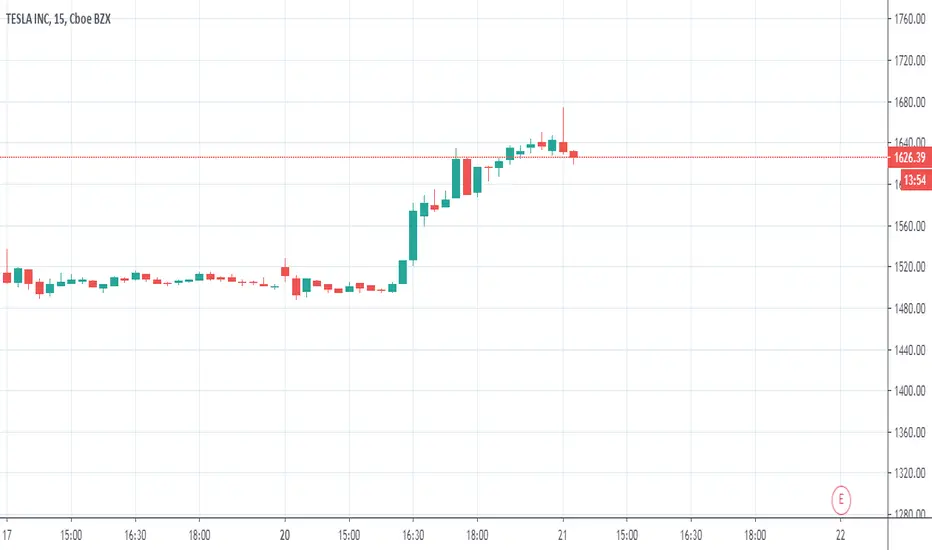
Here we have a chart of tesla.
Custom Candles, Ema Dots Indicator and The Custom RSI
We leverage the candles as confirmation of what price action wants to do as of right now.
If we have strong engulfing candles we NEVER chase.
You need to manage your risk on these compression points.
What we do is focus on the compression points of doji candles as they can shift signs of indecision and potential market exhaustion.
Then we align with the ema dots and rsi for correlation to leave overbought/oversold territory to identify the next major trend.
If you can manage a tight risk on capital on the trend turning points, that is how you win.
You have to risk a little to win big.
If you enter a trend shift and don't set a stoploss and the trend goes against you... that is how a large amount of traders blow their accounts.
You need to understand to manage risk and have the correct setup to identify the best trends in the markets.
It is inevitable that you will catch the next big trend if you play the trends correctly.
Filter out most of the noise and utilize a larger timeframe. Smart money let's their assets work for them over time.
Tslashort


TSLA - NO FANBOI LOVE HERELooking at the chart and the latest earnings, there's little evidence to support a bullish case for this stock and growing evidence pointing to moves to the downside.
The daily chart printed a bearish engulfing candle. There's been zero follow through buying since what the fanbois have labeled "blockbuster" earnings. The daily chart is a technical mess with lots of gaps and significant RSI divergence with the latest high.
TSLA is losing market share in Europe, the most mature EV market. The operating margin of 5% reported in the latest earnings report is pitiful. Rising commodities costs over the next few years will make it challenging to improve on these numbers. The recent price cuts for the cars points to waning demand. That could be COVID related and bounce back? It could also get worse with the virus still being a wild card. The growth in car sales certainly hasn't been significant enough to justify the lofty valuation.
If you look at this company and it's stock price rationally, only a fool would go long at these levels. Wait for a pullback to the ~$650 range which lines up nicely with a retracement to the .786 level and close the gap. That still leaves the gap around ~$260 to be filled.
I'm long Dec puts. This aligns also with election related volatility that is more likely to lead to lower prices. Look at buying puts at levels with the most open interest such as the $380 level with 15,620 open contracts.
Good luck!

Tesla Sell Zone and Targets (Bear View)What i think Tesla will do on the bearish view
(Not financial advice)

Short TeslaBefore I take long position, i'm waiting for wave 3 with 3 level TP. Most probably for me is around 1300 USD


TSLA Short! Target: $1000 - $1200 NASDAQ:TSLA
It seems pretty clear based on valuation standards that many tech companies are significantly overbought. Over the past two weeks there has been significant capital outflow from the technology sector while there has simultaneously been large capital inflow into commodity markets, especially oil and natural gas.
Head and shoulders pattern forming on the 2hr and 4hr charts. Looks like a great short set up to return to the longer-term price trend.
I'm not a TSLA hater, I like Elon Musk, but I think this is a great short set up. Just an idea, do your own research!

Tesla made Short SqueezeIf Tesla is positive ==> they become eligible for inclusion into the S&P500 ==> a more exciting stock in the index + more attention to that already exciting stock ==> increase in the price of Tesla and S&P. Despite the target on the chart, aggressive profit-taking seems like the best approach. Remember I am not your financial advisor.

Scared of heights? TESLATesla up to 6k a share
Seems to be obeying Gann
Don't think its justified but speculation is a hell of a thing

Long live the king - TESLA FOR LONG - Buy Buy It's pretty clear that the market might go up to touch the target point,
And it's obvious that the TSLA activity will never stop,
Buy and feel comfortable,
Have a good golf!

DO YOU HAVE THE B#LLS TO BET AGAINST TESLA?✅In this video, we talked about Tesla.
I see a great potential in this short trade.
Take it easy.
~Bo Bugra Sukas
✌️


Analysis on Tesla Stock RallyMany people are looking at Tesla's stock currently because from March till now, within a period of 4 months, it went up approximately 5x which is rarely seen in the stock market.
Tesla is a huge company but it has never yet made profits for four quarters in a row, and thus isn’t eligible for inclusion in the S&P 500, the world’s most tracked index. If it manages to show a profit for the second quarter, then it will have passed that threshold, and the committee that oversees the S&P 500 would probably add it to the index sooner rather than later.
Tesla's market cap is currently at $275 billion. With only having less than 10% of Toyota's revenue, Tesla market cap is currently approx $50 billion higher than Toyota's. I feel Tesla is probably overvalued now and is primed for a crash soon. Think it will hit support at around $1,000 price point.


I THINK THIS IS GOING TO BE MORE HIGHER THE LAST TIME THE RSI WAS 90 AND ALSO WAS SHOWING A LOT OF VOLUME ... SOMETHING THAT I DONT SEE NOW FOR A SHORT... IM LOSING A
15% BECAUSE IM SHORT , BUT IM GOING TO CUT MY LOSSES AT THE CORRECTION BY TOMMOROW


ridethepig | Tesla Island Reversal!📍 In the realm of Tesla, patience is sustained courage although the struggle for valuation is evident. The overstretched manoeuvre is identical to the struggle which we traded earlier in the year.
It is obvious for any of those that have studied the Tesla supply chain that outlooks and expectations at current valuations are unrealistic. What is surprising, is to see how the economy is coughing badly via covid, both corporates and consumers are becoming increasingly defensive in capital allocation...yet markets are pricing a mass adoption of overpriced cars.
With that recognition behind us, let us look at the deliveries for Q220 :
Model S/X 10,600
Model 3/Y 80,050
Total 90,650
============================
"While our main factory in Fremont was shut down for much of the quarter, we have successfully ramped production back to prior levels."
"Our net income and cash flow results will be announced along with the rest of our financial performance when we announce Q2 earnings. Our delivery count should be viewed as slightly conservative, as we only count a car as delivered if it is transferred to the customer and all paperwork is correct. Final numbers could vary by up to 0.5% or more. Tesla vehicle deliveries represent only one measure of the company’s financial performance and should not be relied on as an indicator of quarterly financial results, which depend on a variety of factors, including the cost of sales, foreign exchange movements and mix of directly leased vehicles."
============================
📌 This press release demonstrates how and where you can advance on expectations that are skewed the wrong way, and how complacency should be punished.
=> The lust for Tesla bulls is to expand above $1,000 ... that leaves them with another +/- 300k deliveries needed for Q3 and Q4 to keep things fundamentally interesting for the game.
=> With a second wave now a done-deal, risk is threatening to storm the battlefield. The previous Tesla crash which we traded live had sufficient preparation, here we have a long weekend and theoretically a delay in virus numbers till Tuesday of next week. Sellers can plan the attack and what makes the flows fundamentally interesting is that operations and valuations are based on no competition.
=> This powerful flow which is starting at $1,200 can be considered the starting point of the waterfall. A bold call that can be protected with stops above $1,500 while looking for another visit of the $425 fair value target.
As usual thanks for keeping the feedback coming 👍 or 👎 ... let's see if we get another home run!

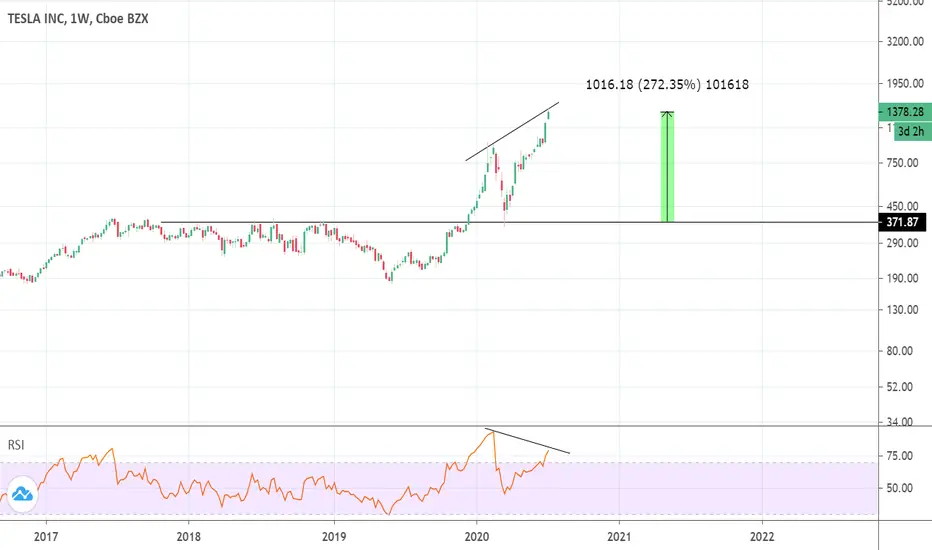
TSLA is Over ExtendedTSLA is up 275% from its last breakout in December, RSI is over extended, and showing a Bearish Divergence on the weekly chart. Time for TSLA to see a significant pullback.
TSLA Bollinger Band Snap and OOPS PatternWe recently shared posts on the nature of Bollinger Bands, Bollinger Band Snaps, and OOPS Patterns.
NASDAQ:TSLA looks to be setting up for a possible move lower based on those technical indicators.
On both July 2nd and July 6th, we have seen gaps to the upside, OOPS Patterns. Both days, the open of the bar was higher than the previous day's high. We have yet to retrace lower to close that gap. All of the price activity for the past two days have traded completely above the previous day's high.
Also on July 2nd and July 6th, all trading activity has occurred above the 2 standard deviation Bollinger Band, a Bollinger Band Snap. Price does not generally trade above the Bollinger Bands for long, indicating a possible price pull back to inside the Bollinger Bands.
These two indicators combined, add to the weight of a possible pullback on TSLA.
You can choose to enter short now based on the Bollinger Band Snap or you can choose to place a sell stop order at the July 2nd high to enter based on the OOPS Pattern rules. If you are entering with an options trade, it's encouraged to allow plenty of time until expiration to reduce the rate of time value decay on the position and also allow time for TSLA to move in favor of your position.

How Elon Musk Outsmarted Short SellersElon Musk as you could have recalled tweeted a while ago that "Tesla's price is too high imo", this caused a reaction in which short sellers broke off the resistance curve of Tesla early, allowing Tesla to smoothly go up past $1250 afterwards as a positive retracement reaction with barely any resistance. Many of us thought in May he was losing his mind , and personally I was still bullish. This TradingView user said it helped trigger the NASDAQ uptick rule, and others have also been dumbfounded on maybe this being strategic. That being said, since the market reacted to a natural mathematical pattern as a result of him saying his stock is "overpriced", technically Elon Musk can't be accused of any market manipulation. He played the SEC, short sellers, and the overly bearish investors like cats w/ a laser pointer. Maybe this was his plan all along. Elon Musk: 1, Short Sellers: 0.
