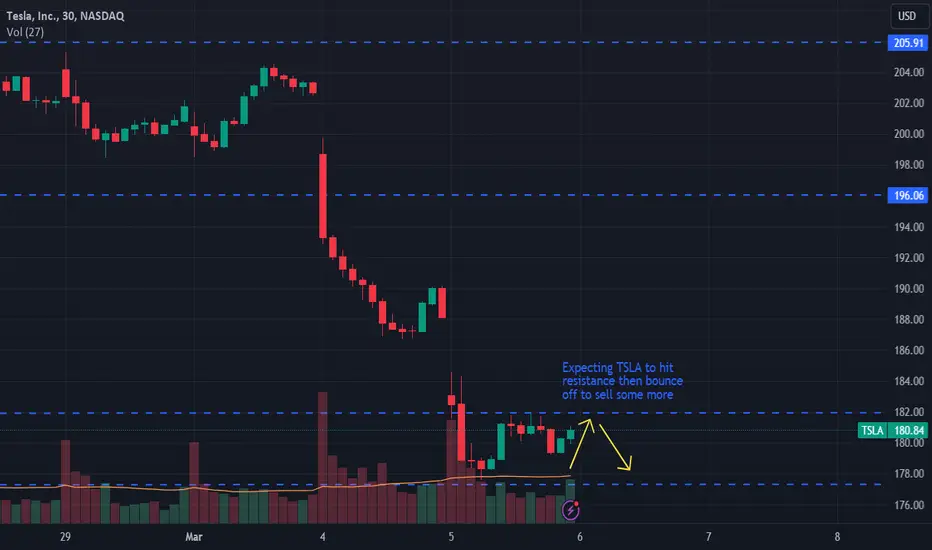
TSLATsla share repumped today to retest the broken upper trend
There are a lot of movement expectations :
1- The Price close above the Key LVL 205.30 then we can find the prices go up again to try to rebuild new wave (not expected by myself)
2- The price is retesting the upper trend showing at the drawing, so later on we will see push of selling the share and this is my expectation.
if the price go down i preferer to invest on it with the suggested percentages
Thanks and Best regards
Tslashort

tslaLooks about done with C wave of the wave 4 triangle.
Hard to say what E wave will do could do. Might extend or truncate or hit the bottom TL.
But minor wave 4 almost completed.

Tesla Stock in Limbo: A 43% Plunge Leaves Investors Wary Ahead oTesla, once the undisputed champion of the electric vehicle (EV) market, finds itself in a precarious position. The company's stock price has been on a downward spiral, tumbling nearly 43% in the last month. This dramatic decline has left investors apprehensive as Tesla prepares to report its earnings.
Several factors are contributing to the bearish sentiment surrounding Tesla. Firstly, concerns are swirling about the company's business strategy. Sales of electric vehicles have dipped, raising questions about whether Tesla can maintain its growth trajectory. The much-anticipated Cybertruck has yet to materialize, and delays in the rollout of the cheaper electric vehicle have further dampened investor enthusiasm.
Elon Musk, Tesla's enigmatic CEO, hasn't helped matters. His focus on ventures outside of Tesla, coupled with his penchant for making controversial pronouncements, has sown seeds of doubt among some investors. They worry that Musk's attention is divided, potentially hindering Tesla's ability to navigate the increasingly competitive EV landscape.
Adding to the woes is the overall market correction. Rising interest rates and inflation have dampened investor appetite for growth stocks, a category Tesla once dominated. Tesla's lofty valuation, currently sitting at nearly 47 times forward earnings, also makes it a prime target for a sell-off. This high valuation is particularly concerning given the recent sales slump and the uncertain outlook for the EV market.
However, there is a silver lining. The recent plunge has pushed Tesla's stock price into what some analysts call "no man's land." This means there's a significant gap between the current price and potential downside. While the stock could fall further, the dramatic decline has already priced in a considerable amount of negativity. This could pave the way for a "relief rally" if Tesla's earnings report isn't a complete disaster.
Some analysts believe the negative sentiment has been overblown. They argue that Tesla's brand recognition and technological prowess still position it well for the future. The upcoming launch of the Robotaxi service in August could be a game-changer, generating new revenue streams and reigniting investor confidence.
The coming weeks will be crucial for Tesla. The earnings report will be a watershed moment, determining whether the company can regain its footing or succumb to the current headwinds. Investors will be keenly watching for any signs of a turnaround in sales, updates on the Cybertruck and the cheaper EV rollout, and any concrete plans for the Robotaxi service.
Tesla's story is far from over. The company's future hinges on its ability to navigate the current challenges, deliver on its promises, and adapt to the evolving EV market. Only time will tell if Tesla can emerge from this "no man's land" and reclaim its pole position in the electric vehicle revolution.

Where Does TSLA Land?
Trend
- Downtrend confirmed.
- Components of the channel chart:
The original downtrend channel plus a 100% extended channel.
Both channels divided in half by blue dotted lines.
The shaded zones furthest from the center represent "overbought/oversold forces," which counterbalance each other.
- Currently, the price is descending into the extended channel, suggesting a chance of reaching the lower band of the extended channel.
- Note that when the price enters the orange shaded zone, it could move rapidly in one direction, as there is minimal previous support and resistance.
- The trend lines serve as potential support and resistance levels.
100% Symmetrical Projection: Downtrend “N” Patterns
- A 100% Symmetrical Projection of the previous swing (from A to B) and then projected from C. As a result, D is the initial target price on the short side.
- The 0.5 level from C to D serves as a clear support, enhancing the value of this projection.
N Pattern’s Target Price & Fibonacci Price Cluster
- The target price of $116 at level D aligns with a major prior low on the weekly chart.
- Levels 1 & 2 are significant due to the price cluster effect, demonstrating the validity of the extension of the prior major swing.
- Consequently, Level 3 has a good chance of becoming a critical support and a potential target price.
Conclusion
- In comparison with symmetrical analysis, TSLA's trend channel chart provides higher reference value.
- The dynamic target price is the lower band of the extended channel.
- The fixed target price (strong support) could be $122, followed by $116.
Not Financial Advice
The information contained in this article is not intended as, and should not be understood as financial advice. You should take independent financial advice from a professional who is aware of the facts and circumstances of your individual situation.

TSLA Tesla Options Ahead of Earnings If you haven`t bought the dip on TSLA:
nor sold the regional top:
Then analyzing the options chain and the chart patterns of TSLA Tesla prior to the earnings report this week,
I would consider purchasing the 140usd strike price Puts with
an expiration date of 2025-1-17,
for a premium of approximately $20.40.
If these options prove to be profitable prior to the earnings release, I would sell at least half of them.

TSLA Apr 19th UpdateI was #bearish #TSLA from the wave B top, even before it actually got hit.
We are at TTR looking for lower lows before any significant rally emerges.
TTR is also looking for much lower levels into end of the year!
Expect a move down to 144 and 135 next

Tesla Loses Half-Trillion Dollar Shine: Bulls Feeling the SqueezTesla, the electric vehicle (EV) pioneer, has hit a rough patch in 2024. This week, the company's market valuation slipped below $500 billion, marking a significant blow to investors who had placed big bets on Tesla's continued growth.
Several factors seem to be contributing to Tesla's woes. Firstly, concerns are mounting about the company's ability to maintain its breakneck growth trajectory. Recent reports indicate weaker-than-expected sales figures, leading some analysts to question whether Tesla can meet its ambitious production targets. Adding fuel to the fire, Tesla announced a round of job cuts this week, further amplifying anxieties about slowing growth. is decline coincides with a broader slump in the company's stock price, which has shed a staggering 37% so far this year.
Secondly, a recent exodus of high-ranking executives has rattled investor confidence. Several key figures have departed Tesla in recent months, leaving a void in leadership This instability at the top management level has cast a shadow over the company's future direction.
These developments have significantly dampened the enthusiasm of investors who had previously been bullish on Tesla. The company's stock has become one of the worst performers on the prestigious S&P 500 Index in 2024, erasing a colossal $290 billion in shareholder wealth. This decline marks a stark turnaround from the meteoric rise Tesla experienced in previous years, when its stock price soared on the promise of a revolutionary electric vehicle future.
However, some analysts remain optimistic about Tesla's long-term prospects. They point to the company's continued innovation in battery technology and its lead in the EV market as reasons for hope. They argue that the recent stock price slump presents a buying opportunity for those with a long-term investment horizon.
"Tesla has been through disasters before," said one analyst, "We maintain our outperform rating on the stock." This sentiment is echoed by others who believe that Tesla's core strengths remain unmatched and that the current challenges are merely temporary hurdles.
Only time will tell whether Tesla can weather this storm and reclaim its former glory. The coming months will be crucial as the company strives to address concerns about slowing growth, leadership changes, and a softening market. Tesla's ability to reignite investor confidence and reignite sales growth will determine whether the bulls can once again take the reins.

TSLA SHORT TREND REVESE The Tsla Bull Trend is no more. Utilizing Schiff pitchfork and trend lines, with recent supply chain issues and the amount of shares used to cover twitter deal, tsla bear trend is here.

Tesla's Production Numbers in Last QuarterI wanted to bring to your attention the recent news regarding Tesla's Q1 2024 deliveries. There are reports that deliveries fell short of expectations compared to the previous quarter. This development, along with concerns about the economy and evolving consumer preferences in the electric vehicle market, could have an impact on Tesla's stock price.
It's important to consider this news along with other factors, such as Tesla's long-term position in the EV space and overall market conditions when making investment decisions.
As always, it is important to conduct thorough research and analysis before making any investment decisions. Please feel free to reach out in the comments if you have any questions or would like to discuss this further.

Tesla Faces Headwinds as Q1 Deliveries Fall: What Lies Ahead?Tesla ( NASDAQ:TSLA ), the electric vehicle (EV) pioneer, finds itself navigating choppy waters as it reports a decline in first-quarter deliveries, sending its stock tumbling in early trading. With 386,810 deliveries, an 8.5% decrease from the same period last year, Tesla's performance has raised concerns among investors and analysts alike.
The company attributes the decline in volumes to several factors, including the early phase of production ramp-up for the updated Model 3 at its Fremont factory and disruptions caused by external events such as the Red Sea conflict and an arson attack at Gigafactory Berlin. These challenges highlight the vulnerability of Tesla's global supply chain to geopolitical tensions and unforeseen incidents, underscoring the need for resilience in an increasingly complex operating environment.
Moreover, reports of decreased production at Tesla's Shanghai factory raise additional questions about the company's growth trajectory. While Tesla's China-made vehicle sales remained flat year-over-year, despite a 33% increase in overall industry sales in China, the EV maker faces stiff competition from local rivals and mounting pressure to maintain its market share in the world's largest automotive market.
Chinese EV brands like BYD and Nio are aggressively expanding into new markets, posing a formidable challenge to Tesla's dominance. As these competitors gain traction both at home and abroad, Tesla ( NASDAQ:TSLA ) must reassess its strategy to retain its competitive edge and sustain growth in the face of intensifying competition.
The upcoming quarterly earnings report scheduled for April 23 presents a critical opportunity for Tesla ( NASDAQ:TSLA ) to reassure investors and reverse the downward trend in its stock price. Analyst opinions on Tesla's prospects remain divided, with some questioning the company's growth prospects amid mounting challenges, while others view the recent selloff as an overreaction, presenting an attractive buying opportunity for long-term investors.
However, the road ahead for Tesla ( NASDAQ:TSLA ) is fraught with uncertainty, as it grapples with supply chain disruptions, geopolitical risks, and increasing competition in key markets. As the EV industry continues to evolve rapidly, Tesla must demonstrate its ability to adapt to changing dynamics and deliver on its promise of revolutionizing the automotive industry.
Ultimately, Tesla's success hinges on its ability to navigate these challenges effectively and capitalize on emerging opportunities in the rapidly evolving EV landscape. While the recent downturn in stock price may dampen short-term sentiment, long-term investors may view this as a potential buying opportunity, betting on Tesla's innovative capabilities and disruptive potential to drive future growth.
Technical Outlook
Tesla ( NASDAQ:TSLA ) is Trading below its 200, 100 & 50-day Moving Averages (MA) respectively with a negative Relative Strength Index (RSI) of 37. indicating an oversold condition for Tesla ( NASDAQ:TSLA ) amidst market volatility.

TSLA Back at the $164.76 Support LineNASDAQ:TSLA is having a steep decline after failing to meet expectations for Q1 deliveries. The price is back at the $164.76 price level at the white support line. I think there could be a rebound here, and I would monitor the white trendline to see if the price level holds and rebounds in the short term. I think TSLA had a bearish Q1 performance, and there could be a dip into the $150 price levels before TSLA has a recovery. I think TSLA is likely to be bullish in Q2 so I'm looking for an entry over the next few weeks for a swing trade.

TSLA BEARISH !!Tesla (TSLA) has been an icon of innovation and disruption in the automotive industry, but recent developments indicate stormy weather ahead for the electric vehicle giant. Despite its past successes, TSLA's trajectory seems to be shifting towards a rocky road, with multiple factors signaling a potential downturn.
Production Hurdles: Tesla's ambitious production targets may be difficult to sustain, especially in the face of supply chain disruptions and increasing competition in the electric vehicle market. Delays or failures in meeting these targets could significantly impact investor confidence.
Regulatory Challenges: Regulatory scrutiny surrounding Tesla's Autopilot feature and concerns over safety standards pose a considerable threat to the company's growth prospects. Any adverse regulatory actions or increased oversight could lead to market volatility and downward pressure on TSLA stock.
Valuation Concerns: Tesla's sky-high valuation appears increasingly disconnected from its fundamentals. With a Price-to-Earnings ratio that far exceeds industry norms, TSLA's stock may be vulnerable to a significant correction as investors reassess its growth prospects and intrinsic value.
Market Saturation: As the electric vehicle market becomes more crowded, Tesla faces intensified competition from both traditional automakers and new entrants. This heightened competition could erode Tesla's market share and put downward pressure on its margins.
Macroeconomic Headwinds: Economic uncertainties, including inflationary pressures and geopolitical tensions, could dampen consumer spending and reduce demand for high-priced electric vehicles. Tesla's dependence on consumer confidence and discretionary spending leaves it vulnerable to broader economic trends.
Given these challenges, a bearish outlook on TSLA seems warranted. Traders may consider selling or shorting TSLA with a target price of $100, representing a potential return of 89%. This medium-term strategy aligns with the anticipated headwinds facing Tesla and offers an opportunity to profit from the stock's likely downward trajectory.
As always, traders should conduct their own research and consider their risk tolerance before making any trading decisions. Keep a close eye on key developments and market trends to adjust your strategy accordingly.

TSLA Rebounds from $164.76 Support LevelMy TSLA forecast has been one of my most accurate predictions so far, and TSLA has reached the $164.76 price target discussed in my previous updates. NASDAQ:TSLA initially dipped below the $164.76 support level, but had a bullish rebound at the support line. TSLA is red today, but could be forming a bullish retest of the $164.76 support line. I would keep an eye on the $164.76 support level on the way down to see if it holds or whether TSLA loses support here.

TSLA bearish outlookIf you follow me then you know that we played the GAP fill on NASDAQ:TSLA with success and now we look to change our view and go bearish. Some have sized this up as a Bear Flag but i see a rising wedge formation that has broken down and we look to short $TSLA. I have given it room to move with such a massive move down but we should see continued weakness and a break of the recent bottom.
More Pain for TSLA - $165 or LowerI get a lot of questions about TSLA, and I can tell that many of you are eager to buy this TSLA dip. However, I'm seeing a lot of bearish signs for TSLA and I don't think there will be a buy opportunity any time soon. The green support level has flipped into resistance, and TSLA is forming a strong move down this week. I have $164.76 as a key price target for a rebound. I think TSLA and the EV market are weak right now, we can see lower prices over the next few months.

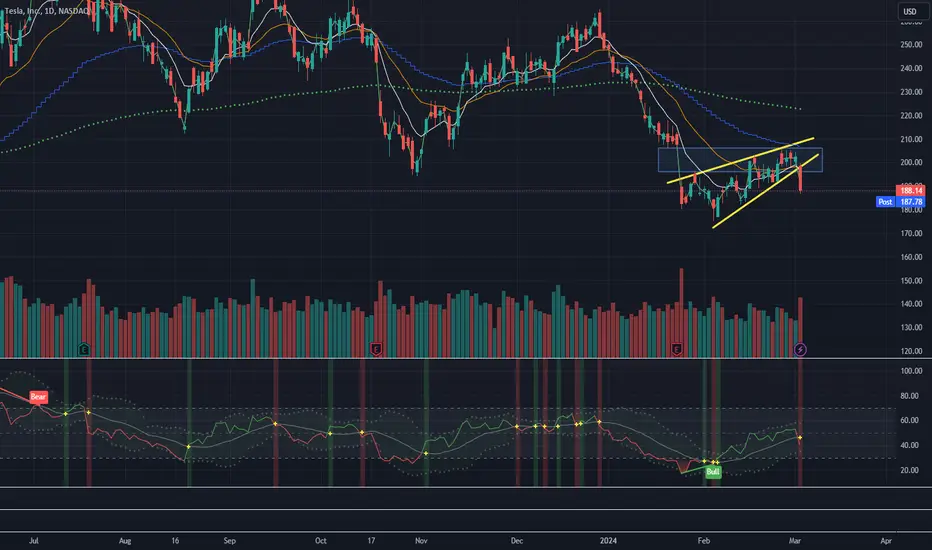
TSLA breaks below its support and tries to recoverTSLA has gone through a significant sell off recently from its high of 200. After breaking below its support line its has recovered some.
This does not appear to be a false breakout down as the stock has failed to recover enough to be above the resistance.
We should expect it to bounce off the resistance level and sell off some more.
Overall I remain bearish for the next month or so as the stock market starts its decent and Tesla is sensitive to market cycles
NAILED THIS ONE, TSLAFirst time hitting it right on the nose with a major stock. got the gap down on open the retest then they made it cheaper for everyone to buy in at the company tomorrow lol.

TSLA Reports and goes for a deeper dive SHORTOn this 4H Chart, I find good cause to continue my lot of 10 put options on TSLA. TSLA has
dropped another $ 25.00 per share price during the earnings report time frame. While the
overall long time frame supertrend is up, TSLA is presently in a sustained pullback likely due
to significant fundamental and economic factors. The antics of its CEO demanding an award of
more shares so he can launch a big AI initiative within TSLA is not helpful. He has taken a big
haircut but he can easily afford it.
In the analysis, TSLA has put in a bear flag which suggests more bullishness in the continuation.
The ceiling of resistance right now is the POC line of the volume profile at 230. If price can
get through that then 265 at the top of the volume profile's high volume area might be
achievable. A bottom may be the second lower VWAP band at 175 which could be reachable
in the latter part of the upcoming week. Weakness in the Chinese economy is a heavy weight
on TSLA right now. Bright days ahead but some pain and chaos in the meanwhile
Trade plan: I will hold the puts until I see a reversal pattern on the 30-60 minute charts and
then close them. If no reversal pattern in the upcoming week, for purposes of time decay
complications I will roll the puts out another 28 days. Overall, TSLA continues to pay traders
well some of them might buy a TSLA to return the favor with the profits received especially
if there are more price cuts on the horizon that do not adversly effect margins and fec\deral
subsidies are extended they would be an uplift to sales, revenue and outlook overall.

TSLA beginning another leg down SHORTOn the 15-minute chart, TSLA has been in a downtrend and for about one week, a correction
has been underway. Based on a Fibonacci analysis of the downtrend and and its retracement,
I do not believe that TSLA will breakthrough the fib level zone. The zero-lag MACD is showing
bearish divergence from the price action. In that consideration, I have held my put options
through this correction suffering unrealized losses but now look forward to another leg down.
Musk's recent court ruling nullifying his compensation package in federal court lends a bearish
perspective as does his distractions with the brain implant company which now has its first
patient ( FDA approved) and of course the space and tunnel companies. ( Autism and ADHD
can be a blessing and a curse at the same time - IMO) I am long LCID given its Saudi Arabian
support and growing production schedules supported by the SA plant. For now I am content
to short TSLA until the Meusk drama settles down and the watch to see if price lowering will
expand demand numbers et cetera.

TSLA Technical Analysis and Trade IdeaMarket Observations: #TSLA has experienced downward pressure as evidenced by the distinct pattern of lower highs/lows on the daily chart, signaling a clear downtrend. A significant price gap exists above the current trading range. This setup suggests a potential stop run above the range to clear liquidity, providing an opportunity for larger institutions to fill short orders.
Trade Strategy: Target a short entry on a potential stop run above the range. Aim for an initial profit target at the previous daily low, with a secondary target at the 165 level, which aligns with a prior daily low. Manage risk with a strategically placed stop-loss order.
Disclaimer: This analysis reflects my personal opinion and does not constitute financial advice. Always conduct your own comprehensive research and risk assessment before executing any trades.

Tesla - A Head & Shoulders in a H&S :DFrom the base of the most recent rally to the selloff at the major neckline, price has retraced about 80% of its gains, leaving us with 20% left from the last low. Its expected to see continuous selling pressure until $155, and a possible spike-out around $133.
First lets confirm local support lvls (30min - 1min) for a reversal back to liquidity (~$216) to only selloff once again.
Buyers displayed aggressive price action from $110 and $155 which is overall bullish in the long term.

"Tesla Stock Teeters at Critical Levels" - TSLATSLA Stock: Navigating Critical Support Amidst Growing Concerns
Tesla Inc. (TSLA), once the darling of Wall Street and a symbol of disruptive innovation in the automotive industry, finds itself at a critical juncture as it grapples with mounting pressure from investors and market dynamics. With the stock facing significant headwinds, analysts are closely eyeing key support levels, with $165 emerging as a crucial threshold that could determine the fate of TSLA's trajectory.
Testing Support:
The $165 mark represents a major area of support for TSLA, a level that, if breached, could unleash a cascade of selling pressure, potentially triggering a sharp decline in the stock price. Analysts and market participants have long viewed this level as a critical pivot point, given its historical significance and its role in shaping investor sentiment.
Technical Analysis:
Drawing on technical analysis, TSLA's current price action paints a concerning picture. The stock has encountered staunch resistance at the top of the market, forming what appears to be a triple top pattern. This pattern, characterized by two lower peaks (shoulders) and one higher peak (head), is often interpreted as a bearish signal, suggesting a potential reversal in trend.
Moreover, the $165 level holds added significance as it coincides with the start of the bull run in June 2019, signifying a pivotal point in TSLA's ascent. What was once a stronghold of support has now transformed into a formidable barrier, acting as a barrier to further upside momentum.
Market Sentiment:
Investor sentiment towards TSLA has soured in recent months, as concerns over valuation, execution challenges, and macroeconomic headwinds weigh on the stock. The previous bull run, characterized by extreme growth and exuberance, has left TSLA vulnerable to a correction, with many market participants anticipating a pullback of significant magnitude.
Outlook:
Looking ahead, the consensus among analysts suggests that TSLA is poised for further downside, with the $165 level serving as a make-or-break point. Should the stock fail to hold above this critical support level, the potential for a sharp downturn looms large, with some forecasts suggesting a correction of more than 50%.
While such projections may appear dire, they underscore the importance of risk management and prudent decision-making in navigating turbulent market conditions. Investors are advised to exercise caution and closely monitor TSLA's price action in the coming days and weeks, as developments unfold.
In conclusion, TSLA's stock finds itself at a crossroads, with $165 emerging as a pivotal level that could determine its future trajectory. As market participants brace for a potential breakdown, the need for vigilance and preparedness has never been greater.

1/25 Massive Tesla Red Day Recap and 1/26 Prediction From DataAfter today's price action, it is clear that investors are at disarray and uncertain for the future of Tesla. Here I will detail my analysis of today 1/25, and my predictions for tomorrow 1/26.
In the graph, I plotted three possibilities pre-market 1/25 (from previous Idea, "Looking at Possible Dead Cat Bounce Levels"):
Purple line-arrow (Most optimistic): A bounce of it's low and decay to $188-$190.
Yellow line: Bounce off 0.618 fib line and decay to $185-$186.
Red line (least optimistic): Minimal bounce, straight to $180.
It looks like we went worst case scenario, hitting my $180 target faster than I expected. This confirms investor sentiment; at least until we get some good news from Tesla and guidance.
For tomorrow's price action, I also have three possibilities in mind, so I will look at previous price movements in similar scenarios, as well as use what we know after today to get an some possibilities.
During the last two (Q2, Q3) quarterly earnings, Tesla stock continued dropping for the two subsequent days.
Q2: An additional 2.75% down from previous close.
Q3: An additional 4.3% down from previous close.
Today's event seems different, where the 12%-15% dip that Q2 and Q3 earnings experienced over multiple days seem to have happened in one day.
I'll list the possibilities by what I believe is least probable to most probable:
Blue line: bounce of $180 support and rise to $186-$188 range. I call this less probable because an increase on the day after a dip after earnings is odd (compared to Q2 and Q3 earnings.) Not impossible though, in the case that today's dip was an over exaggeration and a bulk of investors remain optimistic. (Buyers sitting on the sidelines?)
Yellow line: Bounce between channel $180 - 183.50. I think this is a bit more possible because investors may be sitting in indecision, hoping to wait it out until more news is revealed (low volume perhaps?)
Pink line: Dip below $180 to next fib line $176, and possibly lower. I personally think this is more likely, because it will be line with Q2 and Q3 instances (a dip of 4% from today.) Investors may begin thinking about opportunity cost in holding a stock with no guidance, expectations not met. Investors are in Tesla not because it is a value stock, but because it's a growth stock, and if there is no exciting growth, they may start looking to sell off for competitors that are showing the 100%+ quarterly growth in EV sales.
I may revisit a long term analysis of the stock in the future, but for now, those are all my thoughts for tomorrow.
