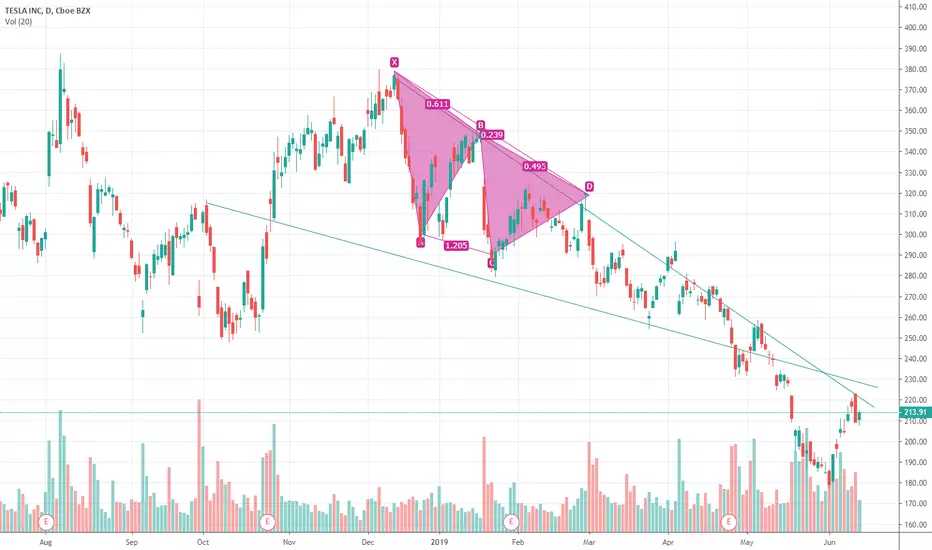
The Next Target for Tesla Is DOWNTesla just finished its 3rd wave or C Wave, we simply do not know that yet.
We are aiming for a 0.5 retrace to 278.
A stoploss should be set at 358.
Tslashort

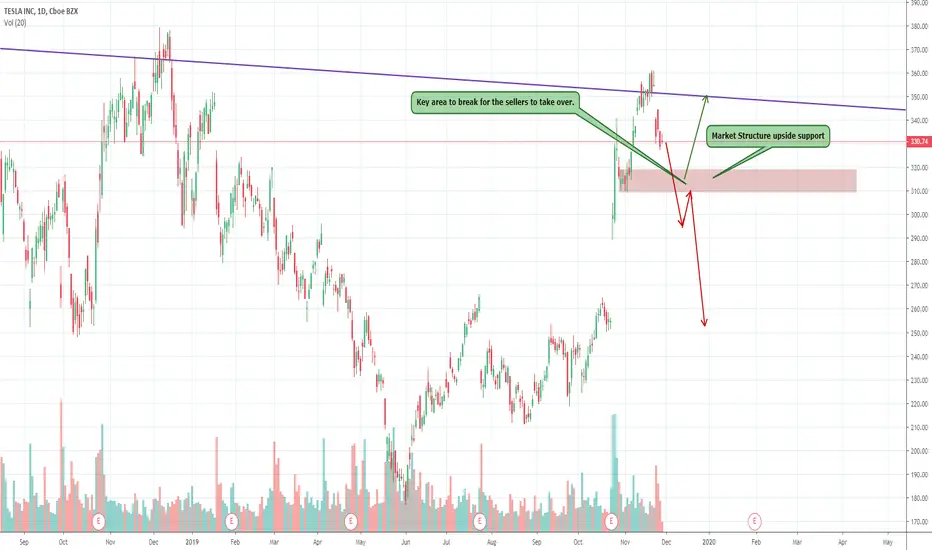
Tesla potential short through support down to $260On an overall trend, TSLA has been forming lower highs if you extend the view on a weekly chart. The new low at $360 based on the previous high on a larger timeframe suggests another impulse move lower. The pop above $300 was due to the earnings report that managed to beat finally on a positive note which got investors extremely excited. We suspect some more downside to erase some of the earnings euphoria after the release of the new Tesla truck. There is a level at $310 that may hold support based on market structure. The move is very overextended from the Fib extension hitting the 161.8% extended level before showing signs of resistance. A break of $310 will open the downside and a potential gap fill into $260.
TESLA, DeLorean AND SO ON !!Hello Everybody, I hope you had an amazing weekend and ready for the opportunities of coming week.
And hello TSLA. Dude your chart was telling me the story of Cybertruck presentation even before :) 2 Short targets are represented on the chart. SL: '' a closing daily candle right over the resistance area represented in red color ''
For macroeconomic articles and comments you can follow me on twitter.
This idea is not a piece of investment advice.
Regards,
Zelal Ada


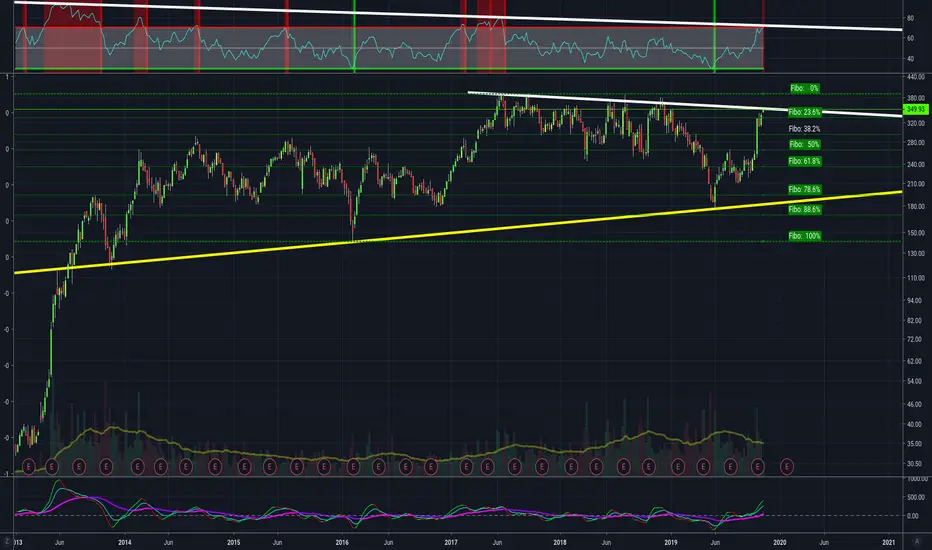
$TSLA -- ALMOST Ready to short!Oink Oink -- You know what they say... Pigs get SLAUGHTERED lol.. $TSLA looks like it will be an amazing short play real soon... RSI divergence and running up into top trendline on the Weekly Log chart -- get ready to short this loss making SOB lol
SELL TSLA SHORT TERMITS THE PERFECT DEFINITION OF "BUY LOW SELL HIGH" TESLA STOCK JUMPED ALOT THESE DAYS BUT A DOWNFALL IS INEVITABLE.
THIS TRADE IS BASED ON SPECULATION SO TRADE AT YOUR OWN RISK.

$TSLA Sell The Rally, Too Much Resistance OverheadBulls are rejoicing and shorts are scrambling after $TSLA earnings report.$TSLA delivered a surprise earnings beat and solid Q3 deliveries number. However, the top line tally of $6.3B relied on deferred revenue and was below expectations. It also marked Tesla's first annual sales decline since 2012.
JPMorgan is sounding some caution after seeing the initial 20% pop in shares. The analyst team doesn't think the quarter is a "breakout" moment for the EV automaker.
We think the risk/reward favors new shorts versus new longs.
As always, trade with caution and use protective stops.
Good luck to all!


TSLA before rising 33%... The exchange moves symmetrically to the MA100 axis. Therefore, it is assumed that it has reached the level of adjustment. In the case of the symmetric wave cycle, I assume that a further rising wave system may develop. The target price for this is 304usd. I note that the intrinsic value of the TSLA stock and the fair value of the stock are also close by.

TESLA INC TSLA Short after earnings TSELA tanks after the earnings announcement and will possibly continue to make a new range between 277 and 175.
Therefore its a nice SHORTING opportunity for traders.
If TESLA go back up towards 250-275 levels to close some of the GAP created after earnings, it will be a nice area to get short with stops above 336 (76% of the recent FIB retracement) and target 175 levels

NIONIO is about to do “reversal correction” which covering up whole downfall wave. Targeting $6.98 first.

Timed short sell of TESLA #TSLAThe company is still unable to make money , with Long Term Debt/Equity ratio of 2.13 and Net Profit Margin of -4.30% I do not expect this to change any time soon.
Even stronger quarter cannot compensate for more executive and staff departures, that are apparently picking up speed again, with reports saying the electric-car maker has lost its head of Europe and a top engineering manager.

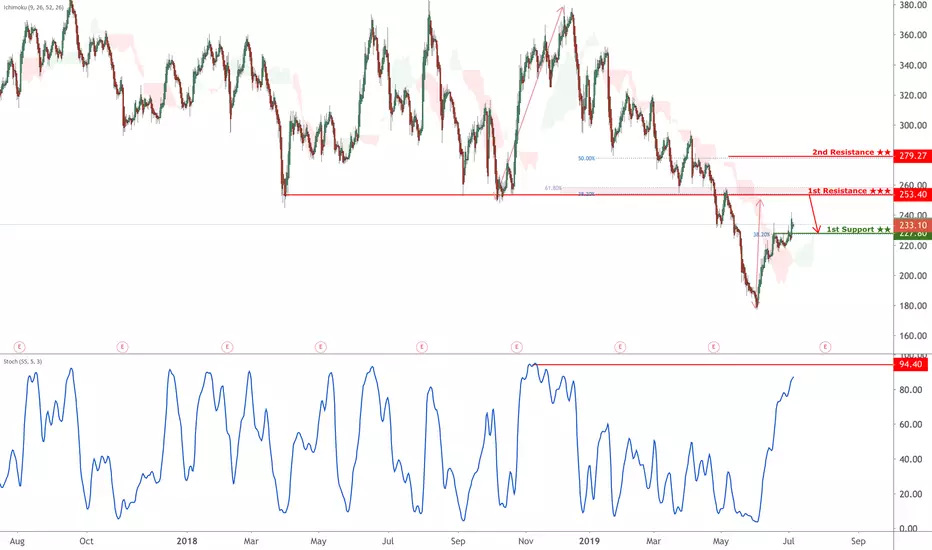
TSLA potential reversal!
TSLA expected to rise up to 1st resistance at 253.4 where it could potentially react off and drop down to 1st support at 227.80.
Trading CFDs on margin carries high risk.
Losses can exceed the initial investment so please ensure you fully
understand the risks.
TSLA ultra longterm predictionChamath Palihatipiyah formulated it perfectly: People who bet against this company are incredibly short sighted. They don't see the bigger picture here.
Tesla is a company like Amazon in the early 2000s.
Tesla is like Bitcoin 8 years ago.
It is one of the companies with the greatest upside potential ever.
The shorters get caught up in all the FUD stories, proudly sponsored by Big Oil, old Auto, and anti Tesla shorters like the idiot Jim Chanos.
They start to believe all the FUD.
If I would have believed all the FUD about bitcoin, I would never have bought my first bitcoin back in 2013.
I gained financial freedem by NOT listening to other people, especially not the damn news media. They are just a propaganda tool of the old industries, who are desperate, because they
know deep down that Tesla will succeed and destroy them.
We are now still in the second phase, the "then they fight you" phase.
But all new disruptive technologies win in the end, ALWAYS !!!!
So Tesla will see highs in the coming 10-15 years, that we cannot even imagine yet.
Think Amazon's growth after 2000.
This is a company by a man who WANTS TO COLONIZE MARS, for god's sake.
How people can be so short sighted, I will never understand.
If you see the bigger picture here, then you know that TSLA is going to succeed and become one of the biggest automakers worldwide by 2030.
And by then, maybe we'll even have the mars colony thanks to Elon Musks SpaceX, and have specially adapted Teslas also driving on Mars, hehe.

TESLA, short it! or don't touch while the downtrend is hereare you KEEP CALM because it's TESLA? Do you still think the price will fly high and high? Relax, and think again. The strong downtrend on the week chart is just attracting new money into the bear lair.
To confirm my words, I recommend you to open 1W chart and look at EMA lines.
Time Frame : 4H
Resistance ~ $230-240 ($245 max)
Support ~ $200
Enter: ? only if you're a bear, then ~ $245, buy PUTS.
TP 1 ~ Lower then $200
I have the subreddit with the same name, if you wanna ask me or community, feel free to do that. Hit like, comment and follow for more profitable ideas.

Daily TSLA forecast timing analysis by Supply-Demand strengthStock investing strategies NASDAQ:TSLA
View a Chart with Supply-Demand(S&D) strength forecast: www.pretiming.com
Investing position about Supply-Demand(S&D) strength: In Rising section of high profit & low risk
S&D strength Trend Analysis: About to begin an adjustment trend as a upward trend gradually gives way to a slowdown in rises and falling fluctuations
Today's S&D strength Flow: Supply-Demand strength has changed to a strengthening buying flow when stock market opening.
D+1 Candlestick Color forecast: RED Candlestick
%D+1 Range forecast: 0.5% (HIGH) ~ -1.0% (LOW), -0.2% (CLOSE)
%AVG in case of rising: 2.8% (HIGH) ~ -1.4% (LOW), 2.2% (CLOSE)
%AVG in case of falling: 0.6% (HIGH) ~ -3.0% (LOW), -1.8% (CLOSE)
Stock Price Forecast Timing Criteria: Stock price forecast timing is analyzed based on pretiming algorithm of Supply-Demand(S&D) strength.

TSLA stock price forecast timing analysis. 13-JunStock investing strategies by pretiming
TSLA
Investing position about Supply-Demand(S&D) strength: Rising section of high profit & low risk
Supply-Demand(S&D) strength linkage Trend Analysis: In the midst of an adjustment trend of downward direction box pattern stock price flow marked by limited rises and downward fluctuations.
Today's Supply-Demand(S&D) strength Flow: Supply-Demand(S&D) strength flow appropriate to the current trend.
Possibility of change in forecast timing: Forecast timing has low variability conditions. because they maintain the proper flow of supply - demand in the current trend.
D+1 Candlestick Color forecast: GREEN Candlestick
%D+1 Range forecast: 0.5% (HIGH) ~ -1.4% (LOW)
%AVG in case of rising: 2.7% (HIGH) ~ -1.6% (LOW)
%AVG in case of falling: 0.7% (HIGH) ~ -3.1% (LOW)
Stock Price Forecast Timing Criteria: Stock price forecast timing is analyzed based on pretiming algorithm of Supply-Demand(S&D) strength.
Read more a detailed Forecast Analysis Reports that candlestick shape and %change, S&D strength flow in the future 7 days.
www.pretiming.com
Tesla Short ReversalHi guys its Brian here with a short opportunity for Tesla.
Tesla is currently in a downtrend ever since start of the year as seen by the downward sloping trend channel. The price has also always been consistently below the ichimoku cloud from February onwards.
Tesla reached the support level of about 175 level at the start of June and showed an upward correction but the correction is starting to end as seen by the strong red candle upon hitting the blue trend resistance channel. Volume also increased on the 2nd red candle showing there is strong bearish pressure driving prices downwards.
If shorting here, take profit could be set at about 195ish or even the previous support level at 180ish
www.brianchai.com
Free Trading Group


Opportunity to short Tesla?TSLA is bumping against the cloud that may prevent upside .. consider adding to short positions here for the short term.

TSLA Count With Elliot Wave - Parabolic Movement Ahead. I noticed that every time i did trend based fib extension, of TSLA i always get a 1:1 count. You can clearly see the correction, when it bounced of the wave 3 at 252. Now it did EXACTLY the same from wave 5.
Which means 5 waves are done, and we have a huge move ahead of us.
First Target is: 350 USD

TSLA Short to 180Ahoy there mateys! Let's dive right in.
TSLA fundamentals are arguably weak, the EV market is becoming more and more competitive. We're seeing strong entry into this market from the likes of Volvo, BMW and now even Porsche has a nice EV coming. We can also see demand softening for TSLA clearly evidenced by recent price drops on the vehicles. In a period of rising demand, you do not lower prices, therefore you can infer we are seeing weaker demand for TSLA's offerings. TSLA stock has long had a price in moat on the EV market which is arguably being eroded as others develop their technology.
TSLA also has some potential liabilities related to Elon's loud mouth and defiant attitude towards the SEC and that really doesn't have much in terms of upside, but plenty of downside. Another speculative component of this short, the really high turnover in TSLA's financial and accounting departments. Especially after a quarter of posting record revenue and EPS. You have to wonder if there are some greater accounting issues at play when you see senior accounting staff quickly departing the company.
Now, we can tear apart TSLA fundamentals all day. Looking at this from a technical and pattern oriented perspective we have a great short opportunity lining up. An arguably overvalued business with success priced in, facing a lot of uncertainty, is a prime short.
We can see head and shoulders pattern forming on the weekly chart. The neckline has now broken and we are seeing the price fall below the 200 MA line (consistent with the neckline of the head and shoulders pattern). We can also see the 50 MA crossing the 100. I think we will see a reversal of the long-term uptrend, signaled by this neckline break, and TSLA should fall sub 200 as it searches for its next support level. A fib 78% retracement puts us at the 180 price level.
To be fair, I've been trading this short since 280 -- now with the neckline break and this fall under the 200 MA I have increased confidence in this short and am entering a larger position. I'm expecting this to be trading sub 200 by the end of June 2019. I will be keeping an eye out for any price bounces to increase my short position.
This is not investment advice, just my own thoughts and analysis. Trade at your own risk.
Thanks for reading!
