TSLA (Tesla Wait For Sell)Wait for the break of this range (240 range).
After confirmation, we can take a profit of almost 10% in the sell trade from this stock.
Confirmation: "The closing of the negative candles below this level and the close of other candle close to 238 (my entry point) is confirmation for this failure".
Tslashort

TESLA struggling at the Warning-LineThe bounce back to the Warning-Line seems to create another short.
Unfortunately there is no structure to hide behind.
Maybe this is a play for a Options Strategy, rather than a raw short?

I'm likely to Short TSLA this weekBearish energy right now, for this stock and the Market as a whole.
Coming up to a Low-Volume node on Market Profile.
Point of control on this is sub-200 (!)
I'm watching for continued weakness, and then a fall to 210-ish.


TSLA - AnalysisTSLA
W1 – Since the indices (SPX\NASDAQ) are demonstrating a noticeable slowdown in movement and reversal/downward correction patterns may already begin to form.
You can also try to consider corrective sales.
It can be seen that the 5th wave is still being worked out, but a slowdown is also visible.
Global purchase plan with a target up to 415.32.
It is also clear that a potential reversal of the movement may begin to form; if the pattern is fully formed, then you can see the target in the nearest values 212.69 - globally 101.51.
For further decline, it is necessary to consolidate at the level of 212.69.
What can you expect?
At this stage, you can consider selling with a target of up to 212.69.
Short
Targets – 245.18 – 225.58 – 212.69
Long-term perspective – goals 212.69 – 152.88 – 101.51

$TSLA It shows a repeated Pattern! It show a Pattern we have seen before.
I see Tesla going till 400/600, but I believe it's not yet that moment.
Why not go low and get all the Buyers back in to FLY TO THE MOON.
Tesla is still the most Famous stock because of Elon Musk.
If he doesn't change, get sacked (Steve Jobs) or stops Tesla.
It will be the Future product!!!!

TSLA SUPPORT AND RESISTANCETSLA major support zone:~$180-$200,
(0.5-0.618 Fibonacci Retracement Level)
The major resistance zone is at ~$300-$350,
which have rejected once at $300

Oh Ok I See You $TSLA...After yet another monster move for TSLA, I am not moved. Today's move confirmed a bullish break of the smaller wedge with the much larger wedge (signified by the red and green trend lines). Long story short, I see a move into the gap above which should bring TSLA to around $285 before it starts its fall down to at least $235 . Still unclear whether it will break out of this wedge anytime soon but these are the price targets I am expecting for now. I could be completely wrong but Only Time Will Tell ...

TSLA D.B. or Next Leg Down?Here is both a bullish and bearish perspective of TSLA. Momentum is currently bearish right now but so ill be more keen to to taking puts at open BUT if price where to break the green level it will stop many bears out and there will be plenty liquidity for an explosive move to the upside for Calls. Be patient because nothing is ever 100% in the market.

TSLA: Hit Major Resistance Area, Correction is Incoming?Hello Fellow Stock Traders, Here's a Technical Analysis of TSLA!
TSLA has demonstrated noteworthy price development, reaching a significant resistance level and resulting in a price gap. Subsequently, a bearish divergence has emerged, implying the possibility of a trend reversal or downward movement. Moreover, TSLA is presently forming a double-top pattern, which may signal a potential breakout scenario, indicating further downward movement toward the initial target area near the EMA200 Line. Subsequent to this, a probable pullback to the neckline area is expected, followed by a continuation of selling pressure towards the second target area.
Considering these technical factors, the current price action, and the indicators, a negative outlook is projected for TSLA. This suggests a potential downward trajectory in the near term.
It is essential to note that the analysis will no longer hold validity once the target/resistance area is reached.
Please support the channel by engaging with the content, using the rocket button, and sharing your opinions in the comments below!
Disclaimer:
Please note that this analysis is solely for educational purposes and should not be considered as a recommendation to take a long or short position on NASDAQ:TSLA .

Does Tesla Lowering Car Prices Concern Among Traders?Introduction:
In recent news, Tesla, the renowned electric vehicle manufacturer, has made headlines again by announcing a significant reduction in the prices of their car models. While this move may seem appealing to consumers, it raises concerns within the trading community regarding the potential implications for Tesla's stock value. In this article, we will explore the reasons behind Tesla's decision, examine the potential impact on the car market demand, and discuss a call-to-action for traders considering shorting TSLA amidst this situation.
Understanding Tesla's Price Reduction Strategy:
Tesla's decision to lower car model prices can be attributed to several factors. Firstly, as the electric vehicle market becomes increasingly competitive, Tesla aims to maintain its market share and attract new customers by offering more affordable options. Secondly, the company's ongoing efforts to streamline production and reduce manufacturing costs have allowed them to pass on these savings to consumers. Lastly, Tesla's long-term vision of revolutionizing sustainable transportation involves achieving economies of scale, which can be facilitated by lowering prices and increasing sales volume.
Potential Impact on Car Market Demand:
While lower prices may initially spark interest and boost sales, considering the broader implications for the car market demand is crucial. As Tesla reduces its car model prices, other manufacturers may be compelled to follow suit, leading to a potential price war. This scenario could decrease profit margins across the industry and impact the overall demand for electric vehicles. Moreover, with the global economic uncertainty caused by the ongoing pandemic, consumer spending patterns may be more cautious, further dampening the demand for higher-priced electric vehicles.
Call-to-Action: Shorting TSLA Amidst Dropping Car Market Demand
Traders, it is essential to closely monitor the evolving situation in the car market and consider the potential impact on Tesla's stock value. As the demand for cars, especially higher-priced electric vehicles, faces potential challenges, shorting TSLA could be a prudent strategy. By shorting TSLA, traders can profit from the anticipated decline in Tesla's stock value.
However, exercising caution and conducting thorough research is crucial before making any investment decisions. Analyze Tesla's financials, monitor market trends, and stay updated with the latest electric vehicle industry news. Remember, shorting a stock involves risks, and it is advisable to consult with a financial advisor or professional trader to determine the best course of action based on your individual risk tolerance and investment goals.
Conclusion:
As Tesla lowers car model prices, it is natural for traders to express concern about the potential impact on the company's stock value. By closely monitoring the evolving car market demand and considering shorting TSLA as a possible strategy, traders can capitalize on the anticipated decline in Tesla's stock value. However, it is crucial to approach this decision with caution and seek professional guidance to mitigate risks and make informed investment choices.

Tesla Broke Key Support LevelHello Traders,
It appears that Tesla had a break of market structure at a key area ($239). Price retested the $239 level but face rejections leaving a wick.
Since the key level has been violated, I will anticipate Tesla to fall

TSLA not looking so good for bullsWeekly chart. Price has broken below channel support and the RSI as well.

TESLA An opportunity to buyHi, according to my analysis of Tesla stock, there is a great long-term investment opportunity. Especially with a downward channel break. With a very green positive candle on the daily timeframe. outside the parallel channel. good luck for everbody .Note: If you like this analysis, please give your opinion on it. in the comments. I will be happy to share ideas. Like and click to get free content. Thank you

Tslar to Reward Bulls Traders with 450 pipsElon Musk Tslar had made a giant strive of a long continued Higher Highs for a quite sometime till the most recent retracement which is normal as the stock uses this retest to gather another momentum that may likely push the price to a higher high or a worst an equal highs before change in bias especially for SWING TRADERS,
According to DANCOLNATION CAPITAL TRADING STRATEGY, a bounce and retest to provide a bounce off that will provide a small SL, then shall we go into the trade with our TPs at various minor key zones

TESLA - Evidence of a Correction and BUY AREAS to look atHello guys!
This idea is shown on the 1 Week Timeframe. This weeks candle HAS NOT YET CLOSED.
We have currently interacted and have been REJECTED by a powerful RESISTANCE line (in BLACK).
If we look back into the HISTORY of TESLA interacting with this line, we can see that:
1. Nov. 1st 2021, it pushed price down for about a 23% correction, which took about 49 days to complete
2. On Jan 3rd, 2022, after another attempt to test -> it pushed price down for an almost 42% price drop, which also took about 50 days.
3. On April 4th, 2022, for the 3rd time we tested this line causing a price drop of about 45%, taking about 49 days. This one however would ignite the price drop to 100$ TESLA.
My targets for this correction are associated with the FIB RATIO
Note currently: Our current weekly candle is below the 0.786 level of $258.42. If we close below and CONFIRM in the next couple weeks, it strengthens the idea that we go down further. We would need to STAY ABOVE this level for us to see another attempt to test BLACK LINE.
From the BLACK LINE and the price level we hit of around $298, we have to date dropped roughly 16%.
We also have some SUPPORT at $240.
Our next targets are:
1. 0.618 level, which is at $225 (Which is about a 15% drop, from current TOP)
2. 0.5 level at $201 (Which is about a 3% drop from current TOP)
So basically my POTENTIAL BUY ZONE would be a range between $225 - 200.
NOTE ALSO: the 1W 200 MA, moving up fast to converge at the 0.5 FIB level. This would be a critical SUPPORT zone.
Though the current price action DOES NOT have to follow this at all, other clues are seen that makes me think we are now in a similar corrective mode. Particularly in the indicators i have shown.
Firstly, RSI -> Here notice looking back in history every time ORANGE RSI line moves below the BLACK MA and into the RED RECTANGLE ZONE, it coincides with a PRICE CORRECTION.
CURRENTLY -> We have peaked our head below but have not yet CONFIRMED. Need to keep an eye.
Next is STOCH RSI -> this shows momentum, crossing above 20 level is BULLISH, BUT crossing BELOW the 80 level is indication that BEARISH momentum is coming in, With the BLUE LINE crossing below the ORANGE. Notice though, the ORANGE line has not caught up with BLUE yet. So if this is seen, Days end Friday means we have further downside.
Lastly, is the MACD which is also a momentum indicator. Here notice how the GREEN histograms are getting smaller and lighter. This is an indication of decreasing BULLISH momentum, with the present of the flattening BLUE line. If it continues to get smaller and lighter, and in a couple of weeks we see RED with a CROSS of the BLUE line go under ORANGE, this is BEARISH.
CONCLUSION:
In my opinion, we are currently in the beginning stages of a CORRECTIVE move in TESLA. If confirmations occur where price is below the 0.786 FIB level, and within the indicators we may have further downward action. It is then important to continously monitor this and in the coming weeks it will become clearer.
Thank you! For updates on TESLA and on other ideas in the market, FOLLOW me! If you liked this content, please do boost, follow and comment!
DISCLAIMER: This is by no means financial advice, i am NOT a financial advisor. The content here is my opinion and for TA educational purposes. When trading do work out your own strategies and focus on risk management.

Tesla -> Protect Your Position Now!Hello Traders and Investors ,
my name is Philip and today I will provide a free and educational multi-timeframe technical analysis of Tesla 💪
After Tesla stock retested the last strong support zone for bulls, the 0.786 fibonacci level at the $100 level, the recent pump over the past couple of months of more than 100% was no surprise at all.
With the weekly timeframe being quite overextended on Tesla, I would actually love to see a retest of the 0.618 fibonacci level which is perfectly lining up with previous market structure.
From a daily perspective you can see that Tesla is starting to create lower lows and lower highs so there is the chance that we are ready for a shorter term bearish correction - I do expect this correction to end though after we saw a retest of the $220 level.
Keep in mind: Don't get caught up in short term moves and always look at the long term picture; building wealth is a marathon and not a quick sprint📈
Thank you for watching and I will see you tomorrow!
My previous analysis of this asset:

DBL TOP/Down Trend on TSLA 267 down to 241 214 area?Touched the top Bollinger Band on long term so 21 SMA in sight, to touch that now. 241 230 220 214 200.


TSLA Tesla Options Ahead of EarningsIf you haven`t bought the trend reversal move:
or the Bullish Pennant Pattern:
Then analyzing the options chain of TSLA Tesla prior to the earnings report this week,
I would consider purchasing the 280usd strike price Puts with
an expiration date of 2023-9-15,
for a premium of approximately $21.65.
If these options prove to be profitable prior to the earnings release, I would sell at least half of them.
Looking forward to read your opinion about it.

$TSLA topping?NASDAQ:TSLA has the potential to see one more push higher to the upper resistance, or it could top right here.
Regardless of what happens in the very near term, this chart shows the range that price should trade in over the next year (which is largely to the downside).
If price decides to roll over here, then the first big target should be $184.
However, I don't think NASDAQ:TSLA will bottom until it hits one of the two lower resistances sub $100.

TSLA: Good luck shorts, heading to $500-700TSLA with a very bullish setup. Clean 5 waves up and 3 waves down. Broke through the resistance curve and successfully retested. Fib extensions point to $520-700. Shorts will cry.

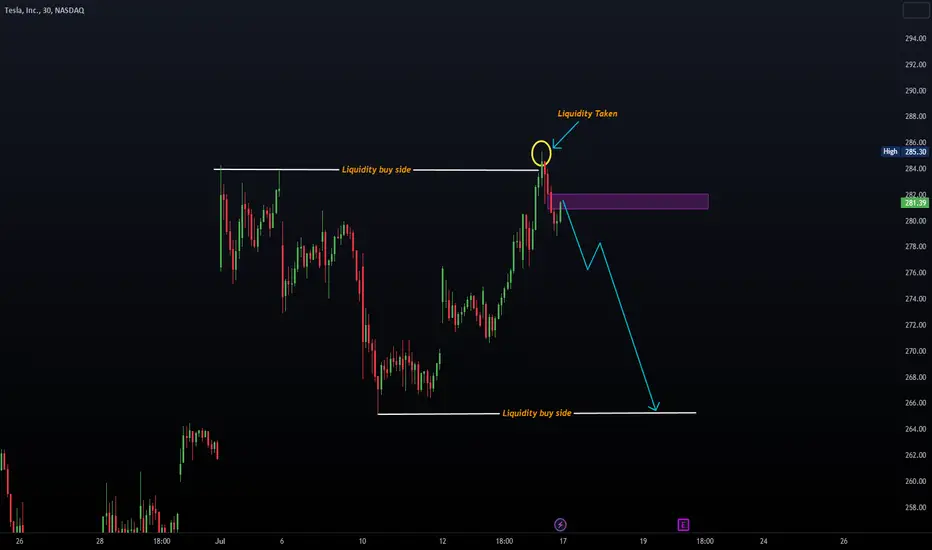
TESLA TRADEAtfer taken liquidity of buyside we will see a distrubution to wards sell side liquidity . FVG '' Fare Value Gap '' can be considered as an entry point .